Calculateur NPV et IRR Modèle Essentials
Calculez la valeur actuelle nette et le taux de rendement interne pour des projets d'investissement. Saisissez les flux de trésorerie et un taux d'actualisation pour évaluer les investissements potentiels.
Ce qui est inclus
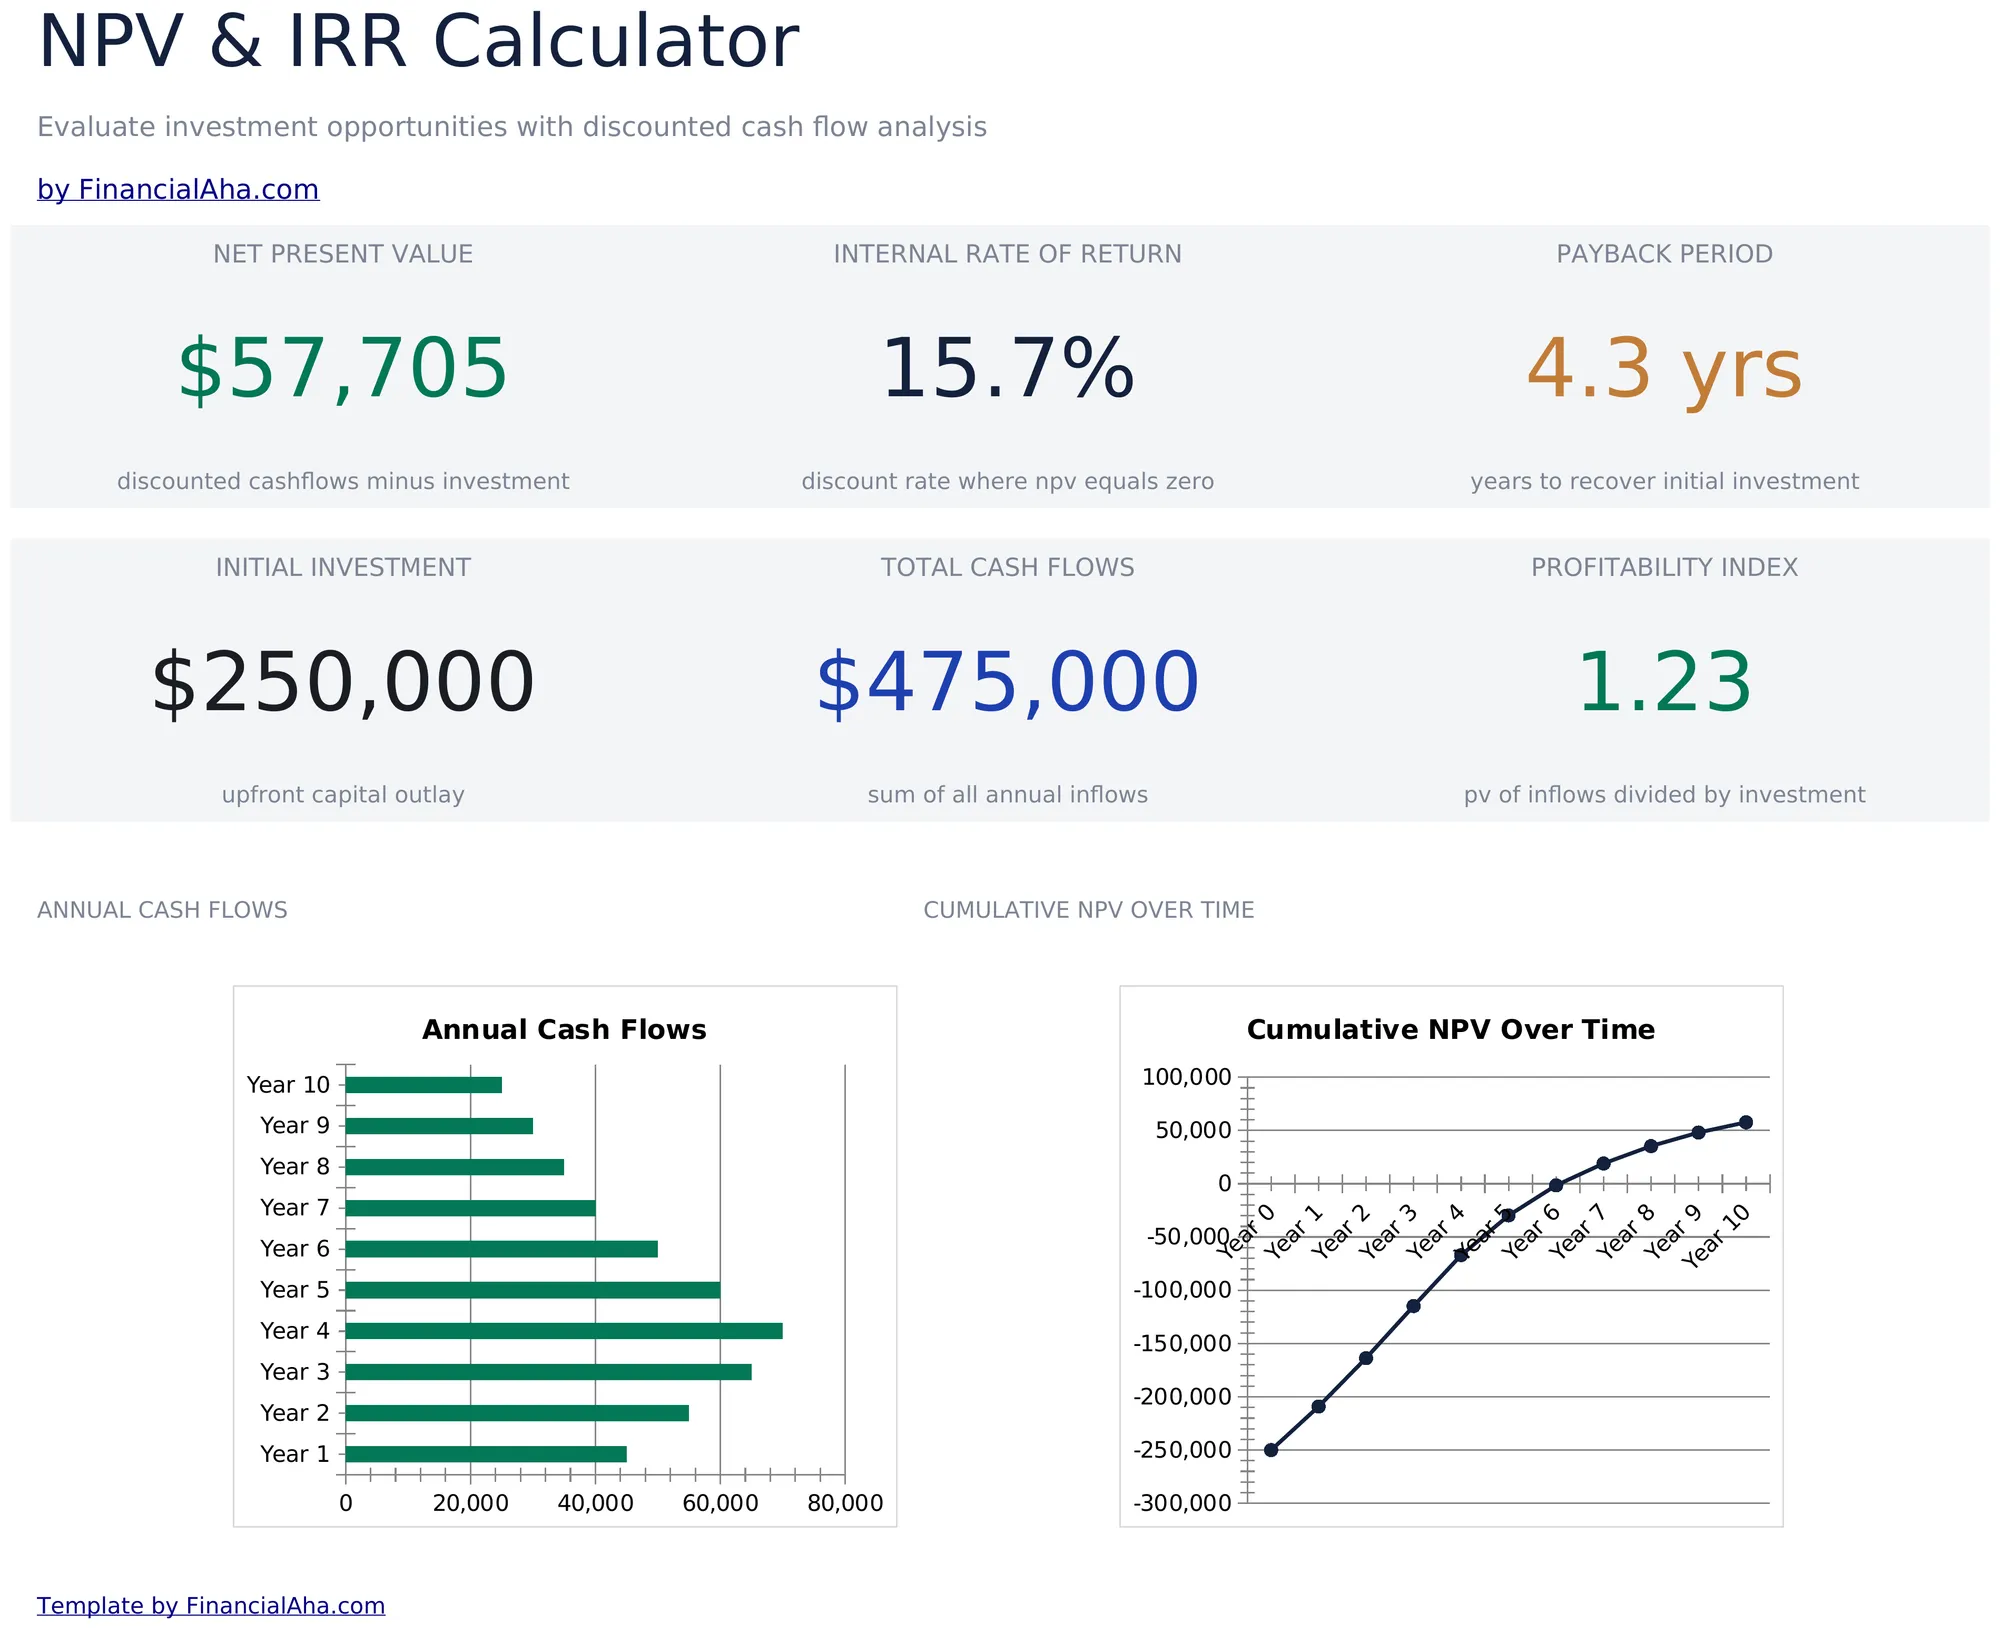
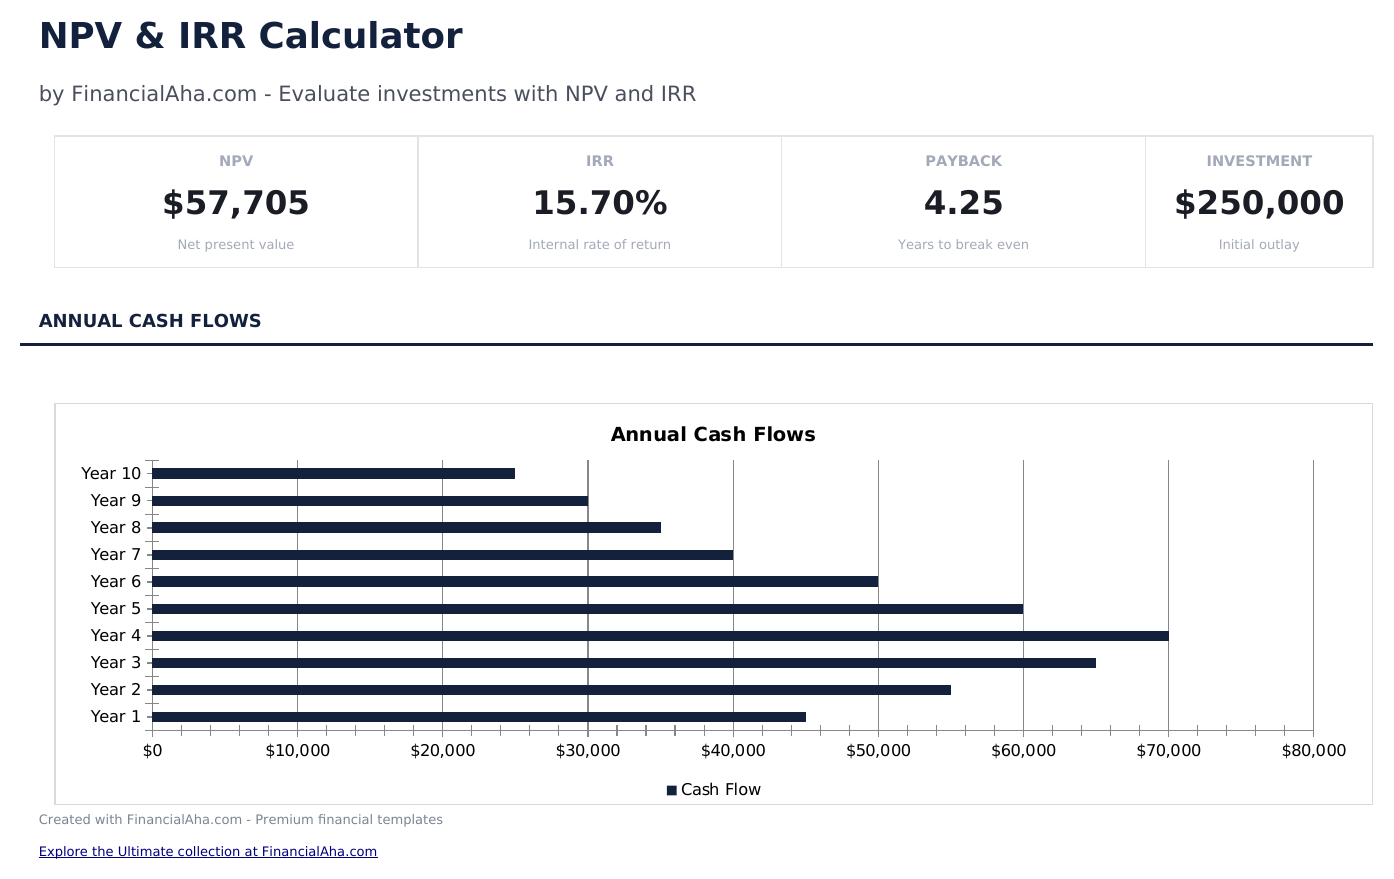
- Tableau de bord avec résultats NPV et IRR affichant la valeur actuelle nette, le taux de rendement interne et le délai de récupération
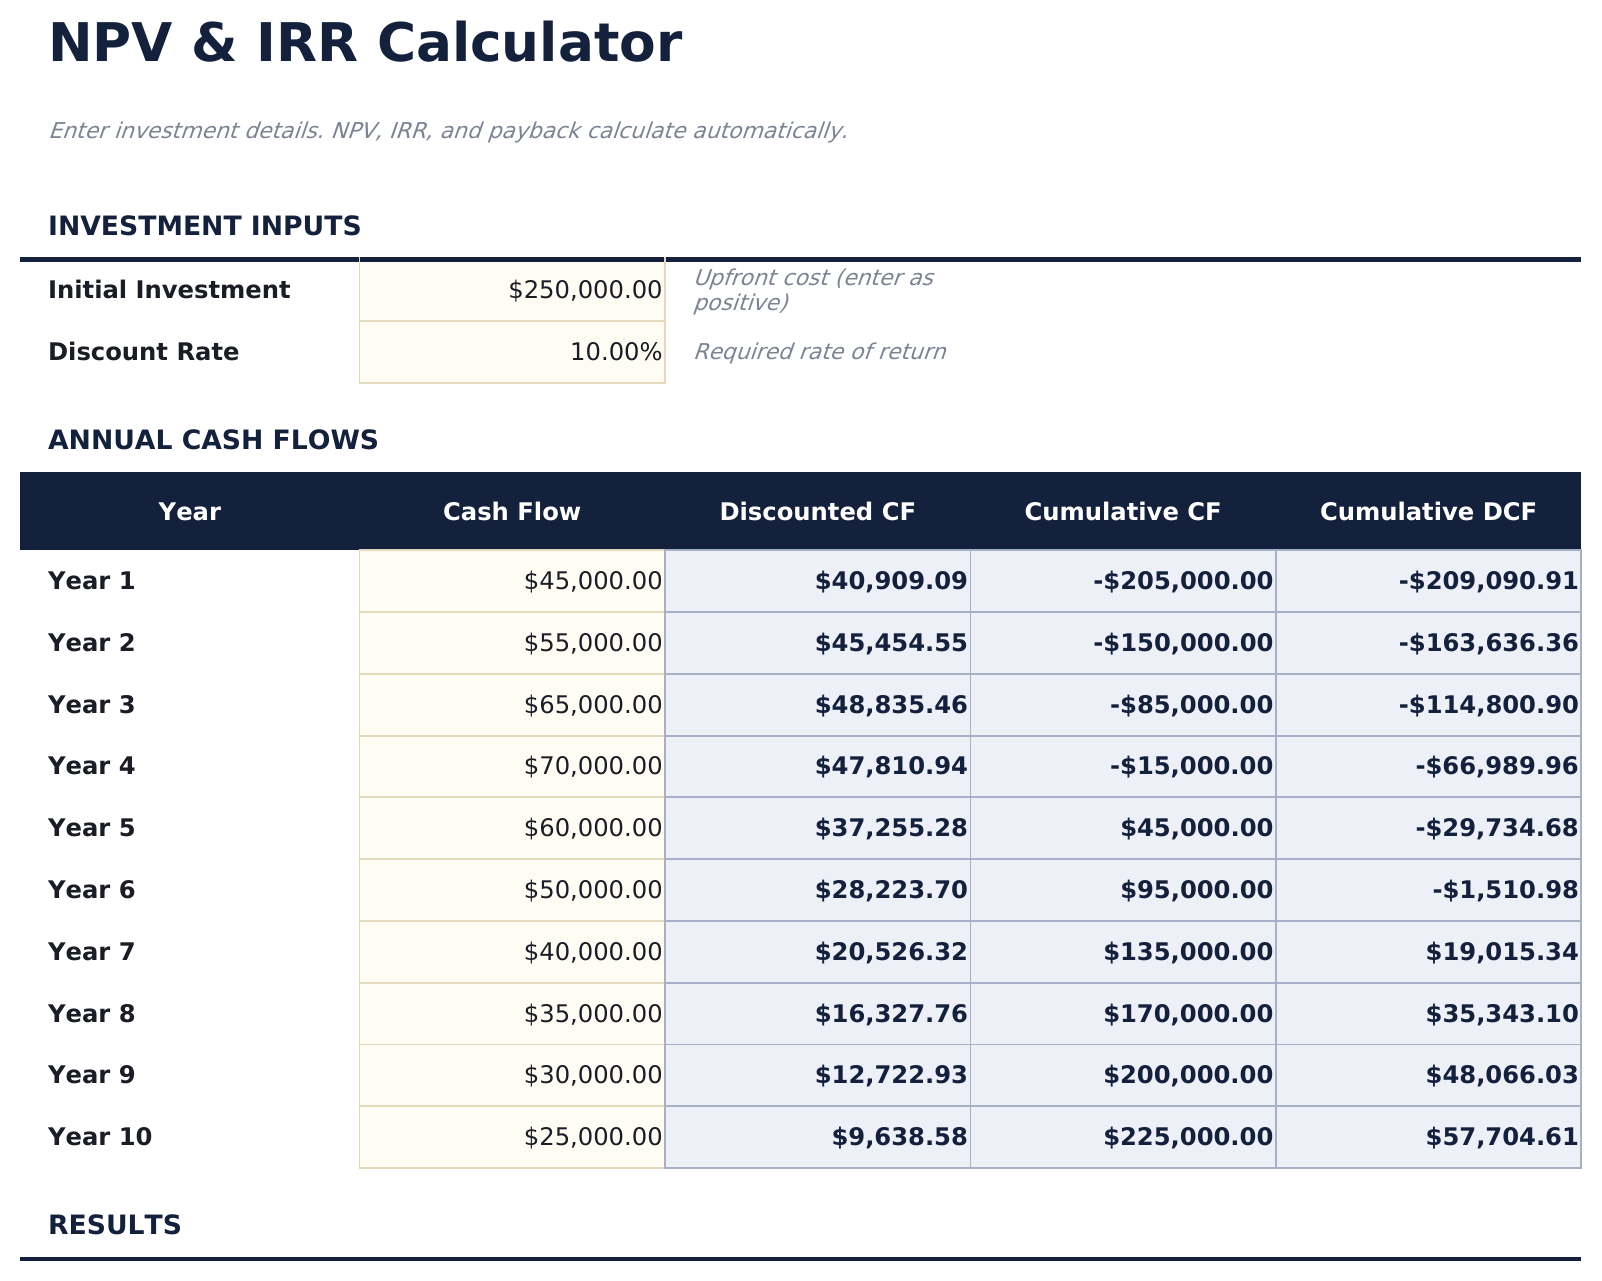
- Saisie des flux de trésorerie par période avec colonnes pour l'année, la description, les entrées de trésorerie, les sorties de trésorerie et le flux de trésorerie net
- Champ de saisie du taux d'actualisation ajustant le calcul NPV pour refléter votre taux de rendement exigé sur l'investissement
- Calcul automatique du NPV utilisant la formule NPV d'Excel appliquée à la série de flux de trésorerie nets au taux d'actualisation spécifié
- Calcul de l'IRR avec cellules de saisie en couleur (jaune) et métriques d'évaluation d'investissement calculées automatiquement (bleu)
- Fonctionne dans Microsoft Excel, Google Sheets et LibreOffice Calc sans configuration requise
Need more from this template?
The Essentials version covers everyday tracking. Ultimate goes further with multi-entity support, scenario analysis, and ultimate-grade reporting.
- Tableau de bord avec résultats NPV et IRR affichant la valeur actuelle nette, le taux de rendement interne et le délai de récupération
- Saisie des flux de trésorerie par période avec colonnes pour l'année, la description, les entrées de trésorerie, les sorties de trésorerie et le flux de trésorerie net
- Champ de saisie du taux d'actualisation ajustant le calcul NPV pour refléter votre taux de rendement exigé sur l'investissement
- Calcul automatique du NPV utilisant la formule NPV d'Excel appliquée à la série de flux de trésorerie nets au taux d'actualisation spécifié
- Comparez jusqu'à 3 projets d'investissement côte à côte avec des projections de flux de trésorerie indépendantes
- Chaque projet dispose d'une feuille dédiée avec un tableau de flux de trésorerie sur 15 ans, des facteurs d'actualisation, des valeurs actuelles et une valeur actuelle cumulée
- Tableau de bord avec indicateurs du portefeuille : meilleure NPV, nombre de projets, total investi et un tableau récapitulatif avec décisions Accepter/Rejeter
- Feuille de comparaison classant tous les projets par NPV, délai de récupération et indice de rentabilité
- Analyse de sensibilité montrant la NPV, l'indice de rentabilité et la décision Accepter/Rejeter à 9 taux d'actualisation différents par projet
Aperçu
Découvrez le contenu de ce modèle
Comment utiliser ce modèle Calculateur NPV et IRR
Saisissez les flux de trésorerie
Listez le flux de trésorerie de chaque période - l'investissement initial (négatif) et les entrées et sorties ultérieures par année.
Définissez le taux d'actualisation
Saisissez votre taux de rendement exigé ou votre coût du capital. Le calcul NPV utilise ce taux pour actualiser les flux de trésorerie futurs.
Examinez le NPV
Le tableau de bord affiche la valeur actuelle nette. Un NPV positif indique que l'investissement rapporte plus que le taux exigé.
Vérifiez l'IRR
Le taux de rendement interne indique le taux de rendement réel impliqué par les flux de trésorerie. Comparez-le à votre taux d'actualisation.
Customer Reviews
What Our Customers Say
"If I get half as good at handling my finances as you are at customer service, this'll be the best $26 I've spent lately."
"Great tool! Simplifies financial planning without the hassle of complex spreadsheets."
"I recently purchased your super convenient spreadsheet, it really helps me!"
"They're great and super intuitive. Thank you!"
Créés par Claude AI. Perfectionnés par nos soins.
Nous utilisons Claude AI pour rédiger chaque modèle, après une recherche approfondie. Puis notre équipe prend le relais. Nous affinons la mise en page, testons chaque formule en conditions réelles, corrigeons les cas limites et peaufinons le design jusqu'à obtenir un résultat que nous utiliserions nous-mêmes. L'IA nous amène à 80 %. Les 20 % restants, c'est du jugement humain.
Questions fréquentes
Que signifie un NPV positif ?
Un NPV positif signifie que les rendements projetés de l'investissement dépassent votre taux de rendement exigé. Plus le NPV est élevé, plus le projet crée de valeur.
Comment l'IRR se compare-t-il au taux d'actualisation ?
Si l'IRR dépasse le taux d'actualisation, l'investissement atteint votre seuil de rendement. Si l'IRR est inférieur au taux d'actualisation, le projet ne répond pas à votre exigence.
Quel taux d'actualisation dois-je utiliser ?
Utilisez votre coût du capital, votre rendement exigé ou votre coût d'opportunité - le taux que vous pourriez obtenir sur un investissement alternatif de risque similaire.
Puis-je saisir des flux de trésorerie mensuels ?
Le modèle est configuré pour des périodes annuelles. Pour des flux de trésorerie mensuels, modifiez les libellés de période et utilisez un taux d'actualisation mensuel (taux annuel divisé par 12).
Comment ouvrir ce fichier dans Google Sheets ?
Importez le fichier .xlsx dans Google Drive, puis ouvrez-le avec Google Sheets. Toutes les formules et la mise en forme seront conservées.
Plus de modèles Essentials Investissement et trading
Points Clés :
Vous recherchez des modèles de tableurs premium ?
Nos modèles payants incluent des tableaux de bord multi-feuilles avancés, des graphiques Excel natifs et des mises à jour régulières.
Privé et sécurisé
Vos données financières restent sur votre appareil. Nous ne les voyons jamais.
En savoir plus →Obtenez plutôt tous les modèles Ultimate
Les 58 modèles Ultimate en un seul achat pour $299 - valeur de $1,102, vous économisez $803.