NPV- und IRR-Rechner Essentials-Vorlage
Berechnen Sie den Nettobarwert und den internen Zinsfuss fuer Investitionsprojekte. Geben Sie Cashflows und einen Abzinsungssatz ein, um potenzielle Investitionen zu bewerten.
Was enthalten ist
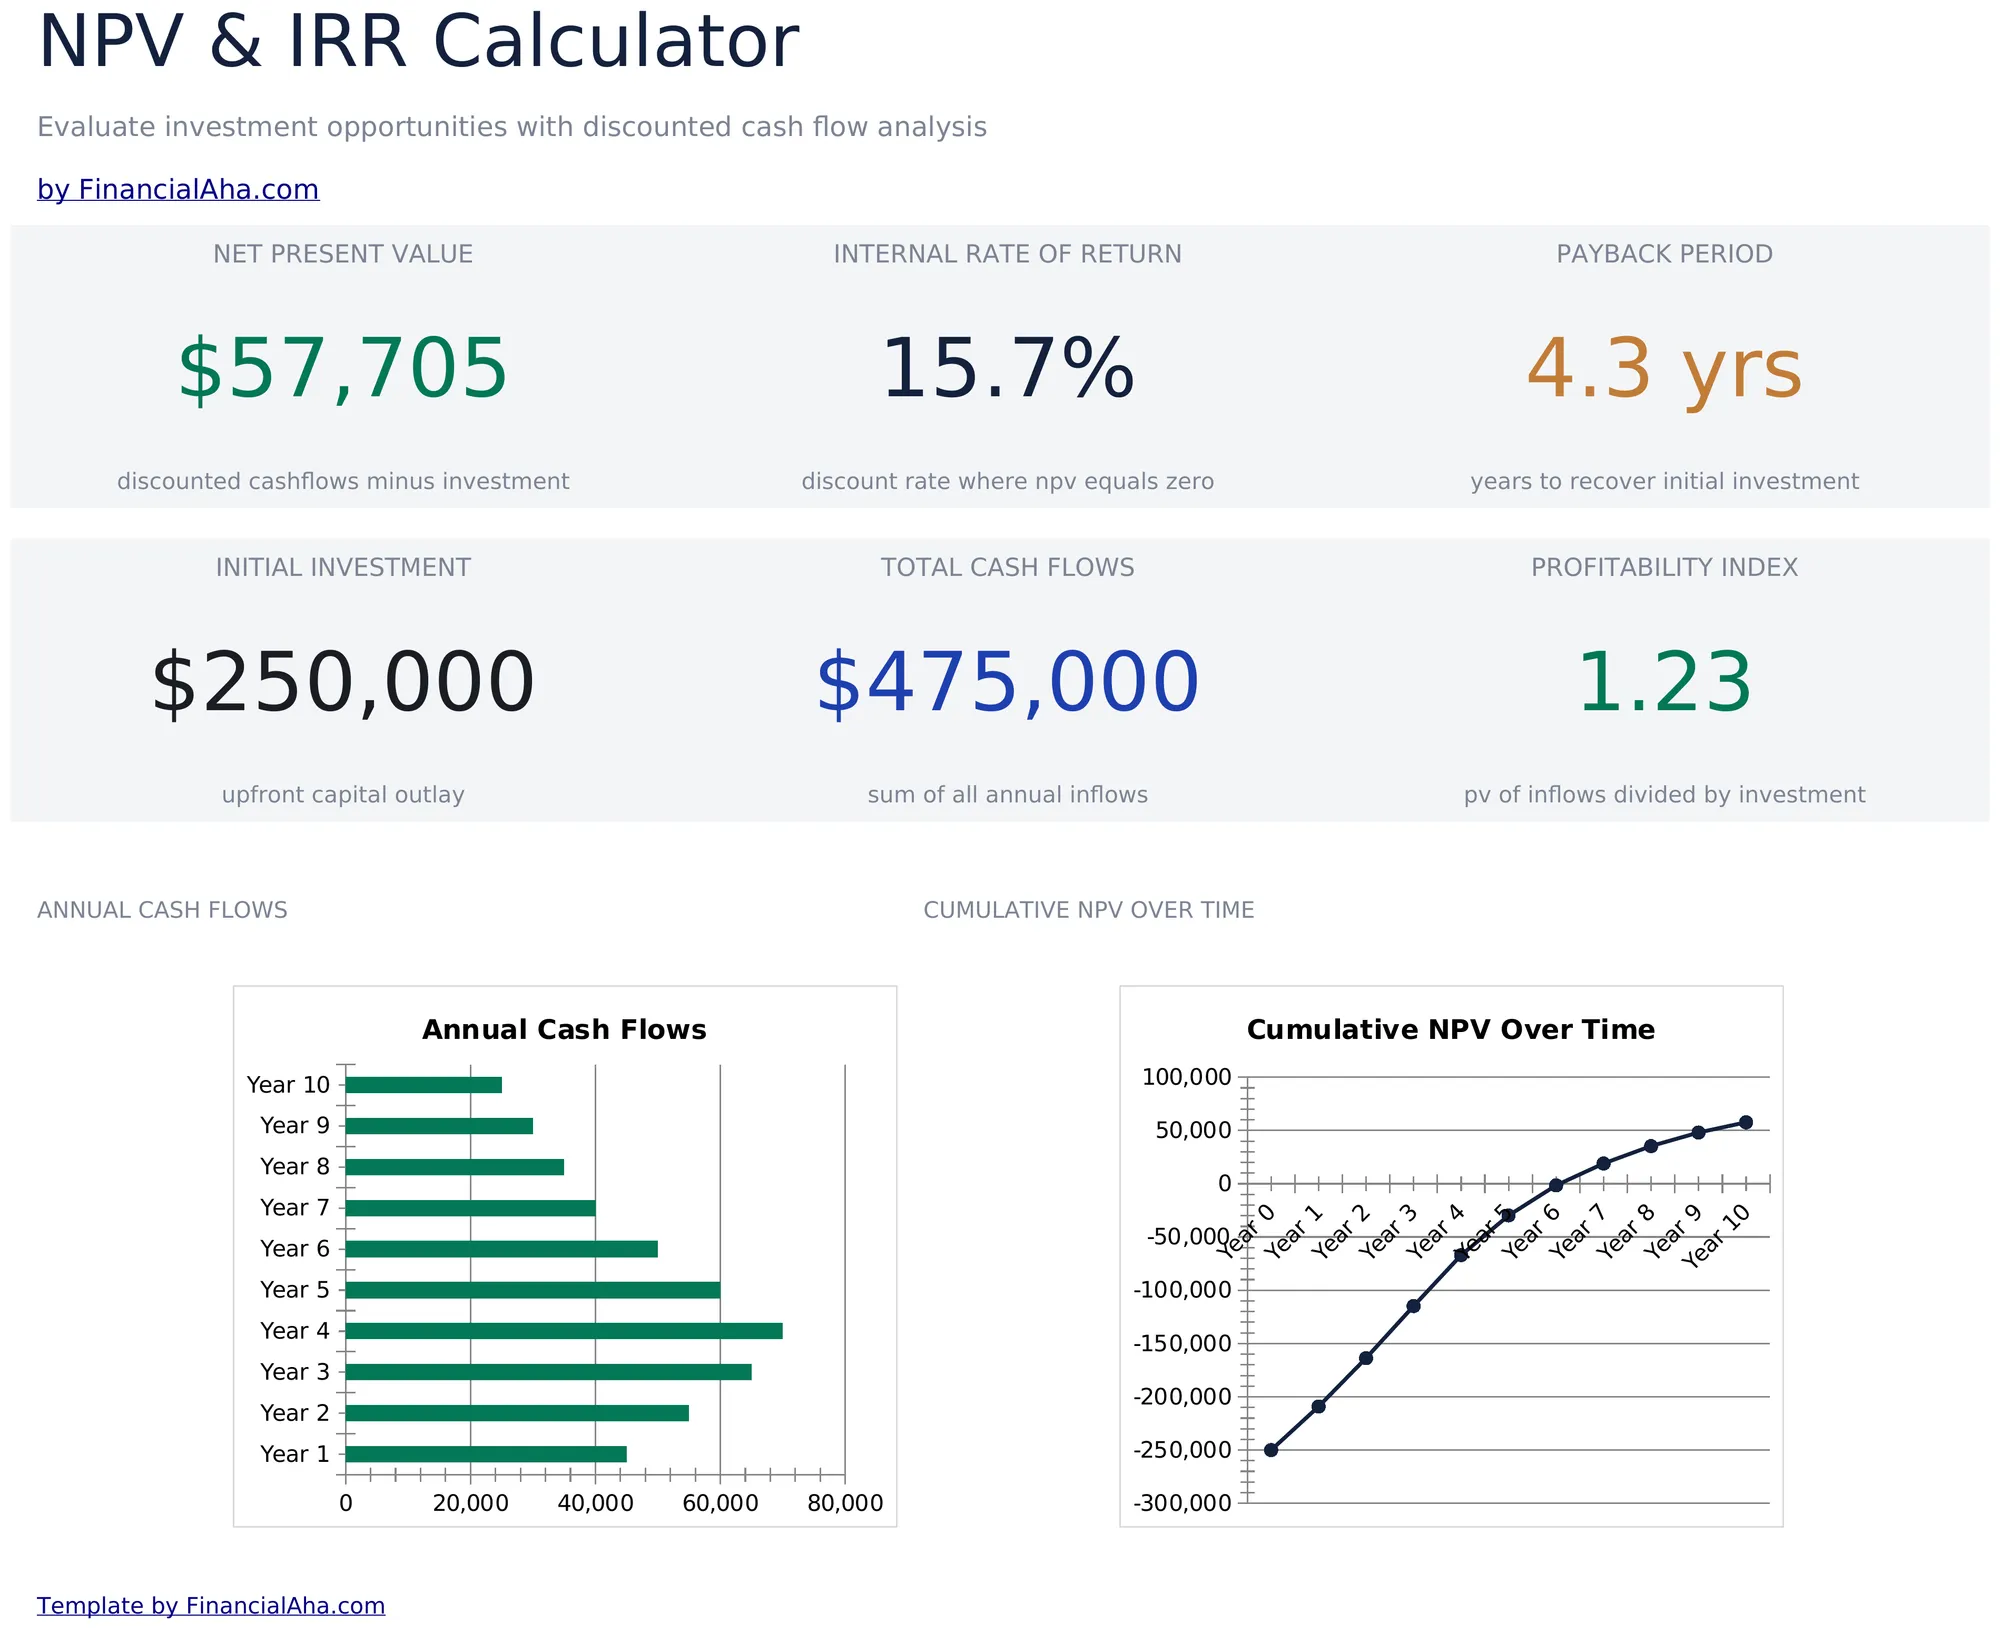
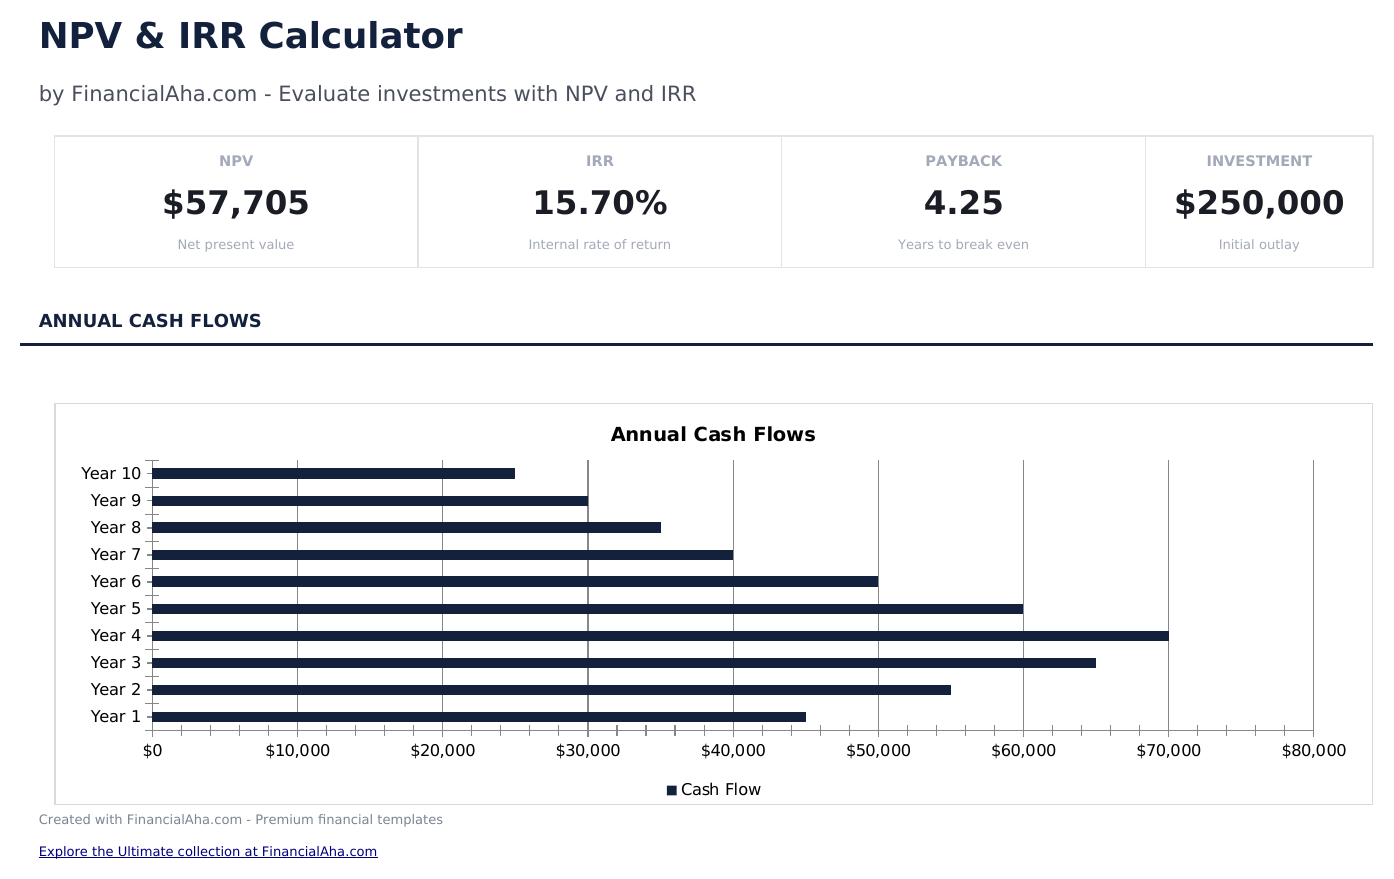
- Dashboard mit NPV- und IRR-Ergebnissen zu Nettobarwert, internem Zinsfuss und Amortisationsdauer
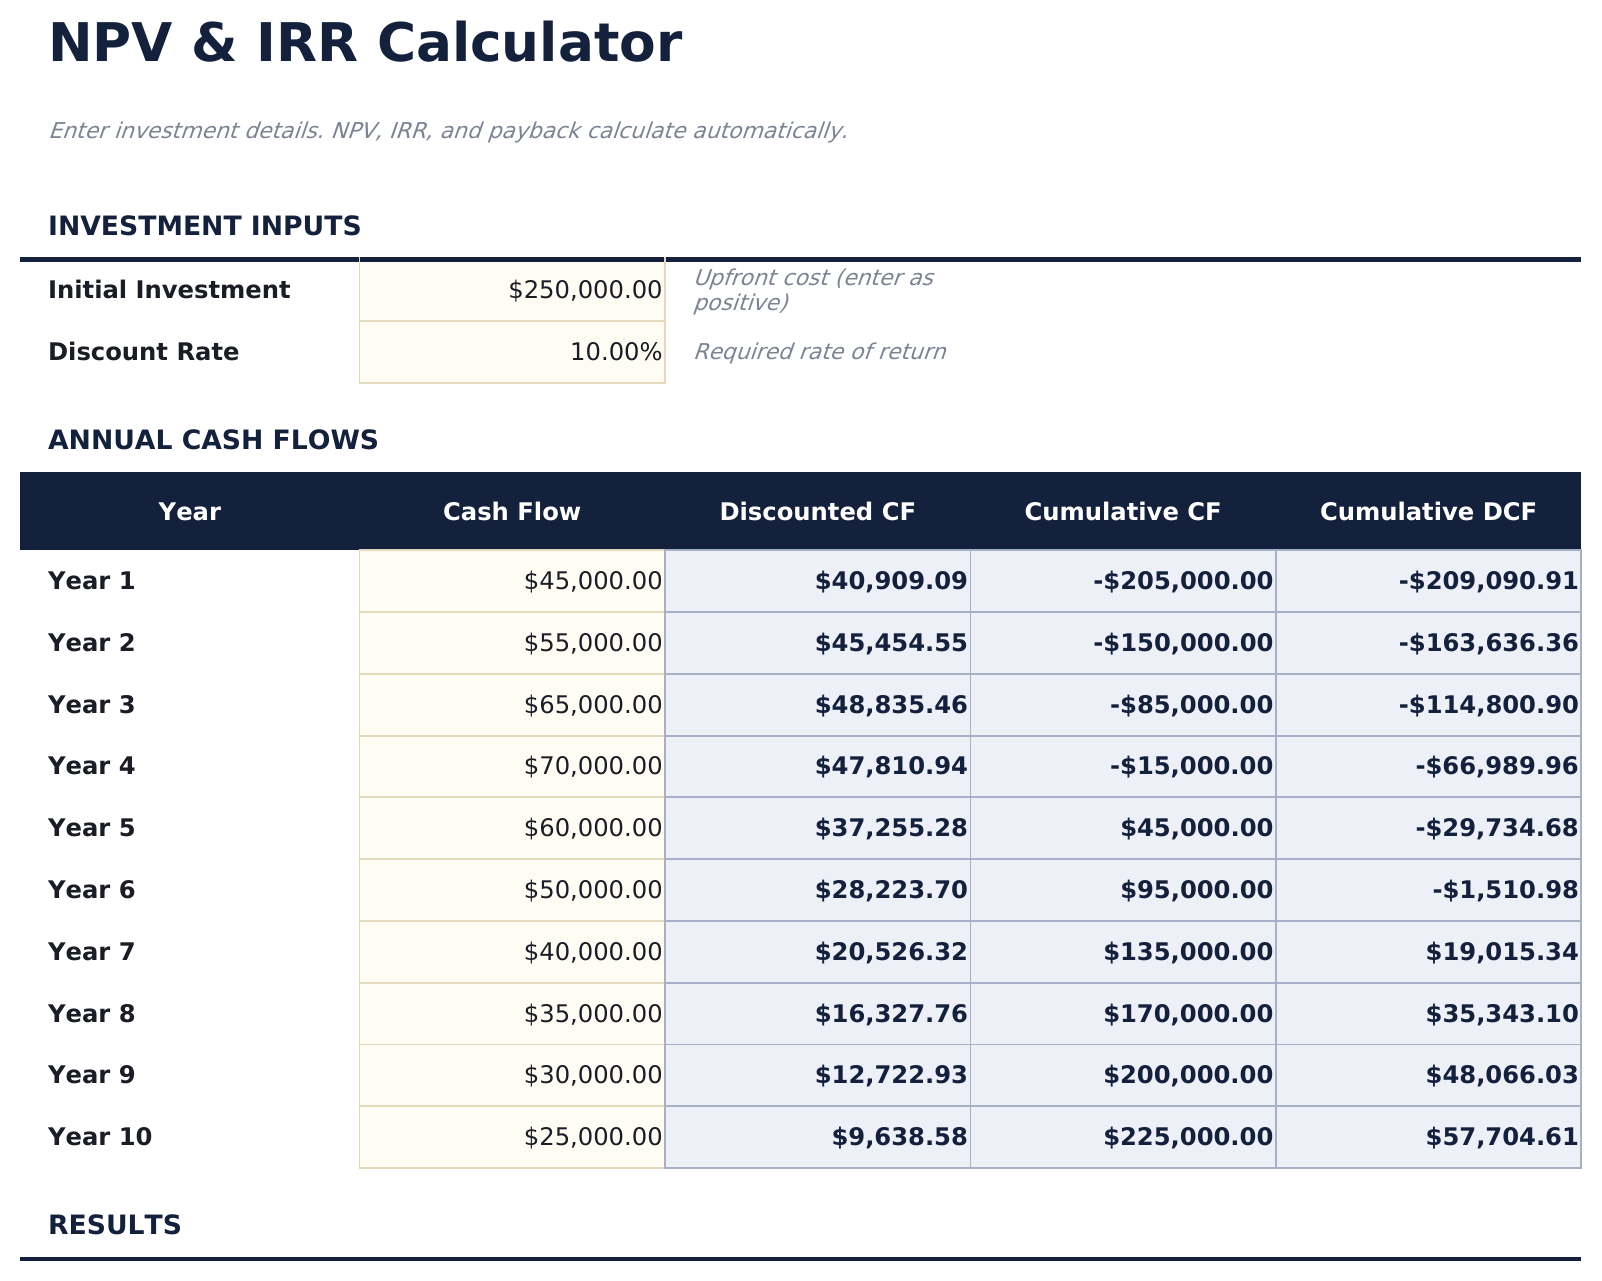
- Cashflow-Eingabe nach Periode mit Spalten fuer Jahr, Beschreibung, Geldzufluss, Geldabfluss und Netto-Cashflow
- Abzinsungssatz-Eingabefeld zur Anpassung der NPV-Berechnung an Ihre geforderte Rendite der Investition
- Automatische NPV-Berechnung mit der Excel NPV-Formel auf die Netto-Cashflow-Reihe zum angegebenen Abzinsungssatz
- IRR-Berechnung mit farbcodierten Eingabefeldern (gelb) und automatisch berechneten Investitionsbewertungskennzahlen (blau)
- Funktioniert in Microsoft Excel, Google Sheets und LibreOffice Calc ohne Einrichtung
Need more from this template?
The Essentials version covers everyday tracking. Ultimate goes further with multi-entity support, scenario analysis, and ultimate-grade reporting.
- Dashboard mit NPV- und IRR-Ergebnissen zu Nettobarwert, internem Zinsfuss und Amortisationsdauer
- Cashflow-Eingabe nach Periode mit Spalten fuer Jahr, Beschreibung, Geldzufluss, Geldabfluss und Netto-Cashflow
- Abzinsungssatz-Eingabefeld zur Anpassung der NPV-Berechnung an Ihre geforderte Rendite der Investition
- Automatische NPV-Berechnung mit der Excel NPV-Formel auf die Netto-Cashflow-Reihe zum angegebenen Abzinsungssatz
- Vergleichen Sie bis zu 3 Investitionsprojekte nebeneinander mit unabhängigen Cashflow-Prognosen
- Jedes Projekt hat ein eigenes Tabellenblatt mit 15-Jahres-Cashflow-Tabelle, Abzinsungsfaktoren, Barwerten und kumuliertem Barwert
- Dashboard mit Portfolio-KPIs: bester NPV, Projektanzahl, Gesamtinvestition und eine Übersichtstabelle mit Annahme-/Ablehnungsentscheidungen
- Vergleichsblatt mit Ranking aller Projekte nach NPV, Amortisationsdauer und Rentabilitätsindex
- Sensitivitätsanalyse mit NPV, Rentabilitätsindex und Annahme/Ablehnung bei 9 verschiedenen Abzinsungssätzen pro Projekt
Vorschau
Sehen Sie, was in dieser Vorlage enthalten ist
So verwenden Sie diese NPV- und IRR-Rechner-Vorlage
Cashflows eingeben
Listen Sie jeden Perioden-Cashflow auf - die anfaengliche Investition (negativ) und nachfolgende Zu- und Abfluesse nach Jahr.
Abzinsungssatz festlegen
Geben Sie Ihre geforderte Rendite oder Kapitalkosten ein. Die NPV-Berechnung verwendet diesen Satz zur Abzinsung zukuenftiger Cashflows.
NPV ueberpruefen
Das Dashboard zeigt den Nettobarwert. Ein positiver NPV zeigt an, dass die Investition mehr als die geforderte Rendite erbringt.
IRR pruefen
Der interne Zinsfuss zeigt die tatsaechliche Rendite, die sich aus den Cashflows ergibt. Vergleichen Sie ihn mit Ihrem Abzinsungssatz.
Customer Reviews
What Our Customers Say
"If I get half as good at handling my finances as you are at customer service, this'll be the best $26 I've spent lately."
"Great tool! Simplifies financial planning without the hassle of complex spreadsheets."
"I recently purchased your super convenient spreadsheet, it really helps me!"
"They're great and super intuitive. Thank you!"
Erstellt von Claude AI. Verfeinert von uns.
Wir verwenden Claude AI, um jede Vorlage nach gründlicher Recherche zu entwerfen. Dann greift unser Team ein. Wir verfeinern das Layout, testen jede Formel auf Herz und Nieren, beheben Grenzfälle und polieren das Design, bis es sich anfühlt wie etwas, das wir selbst verwenden würden. Die KI bringt uns 80 % ans Ziel. Die letzten 20 % sind rein menschliches Urteilsvermögen.
Häufig gestellte Fragen
Was bedeutet ein positiver NPV?
Ein positiver NPV bedeutet, dass die prognostizierten Ertraege der Investition Ihre geforderte Rendite uebersteigen. Je hoeher der NPV, desto mehr Wert schafft das Projekt.
Wie verhaelt sich der IRR zum Abzinsungssatz?
Wenn der IRR den Abzinsungssatz uebersteigt, uebertrifft die Investition Ihre Renditeanforderung. Liegt der IRR unter dem Abzinsungssatz, erfuellt das Projekt Ihre Anforderung nicht.
Welchen Abzinsungssatz sollte ich verwenden?
Verwenden Sie Ihre Kapitalkosten, geforderte Rendite oder Opportunitaetskosten - den Satz, den Sie mit einer alternativen Anlage aehnlichen Risikos erzielen koennten.
Kann ich monatliche Cashflows eingeben?
Die Vorlage ist fuer Jahresperioden eingerichtet. Fuer monatliche Cashflows aendern Sie die Periodenbezeichnungen und verwenden einen monatlichen Abzinsungssatz (Jahreszins geteilt durch 12).
Wie öffne ich diese Vorlage in Google Sheets?
Laden Sie die .xlsx-Datei auf Google Drive hoch und öffnen Sie sie mit Google Sheets. Alle Formeln und Formatierungen bleiben erhalten.
Weitere Essentials-Vorlagen: Investieren & Handel
Highlights:
Auf der Suche nach Premium-Tabellenvorlagen?
Unsere kostenpflichtigen Vorlagen umfassen erweiterte mehrseitige Dashboards, native Excel-Diagramme und laufende Aktualisierungen.
Holen Sie sich stattdessen jede Ultimate-Vorlage
Alle 58 Ultimate-Vorlagen in einem Kauf für $299 - $1,102 Wert, Sie behalten $803.