
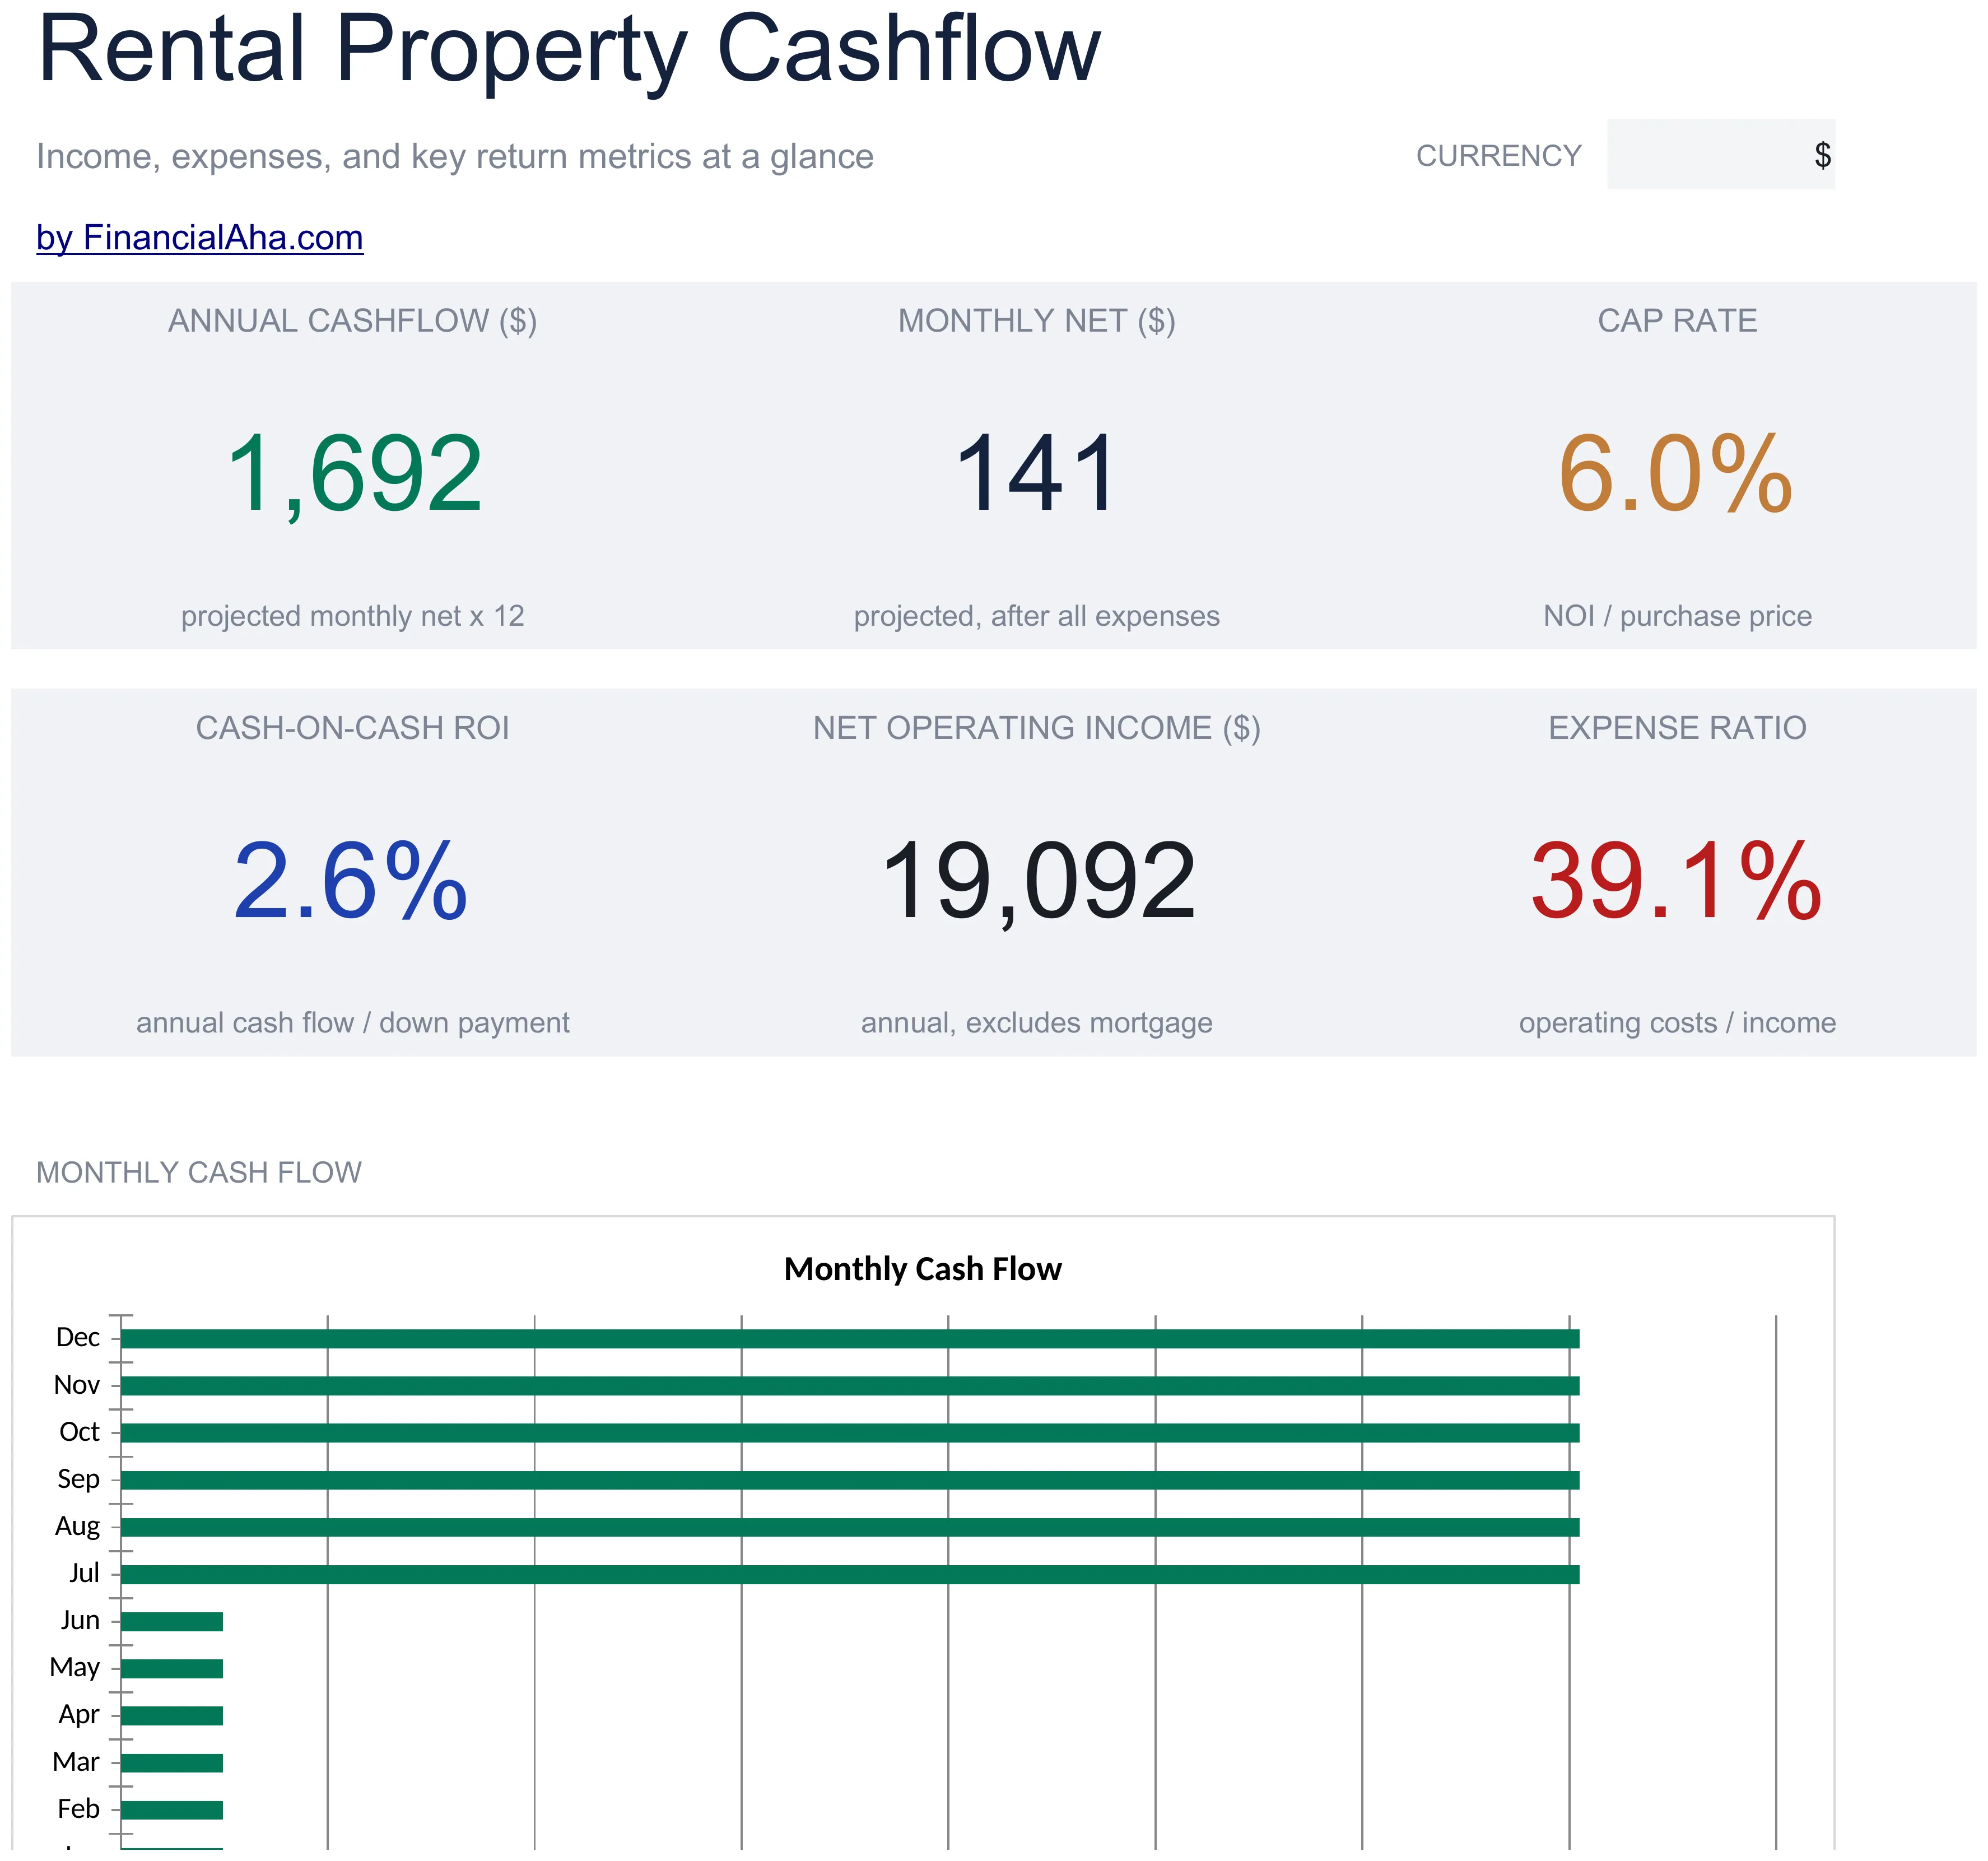
A rental property cash flow spreadsheet tracks rent, expenses, and net per unit, with expense rows that map one-to-one to IRS Schedule E for tax time. A clean build uses one tab per unit plus a portfolio summary that aggregates net cash flow and occupancy across every unit. Our Rental Property Cashflow template ($19) runs the single-property version with cap rate, cash-on-cash, and NOI built in, and the Ultimate ($29) adds multi-property portfolio analysis.
For small landlords (1 to 10 units), a spreadsheet handles cash flow tracking well: it’s cheaper than property management software, fully customizable, and the data structure matches what you need at tax time. This post covers the per-unit and portfolio sheet structure, expense categories aligned with IRS Schedule E, and a worked example for a 4-unit portfolio. If you’d rather start from a ready-made file, the Rental Property Cashflow template ($19) has the single-property version with cap rate, cash-on-cash, and NOI already wired in, and the Ultimate version ($29) rolls the same metrics up across multiple properties.
Per-unit sheet structure
One tab per rental unit. Each tab tracks 12 months across 15 rows.
Header rows (rows 1 to 3):
- Row 1: Unit address
- Row 2: Type (single-family, duplex, multi-family unit, condo)
- Row 3: Tenant name and lease end date
Income rows (4 to 5):
- Row 4: Monthly rent
- Row 5: Other income (parking, pets, late fees, laundry)
Expense rows (6 to 17):
- Row 6: Mortgage principal and interest
- Row 7: Property tax (allocated monthly even if paid annually)
- Row 8: Insurance
- Row 9: HOA
- Row 10: Utilities (landlord-paid)
- Row 11: Property management fees
- Row 12: Repairs and maintenance
- Row 13: Cleaning and turnover
- Row 14: Lawn and snow
- Row 15: Pest control
- Row 16: Vacancy reserve (typical 5 to 10 percent of monthly rent)
- Row 17: Capital reserve (typical 5 to 10 percent of monthly rent)
Net cash flow row (18): Income minus expenses.
Columns 2 through 13: January through December. Column 14: Annual total.
That’s the structure. 15 rows by 13 columns per unit, plus header. Filled out monthly.
Expense categories aligned with Schedule E
If you file Schedule E for rental income (which you do, in the US), the categories above map directly to the form’s lines:
| Spreadsheet row | Schedule E line |
|---|---|
| Mortgage interest | Line 12 (Mortgage interest paid to banks) |
| Property tax | Line 16 (Taxes) |
| Insurance | Line 9 (Insurance) |
| HOA | Line 19 (Other) |
| Utilities | Line 17 (Utilities) |
| Property management | Line 11 (Management fees) |
| Repairs | Line 14 (Repairs) |
| Cleaning | Line 7 (Cleaning and maintenance) |
| Lawn and snow | Line 14 (Repairs) or Line 19 (Other) |
| Pest control | Line 14 (Repairs) |
Mortgage principal isn’t deductible (it’s a balance sheet item). Vacancy and capital reserves aren’t tax-deductible either; they’re cash management for your own planning, not IRS lines.
Year-end, you copy the totals from each unit tab to your Schedule E. The mapping is one-to-one if your category names match.
Portfolio summary tab
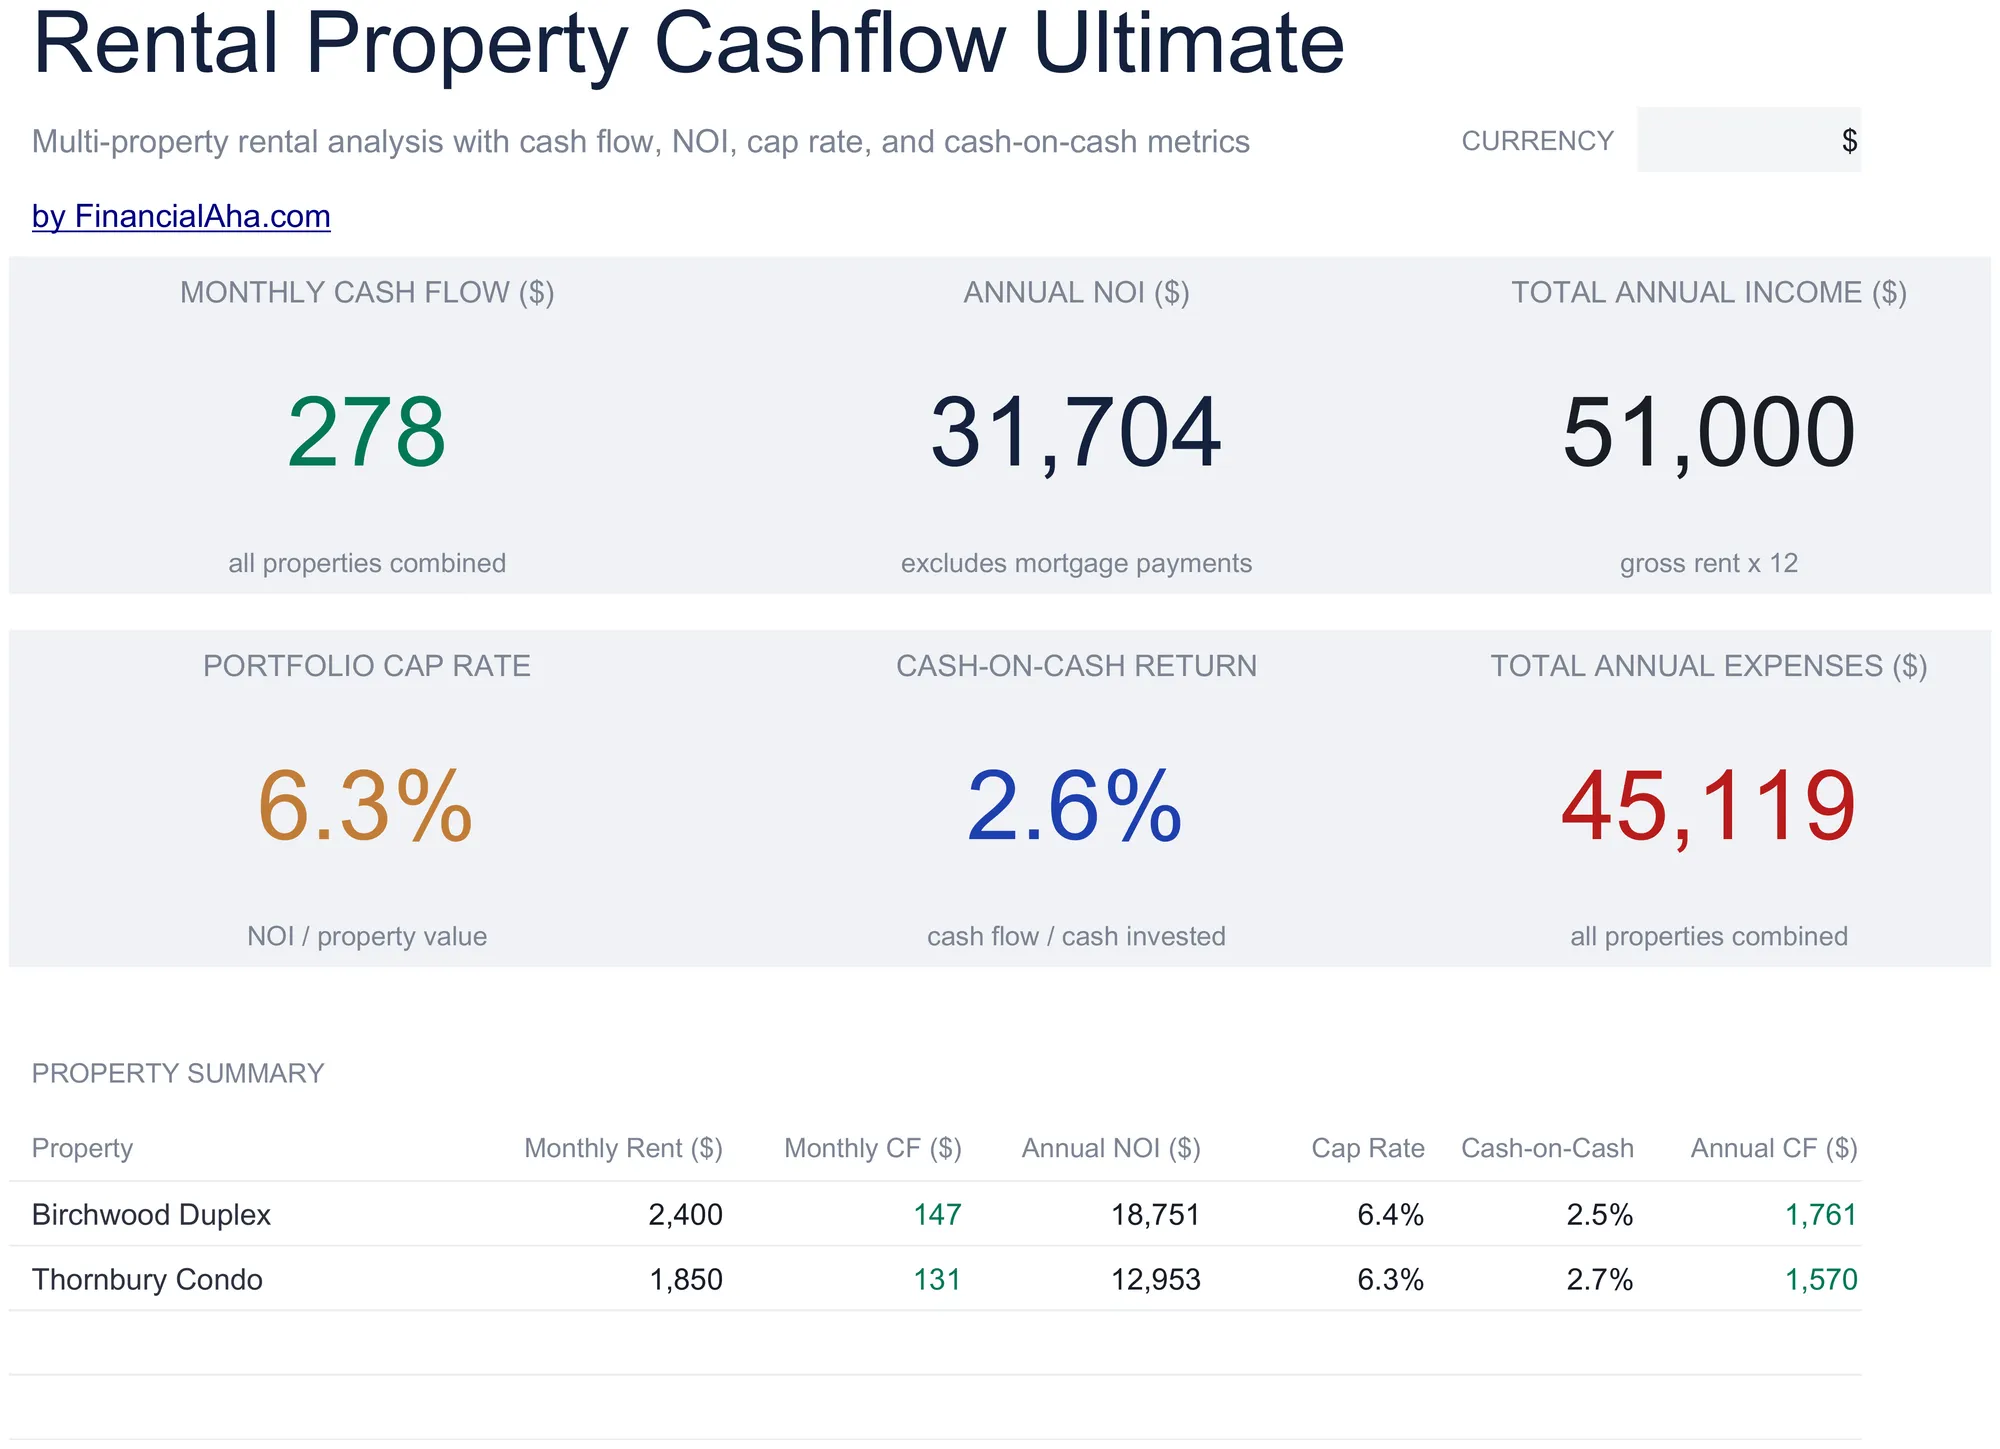
Aggregates across all units. The Ultimate template builds this view for you, with a per-property summary line and portfolio-level cap rate and cash-on-cash return:
A hand-built version follows the same idea, one row per unit:
| Metric | Unit 1 | Unit 2 | Unit 3 | Unit 4 | Total |
|---|---|---|---|---|---|
| Annual rent | 24,000 | 18,000 | 21,600 | 19,200 | 82,800 |
| Other income | 600 | 480 | 0 | 720 | 1,800 |
| Total income | 24,600 | 18,480 | 21,600 | 19,920 | 84,600 |
| Mortgage P+I | 11,400 | 8,800 | 9,800 | 10,200 | 40,200 |
| Property tax | 3,200 | 2,400 | 2,800 | 2,600 | 11,000 |
| Insurance | 1,200 | 950 | 1,100 | 1,050 | 4,300 |
| Utilities | 0 | 1,800 | 0 | 0 | 1,800 |
| Management | 1,968 | 1,478 | 1,728 | 1,594 | 6,768 |
| Repairs | 800 | 1,200 | 600 | 1,400 | 4,000 |
| Other | 600 | 720 | 480 | 540 | 2,340 |
| Vacancy reserve | 1,200 | 900 | 1,080 | 960 | 4,140 |
| Capital reserve | 1,200 | 900 | 1,080 | 960 | 4,140 |
| Total expenses | 21,568 | 19,148 | 18,668 | 19,304 | 78,688 |
| Net cash flow | 3,032 | (668) | 2,932 | 616 | 5,912 |
The summary makes Unit 2 visible as a problem. Negative cash flow on a single unit can be tolerable in context (long-term appreciation, tax benefits, paying down a mortgage that builds equity), but knowing it requires the breakdown.
A worked example: 4-unit portfolio
Marcus owns a duplex (Units 1 and 2) and two single-family rentals (Units 3 and 4). 2026 totals (per the table above):
- Total income: $84,600
- Total expenses (cash): $70,408
- Net cash flow: $5,912 (after vacancy and capital reserves)
- Mortgage principal paid (equity buildup): $9,800
Total economic return: $5,912 (cash) + $9,800 (principal) = $15,712 in 2026. Plus appreciation (not in cash flow).
Marcus also gets depreciation deductions, which reduce his taxable rental income (often to zero or negative for new investors), even though depreciation is a non-cash item. His tax-paper return looks much better than his cash return; both are real.
Where the spreadsheet helps
Visibility into per-unit performance. Aggregated portfolio numbers hide single-unit problems. The per-unit tabs surface them.
Tax preparation. The category alignment with Schedule E means year-end filing is mostly copy-paste from the spreadsheet’s totals. Pairing it with a dedicated tax deduction tracker keeps receipts and mileage in the same place as the rental numbers.
Sale or refinance decisions. When you’re weighing selling Unit 2 or refinancing Unit 3, the historical cash flow data is the input, and the spreadsheet keeps it organized. For underwriting a new purchase before you make an offer, the Rental Property Analysis template adds NOI, DSCR, and year-one projections on top of the same cash flow logic.
Cash flow forecasting. Comparing year-over-year cash flow per unit shows which trends matter (rent growth keeping pace with expense growth, repair patterns indicating end-of-life on systems).
Where the spreadsheet falls short
Tenant communication and lease management. Property management apps (Avail, Rentec Direct, Buildium) handle this much better. Spreadsheets aren’t the right tool for collecting rent payments or sending lease renewal notices.
Maintenance request tracking. Same; apps with photo upload and ticket workflows beat spreadsheets here.
Tax document generation. The spreadsheet helps you assemble Schedule E but doesn’t file it. Use accounting software or tax prep software for the actual return.
For a small landlord (1 to 5 units) doing self-management, the spreadsheet for cash flow plus a free tool like Avail for tenant management is a low-cost stack. For 10+ units, a dedicated property management platform is usually worth the cost.
Fields worth adding after the first year
Three small additions tend to earn their place once a spreadsheet has run for a full cycle.
A “lease renewal” date column on the unit tab header. A 60-day reminder before lease end leaves time to negotiate a renewal or list the unit. It’s easy to forget without a visible cue.
A “year built” and “system ages” notes section. When the HVAC, water heater, roof, and major appliances were last replaced. A visible system-age list makes a coming furnace or roof replacement easier to anticipate instead of a surprise.
A “neighborhood comp rent” cell. Updated annually from local listings. It shows whether a unit sits under market, where a renewal increase has room, or at the top of the range, where retention matters more than rent.
Five extra cells, a real change in landlord situational awareness.
Where to keep the data
Excel or Google Sheets both work. A few practical considerations:
- Multi-device access: Sheets via cloud sync; Excel via OneDrive.
- Sharing with a partner or accountant: Sheets has finer-grained permissions; Excel works via OneDrive shared links.
- Backup: Both auto-save to cloud if you use the cloud versions. Local Excel files require your own backup discipline.
- Mobile entry: Both have apps. Sheets tends to render better on phones, while Excel is easier to work with on tablets.
The Rental Property Cash Flow Excel template ships in Excel format and works in Google Sheets after upload. Most landlords use Sheets for the multi-device access; some prefer Excel for offline reliability.
Rental templates and next steps
Which file fits depends on how many properties you run and whether you’re tracking one you own or sizing up one to buy:
- Rental Property Cashflow ($19) covers a single property, with cap rate, cash-on-cash, NOI, and expense ratio on one dashboard.
- Rental Property Cashflow Ultimate ($29) adds multi-property analysis for up to five properties: a per-property summary line, portfolio cap rate and cash-on-cash return, an ROI calculator, and a sensitivity analysis.
- Rental Property Analysis ($59) is the Premium underwriting template for sizing up a purchase, with NOI, DSCR, cap rate, and year-one projections before you make an offer.
Related
- 25 Self-Employed Tax Deductions for 2026
- Tax Deduction Tracker in Google Sheets
- Quarterly Estimated Tax Spreadsheet
- Cash Flow Forecast Template for Business
- Our Business Spreadsheet Library, Built Out - where the rental model sits among the other business workbooks
Frequently asked questions
Should I include depreciation in the spreadsheet?
Optionally. Depreciation is a tax concept (27.5-year straight-line on residential, deducting cost basis from your taxable rental income). It's not a cash item, so most cash-flow trackers leave it out. A separate "tax view" tab can include it for tax planning.
How do I handle a property I own jointly?
Track the property at full numbers and add a "your share" cell that takes 50 percent (or whatever your ownership). Tax filing is more complex (each owner reports their share on their own Schedule E); the spreadsheet just tracks the underlying property.
What about short-term rentals (Airbnb, VRBO)?
Different model. Income is variable per night; cleaning and turnover costs are higher; tax treatment is sometimes Schedule C (if substantial services) instead of Schedule E. A separate template (often the [Airbnb Rental Tracker](@route:essentialsSpreadsheetTemplates.template:business-finance:airbnb-rental-tracker)) fits short-term rentals better.
Should I track each tenant's payment history?
Yes, in a separate sheet or tab. The cash flow tab tracks rent received; the tenant tab tracks who paid, when, and any late payments. Useful for renewal decisions and small claims if it ever comes to that.
What if my property has multiple units in one building (a fourplex)?
One tab per unit. Allocate shared expenses (insurance on the building, exterior maintenance) by either unit count or square footage. Be consistent across years for cleaner trend data.
Does the template calculate cap rate and cash-on-cash return, or just cash flow?
The Rental Property Cashflow dashboard computes cap rate (NOI divided by purchase price), cash-on-cash return (annual cash flow divided by the down payment), net operating income, and an expense ratio alongside monthly and annual cash flow. The Essentials version covers one property; the Ultimate version carries monthly cash flow, annual NOI, portfolio cap rate and cash-on-cash return across up to five properties.
Sources
- About Schedule E (Form 1040), Supplemental Income and Loss - Internal Revenue Service
- About Publication 527, Residential Rental Property - Internal Revenue Service
About this article
Expense-category mapping checked line by line against IRS Schedule E (Form 1040). Template sheets, inputs and metrics checked on 2026-09-10 against the shipped Rental Property Cashflow Essentials workbook (Dashboard, Property Setup, How to Use), the Rental Property Cashflow Ultimate workbook (Dashboard, Property Setup, Income & Expenses, Monthly Cash Flow, ROI Calculator, Sensitivity Analysis) and the Rental Property Analysis Premium workbook (Dashboard, Purchase, Operating, Annual Projection, Returns). Last reviewed September 2026.