
The real rent vs. buy comparison is total cost over time, not one monthly payment against another. Once you add property taxes, insurance, maintenance, and the investment growth a down payment gives up, the answer turns on the price-to-rent ratio in your market, the mortgage rate, how long you stay, and what the home does in value. The calculator charts the net cost of each side year by year, so any crossover shows up on your own numbers instead of a national average.
“My mortgage would be $1,800 and rent is $2,000, so buying is obviously cheaper.”
This comes up constantly, and it sounds reasonable on the surface. But it’s comparing one line item on each side and ignoring a dozen others. The actual rent vs. buy comparison involves costs that don’t appear on any monthly statement, plus an opportunity cost that most people never think about.
The Rent vs. Buy Calculator takes the home price, down payment, interest rate, appreciation, time period, rent, annual rent increase, and investment return, then compares the net cost of each side. No signup needed.
The Costs Nobody Mentions at the Open House
Here’s what the buying side looks like for a $350,000 home with 20% down at 6.5%, using the ownership-cost rates the calculator builds in:
| Monthly Cost | Amount | |-------------|--------| | Mortgage P&I (30-year loan) | $1,770 | | Property taxes (1.2% of value/year) | $350 | | Homeowner’s insurance (0.35% of value/year) | $102 | | Maintenance (1% of value/year) | $292 | | Total monthly cost | $2,514 |
And here’s the part that stings: of that first $1,770 payment, about $1,517 goes to interest and only $253 builds equity. Across the whole first year the split runs roughly $18,100 in interest against $3,100 in principal. The interest vanishes just like rent does.
Compare that to renting at $2,000/month plus $15 for renter’s insurance. The renter is paying $499 less every month. And the $70,000 that would have been a down payment? Sitting in an investment account, growing.
The Number That Changes Everything
That $70,000 down payment is the elephant in the room. Invested at a 7% average annual return, it grows to roughly $98,000 after five years and $138,000 after ten. That growth belongs entirely to the renting side of the ledger, and most “rent vs. buy” conversations skip it entirely.
When mortgage rates are high and home prices are elevated, as they are in many markets, this opportunity cost can keep the math tilted toward renting for years.
So When Does Buying Actually Win?
Less often on time alone than the rule of thumb suggests. Run the example above through the calculator at 3% annual home appreciation, 3% rent increases, and a 7% investment return, and buying carries the lower net cost from the first year: roughly $16,800 against $19,100 for renting after year one, and $111,800 against $132,100 after seven. A $350,000 home against $2,000 rent is a low price-to-rent ratio, so equity and appreciation cover the monthly gap quickly.
Change one input and the answer flips. Raise the price to $400,000 against that same $2,000 rent and renting stays cheaper across the whole run, about $118,700 against $127,800 at year seven. Set appreciation to 0% and renting leads by roughly $51,000 at year seven. Drop rent increases to 0% and the two sides finish year seven within about $2,500 of each other.
Two things about the model behind the chart are worth knowing. It runs a 30-year mortgage and charges property tax, insurance, and maintenance at 1.2%, 0.35%, and 1% of home value per year, none of which are editable fields. It also charges no closing costs on the purchase and deducts no selling costs from equity on the way out, which is the usual reason a short stay favors renting, so those transaction costs come off the buying side by hand.
Where time does its work is on the rent line. Rent keeps climbing while the mortgage payment stays fixed, and more of each payment goes to principal as the loan ages. Flat rent takes that away, which is what the 0% run shows. The crossover depends on your local market, so plugging in your own numbers says more than any national average:
What Changes If You Put Down Less Than 20%
The worked example assumes a 20% down payment. Put down less on a conventional loan and the lender typically requires private mortgage insurance, an added monthly premium that protects the lender rather than you. It commonly runs from a few tenths of a percent to over 1% of the loan amount per year, stacked on top of the mortgage payment.
PMI is not permanent. Under federal rules a servicer must cancel it once the balance is scheduled to reach 78% of the home’s original value, and you can request cancellation earlier, at 80%. The trade-off is real either way: a smaller down payment keeps more cash invested on the renting-versus-buying ledger, but the extra premium raises the monthly cost of buying until that equity threshold arrives, which pushes the breakeven point further out. If 20% down is not on the table, work out how long the target takes to save. The calculator has no PMI field, so the premium is one more figure to add to the buying side rather than leave out.
The Variables With Outsized Impact
Not all inputs carry equal weight. A few swing the outcome dramatically:
Interest rates are the biggest lever. In the example above, dropping the rate to 4% cuts the seven-year net cost of buying from about $112,000 to $63,000. Pushing it to 7% lifts that figure to about $122,000, close enough to the renting side to make the two a coin flip.
How long you’ll stay might matter even more than rates. Transaction costs on buying and selling, meaning closing costs, agent commissions, and transfer taxes, typically eat 8-10% of the home’s value. Stay less than three years and you’re almost certainly losing money on the buy. Five to seven years is where things start to get interesting.
Rent growth is worth thinking about honestly. If rents climb 5% a year instead of 3%, buying looks better sooner. In rent-controlled areas, the calculus flips. Stable rent is a powerful counterweight to the ownership premium.
Home appreciation is the wildcard everyone wants to predict and nobody can. National price growth has run in the low single digits historically, but individual markets range from flat to 10%+ in any given stretch. Building a case for buying that depends on above-average appreciation is adding risk, not reducing it.
What the Calculator Can’t Tell You
The math is only one dimension. Owning a home means freedom to renovate, stability for a family, and a kind of forced savings through equity building. It also means you’re on the hook when the furnace dies at midnight in January.
Renting means flexibility. It means calling someone else when the plumbing breaks. It means lower financial exposure if the local market takes a dip. It also means your landlord can raise the rent or sell the building.
Neither option is universally better. The financial comparison just shows which one costs less under a set of assumptions - it doesn’t say which one fits your life.
Making the Comparison Honest
For results worth trusting:
Use real local numbers. National medians are interesting for headlines and useless for decisions. What does a comparable home actually cost in your neighborhood? What would you actually pay in rent?
Include everything. The calculator folds property tax, insurance, and maintenance into the buying side at fixed percentages of home value, and it counts rent alone on the renting side. HOA dues, renter’s insurance, and transaction costs have no field of their own, so they get added to the totals separately. Skipping line items is how people convince themselves of whatever they already want to believe.
Test your assumptions. What if you move in five years instead of ten? What if you buy at 7% instead of 6.5%? Each run holds one rate for the whole period, so a refinance means comparing two runs rather than one.
Be honest about the down payment. Investment Return is the field carrying that assumption. If you wouldn’t actually invest the $70,000, and it would instead sit in a savings account earning 4%, the opportunity cost shrinks and the buying side gains ground.
The Financial Planning Template holds a home as a Real Estate row on the Assets tab and the mortgage as a Loans row on the Debt tab, then carries both to a chosen end year on the Projection tab. The Annual Budget Template keeps Housing and Utilities as plan-versus-actual lines across all 12 months.
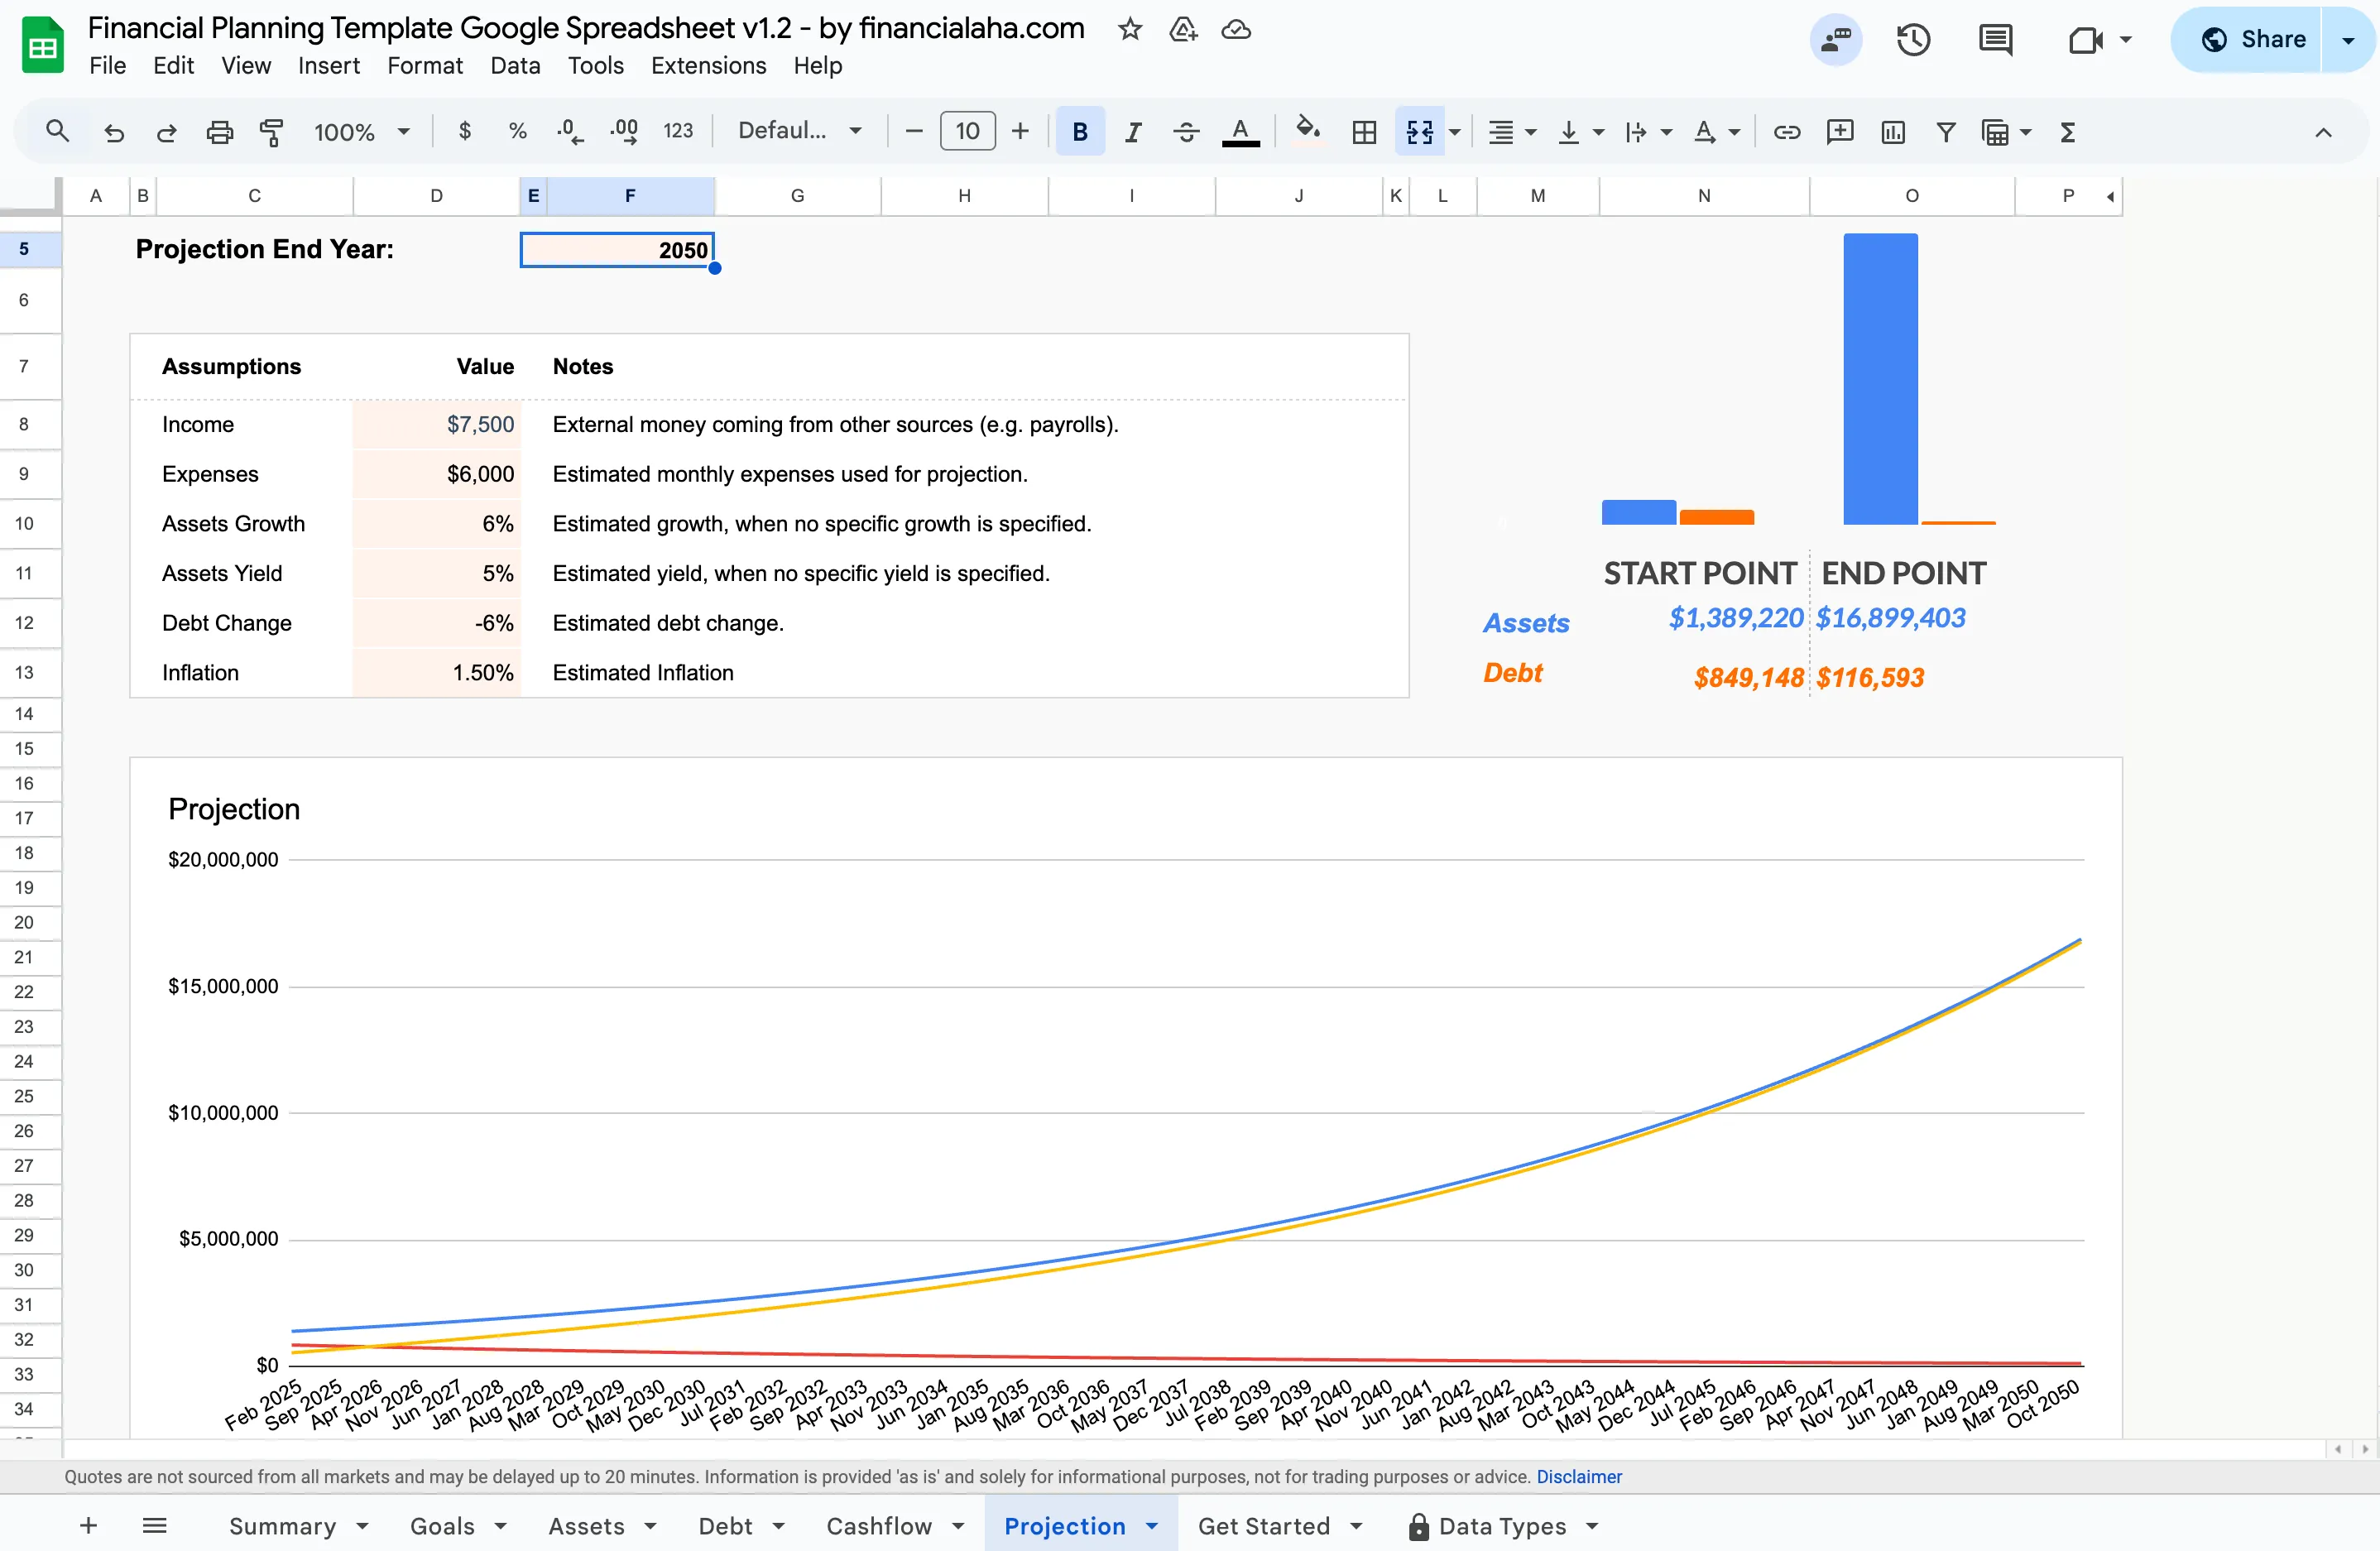
The Financial Planning Template (Premium) projects assets and debt to a chosen end year from six editable assumptions: income, expenses, assets growth, assets yield, debt change, and inflation. A down payment and a mortgage sit inside that single projection, not in a separate rent-versus-buy comparison.
More on Housing & Mortgages
- Home Affordability Calculator: How Much House Can You Afford? - Calculate a comfortable purchase price based on income, debts, and down payment
- How Much House Can I Afford Spreadsheet - The 28/36 rule, lender DTI, and true cost of ownership from one set of inputs
- Rent vs. Sell Calculator: What to Do With Your Property - For a home you already own but no longer live in, the rent-out-versus-sell math
- Loan Payment Calculator: Understanding Amortization - How each mortgage payment splits between interest and principal over time
- Mortgage Payoff Calculator: Extra Payments Impact - How extra payments shorten your loan term and save on interest
- Investment Returns Calculator: What to Expect - What a down payment might earn if it stayed invested instead
Related
Frequently asked questions
How long do I need to stay for buying to make sense?
Typically 5-7 years, though this varies significantly by market, interest rates, and closing costs. The calculator plots the net cost of renting and of buying for each year of your time period, so any crossover inside that window shows up on the chart.
Does renting mean throwing money away?
No. Rent pays for housing - a real need. Mortgage interest, property taxes, insurance, and maintenance are also 'thrown away' in the sense that they don't build equity. The real comparison is total cost over time.
What about home appreciation?
Home prices have historically appreciated in the low single digits nationally per the FHFA House Price Index, but this varies enormously by location and time period. Assuming high appreciation to justify buying adds risk.
Should I factor in the tax deduction for mortgage interest?
Only if you'd itemize deductions. With the higher standard deduction, many homeowners no longer benefit from the mortgage interest deduction, so it changes nothing for them.
What if I put down less than 20%?
On a conventional loan, a down payment under 20% usually triggers private mortgage insurance, an extra monthly premium that raises the cost of buying until you reach about 20% equity. A smaller down payment keeps more cash invested but pushes the breakeven point later.
Does the comparison include closing costs and selling costs?
Our calculator does not. It has no closing-cost field, and its assumptions note says selling costs are not deducted from the buyer's equity. Buying and selling a home carries transaction costs that commonly run 8-10% of the price combined, so those come off the buying side separately. They are also the main reason a short stay tends to favor renting, since you pay them whether the market moves or not.
Sources
- FHFA House Price Index - Federal Housing Finance Agency
- What is private mortgage insurance? - Consumer Financial Protection Bureau
- Publication 936, Home Mortgage Interest Deduction - Internal Revenue Service
About this article
The worked example uses a $350,000 home at 6.5% with 20% down; the mortgage payment, interest-vs-principal split, ownership costs, and down payment growth were recalculated on 2026-09-10 against the Rent vs. Buy Calculator's own model. Calculator inputs, outputs, chart, and built-in assumptions checked on 2026-09-10 against the shipped Rent vs. Buy Calculator component. Template claims checked on 2026-09-10 against the shipped Financial Planning Google Sheet (Summary, Goals, Assets, Debt, Cashflow, Projection tabs) and Annual Budgeting Planner Google Sheet (Summary, Annual Plan, Categories tabs). Home appreciation ranges are checked against the FHFA House Price Index; private mortgage insurance rules against the Consumer Financial Protection Bureau. Last reviewed September 2026.