
US stocks are commonly quoted at roughly 10% nominal (near 7% after inflation) over the past century, but no single decade delivers that average in a straight line. The calculator on this page measures a return that has already happened, turning a starting amount, a current value, a holding period, and dividends received into total return, ROI, and a compound annual growth rate. For the years ahead, a range of assumptions from conservative to optimistic says more than a single rate.
An investment return calculator gives you a number. One clean, specific number. Looking backwards, that number is exact: this is what the money did. Looking forwards, it is almost certainly wrong, not because the math is bad, but because the future does not arrive as a smooth line. It arrives as chaos that averages out over time.
Either way the number is useful. Measuring what a holding actually returned says how an investment has done so far. Running projections shows how different choices, such as contribution amounts, time horizons, and fee levels, change an outcome. The point is not prediction. It is perspective.
The Investment Returns Calculator covers the backward-looking half. Enter what you put in, what the position is worth now, how many years you held it, and any dividends received, and it reports total return, ROI, the compound annual growth rate, and the annualized return, with a chart splitting the result into the original investment, capital gains, and dividends. No signup required.
What “Average Return” Actually Means
The US stock market is commonly quoted at about 10% nominal return (roughly 7% after inflation) over the past century. This is the number that appears in most retirement planning articles and financial textbooks, and the exact figure shifts with the index used, the date range, and whether dividends are counted.
What gets lost is how messy the journey is. The 2000-2009 decade left US stocks roughly where they started. The 2010-2019 decade ran at low double-digit annual returns. Both decades are included in the long-term average. An investor who started in 2000 and checked after 10 years saw a decade of going nowhere. An investor who started in 2010 saw extraordinary growth.
The long-term average is real. The path to it is anything but smooth. Even regulators build this caveat into the rules: fund companies are required to remind investors that past performance does not necessarily predict future results. Planning with a single return assumption is useful for rough guidance. Planning with multiple scenarios is useful for actual decisions.
The Inputs That Move the Needle
Three variables shape a long-run result more than everything else combined. Only one of them, the holding period, is a field in the calculator above, which measures a return already earned rather than projecting one.
Time. An investor putting $1,000 per month into a portfolio returning 7% (inflation-adjusted) accumulates roughly $173,000 after 10 years, $521,000 after 20 years, and $1,220,000 after 30 years. The jump from 20 to 30 years is not linear: it is nearly $700,000, more than the entire first 20 years produced. That is compound returns at work. Time is the biggest lever, and it is the one you cannot buy back.
Contribution rate. Early in the timeline, contributions dominate returns. Someone with $10,000 saved and adding $1,000 per month gets about $700 to $1,000 per year from returns but adds $12,000 in contributions. Contributions are doing 90% of the work. Over time, the ratio flips. After 20 years with $400,000 invested, annual returns at 7% produce $28,000 while contributions are still $12,000. The portfolio is now growing faster from returns than from new money.
This is why increasing contributions early has an outsized impact. An extra $200 per month starting now compounds for the full horizon. The same $200 starting 15 years from now does not.
Fees. A 1% annual fee does not sound like much. On a $500,000 portfolio earning 7% gross over 20 years, the difference between a 0.1% fee and a 1.0% fee is roughly $295,000. That is not a typo. The fee itself is the smaller cost: the larger one is all the compound growth the fee money would have generated if it had stayed invested. The SEC’s own worked example makes the same point, showing how seemingly small fees compound into a large drag over decades.
Running Honest Scenarios
Looking forward is where a single “right” number does the most damage. Testing a range of return assumptions shows how much a plan depends on the one variable nobody controls.
Conservative: 5% real return. Accounts for the possibility that the next few decades underperform historical averages. Interest rates, demographics, valuations - there are reasons to believe future returns may be more modest. If your plan works at 5%, it is robust.
Moderate: 7% real return. Roughly in line with long-term US stock market history after inflation. A reasonable central estimate for a stock-heavy portfolio.
Optimistic: 9% real return. Possible. The 2010s delivered this. But building a plan that only works at 9% is building on a foundation that might not hold.
If the conservative scenario still gets you to your goal (even if later than the optimistic scenario), you are in good shape. If only the optimistic scenario works, the plan needs adjusting - either a higher contribution rate, a longer timeline, or a smaller target.
Running the three rates takes a forward-looking tool rather than the one above. The Compound Interest Calculator takes a starting amount, an annual rate, a compounding frequency, a term, and an inflation figure, so the same horizon can be run at 5%, 7%, and 9% and the three results compared.
The Calculator Cannot Model You
Projections assume you stay the course. They model steady contributions, consistent returns, and no panic selling. Reality includes all three.
The average investor underperforms the average investment. Studies show this consistently - people buy after markets rise (enthusiasm) and sell after markets fall (fear), systematically buying high and selling low. Over a lifetime, this behavior gap can reduce returns by 1-2% annually compared to a simple buy-and-hold approach.
A projection also cannot model the unexpected. Career disruptions that pause contributions. Windfalls that accelerate them. Medical expenses that force early withdrawals. Life does not follow a spreadsheet, and the value of running projections is directional guidance - not a promise.
Sequence of returns risk adds another wrinkle. A 10% loss followed by a 10% gain does not get you back to even - you end up about 1% behind. The order in which good and bad years arrive matters, particularly in the years just before and after retirement when the portfolio is largest and withdrawals have started.
The Number Is a Starting Point
An investment returns calculator is not a crystal ball. It is a thinking tool. The number it produces is less important than the questions it raises. Can I afford to contribute less than I thought? What happens if fees are higher than I realized? How much does starting five years earlier actually matter?
The most useful output from a returns calculator is not the final dollar amount. It is the realization that the inputs you control, contribution rate, time horizon, and fee level, each meaningfully change the outcome. The market return itself is not controllable. Almost everything else is.
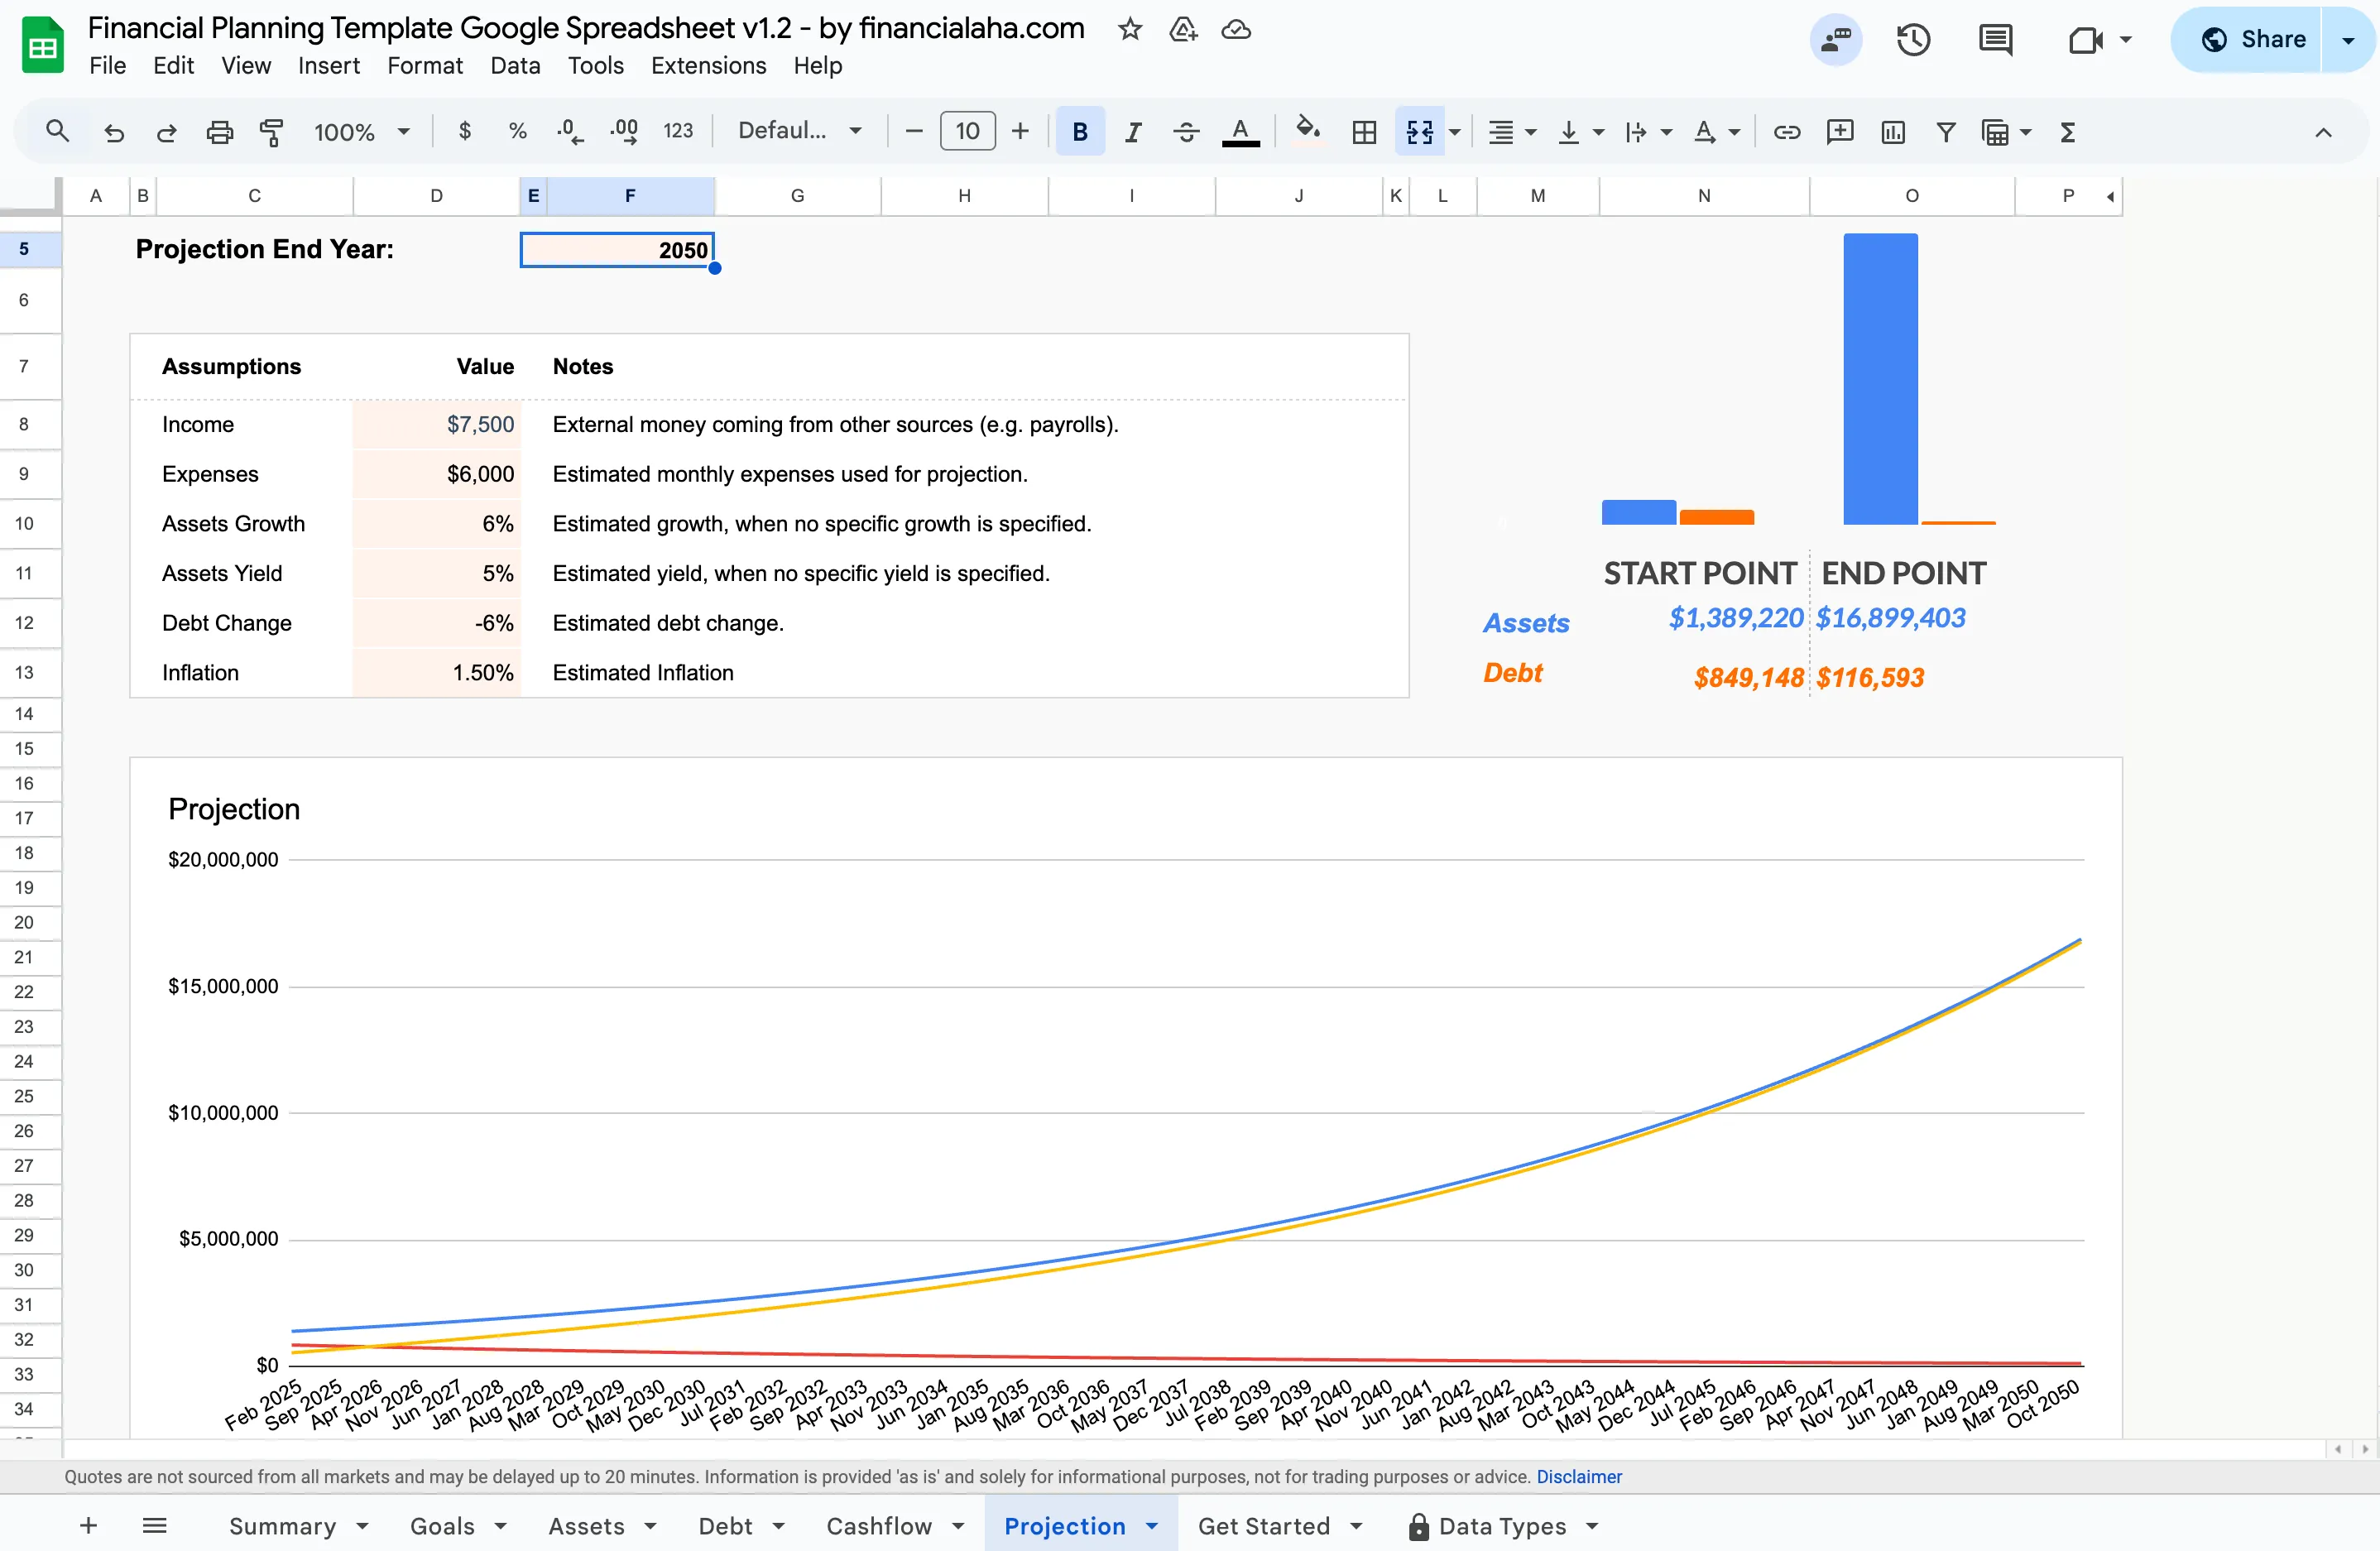
The Financial Planning Template ($29, Google Sheets) sits on the other side of that line. Its Assets tab lists each position with its value, its annual yield, and its annual growth rate, and the Projection tab carries those balances forward to an end year you choose using assumptions you set yourself: monthly income and expenses, an assets growth rate, an assets yield, a debt change rate, and an inflation figure. Changing those cells redraws the projection, so a conservative case and an optimistic one run against the balances you actually hold.
More on Investment Growth
- Compound Interest: The Math Behind Growth - The compounding formula and why time is the most powerful variable
- Compound Interest Calculator in Google Sheets (Step-by-Step) - Building the projection cell by cell with the FV function
- How to Calculate ROI on a Rental Property (Spreadsheet) - Setting realistic return expectations for real estate as an asset class
- Savings Calculator: How Your Money Grows - How regular contributions and a steady return build a balance over time
- Retirement Calculator: Planning for the Future - Projecting a portfolio across decades of returns and withdrawals
Related
Frequently asked questions
What's a realistic rate of return to expect?
Long-run US stock market returns are commonly quoted at about 10% nominal, or near 7% after inflation, with balanced stock and bond portfolios lower than that. The figure moves with the start and end dates chosen and with whether dividends are counted, and past performance does not predict future results, so a single number is context rather than a forecast.
Should I use nominal or inflation-adjusted returns?
Inflation-adjusted (real) returns give a more honest picture of future purchasing power. If you're planning for a goal 20 years out, real returns show what that money will actually buy.
Do past returns predict future returns?
Historical returns provide context but don't guarantee future performance. Using a range of scenarios (optimistic, moderate, conservative) gives a more complete picture than a single number.
How much do fees affect returns?
Significantly. A 1% annual fee on a $500,000 portfolio costs $5,000 per year directly, plus the compound growth that money would have generated. Over 30 years, 1% in fees can reduce the final portfolio by 20-25%.
Does this calculator account for taxes?
The calculator on this page works only from the figures you type in and does not model tax, so its total return, ROI, and CAGR are before-tax numbers. The tax drag depends on the account: a Roth IRA is generally tax-free at withdrawal, a traditional 401(k) or IRA is taxed as income when you withdraw, and a taxable brokerage account owes tax on dividends and realized gains along the way. Reading the result as a before-tax figure keeps expectations honest.
Does this calculator handle contributions or an employer match?
No. It takes four figures: the initial investment, the current or final value, the number of years held, and total dividends received. Money paid in along the way is not separated out, so if you kept contributing during the period, the CAGR it reports counts those contributions as growth and overstates the return. Working out the return on each contribution separately, or using a tool built around a regular monthly contribution, keeps the two apart.
Sources
- How Fees and Expenses Affect Your Investment Portfolio - U.S. Securities and Exchange Commission (Investor.gov)
- Past Performance - U.S. Securities and Exchange Commission (Investor.gov)
About this article
Fee-impact and past-performance statements checked against the SEC's Investor.gov education pages. Growth projections recomputed at 7% real with $1,000 monthly contributions. Calculator inputs, outputs, and chart checked on 2026-09-10 against the shipped Investment Returns Calculator: initial investment, current or final value, years held, and dividends received, returning total return, ROI, CAGR, and annualized return. Financial Planning Template claims checked on 2026-09-10 against the shipped Google Sheet (Summary, Goals, Assets, Debt, Cashflow, Projection tabs). Last reviewed September 2026.