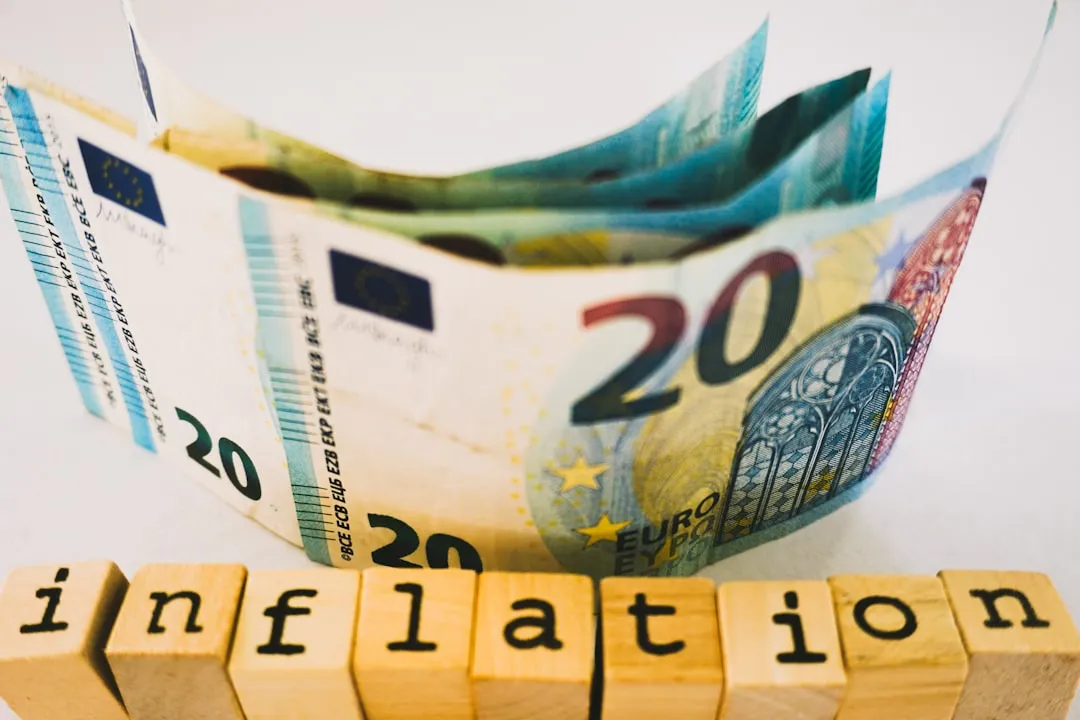
Inflation quietly erodes purchasing power over time. At 3% a year, $100 today buys about $74 in ten years and $55 in twenty. The math is one compound formula, future value = present value x (1 + rate) raised to the number of years, and running it in both directions shows what today's money will buy later and what past dollars are worth now.
In 1990, the median sales price of a US home was about $122,000. By 2024, the same series had reached roughly $419,000. A near three-and-a-half-fold increase sounds dramatic, and it partly is, but inflation alone accounts for a significant chunk. That $122,000 in 1990 dollars is equivalent to about $293,000 in 2024 dollars. The rest of the increase is real appreciation, not just the dollar losing value.
Separating real changes from inflation noise is one of the most useful financial skills. And it starts with a simple formula.
The Inflation Calculator takes an amount, an annual inflation rate and a time period in years, then shows the future value needed to keep pace, the purchasing power lost along the way, and what the amount is really worth at the end. No signup required.
The Two Directions
Inflation calculations go two ways, and both are useful.
Forward: What will today’s money buy in the future? At 3% annual inflation, $100 today has the purchasing power of about $74 in ten years. Your savings account might show $100, but it buys what $74 used to.
Backward: What would past money be worth now? $100 in 2000 had the same purchasing power as roughly $194 by mid-2026. When someone says they earned $40,000 in 1995, that is about $88,000 in 2026 dollars.
The formula for both:
Future cost = Present value x (1 + inflation rate)^years
Present purchasing power = Future value / (1 + inflation rate)^years
One nuance trips people up. Forward projections rest on a single assumed rate like 2% or 3%, because nobody knows the real number yet, and that is what the calculator above runs on: the rate you type in, applied evenly to every year. Past-to-present conversions work differently, because the actual numbers are already recorded. The $194 figure above comes from cumulative Consumer Price Index data between 2000 and 2026, not a flat 3%, which is why a historical result rarely matches a quick back-of-envelope estimate. The BLS CPI Inflation Calculator is the tool for that direction.
The Slow Erosion
A table makes the scale of this clearer. Here is what happens to $100 of purchasing power at different rates:
| Years | 2% Inflation | 3% Inflation | 4% Inflation |
|---|---|---|---|
| 5 | $90.57 | $86.26 | $82.19 |
| 10 | $82.03 | $74.41 | $67.56 |
| 20 | $67.30 | $55.37 | $45.64 |
| 30 | $55.21 | $41.20 | $30.83 |
At 3%, money loses nearly half its purchasing power in twenty years. This is the number that makes retirement planning so different from short-term budgeting. A $50,000 annual budget today requires about $90,000 in twenty years and $121,000 in thirty years to buy the same things. Not more things - the same things.
Your Inflation Is Not the National Average
The Consumer Price Index measures a weighted basket of goods. But nobody buys the basket. Individual spending patterns create a personal inflation rate that can differ meaningfully from the headline number.
Categories that inflate faster than average: Healthcare and higher education. Since 1990 the BLS medical care index has averaged roughly 3.7% a year and college tuition and fees roughly 4.8%, against about 2.6% for the headline CPI. Housing in high-demand cities and childcare tend to run ahead of the average as well. The gap has narrowed lately, with medical care and tuition both closer to 2.5% a year over the past decade.
Categories that inflate slower or deflate: Electronics and technology (prices generally fall), clothing, many consumer goods.
Someone spending 30% of their budget on healthcare, common for retirees, tracks the medical care index far more closely than the headline number. Someone whose major expenses are groceries and electronics sits on the other side of that split. The national average is useful as a starting point, but personal spending patterns tell the more accurate story.
Nominal vs. Real: The Most Misunderstood Distinction
When someone says the stock market returns “7%,” they usually mean the inflation-adjusted (real) return. The nominal return, what the account statement shows, has historically averaged closer to 10%. The difference is inflation eating into the gains.
This matters for any long-term projection:
Nominal return: What the account shows you gained. Real return: What that gain actually means in purchasing power.
A portfolio returning 8% in a year with 3% inflation has a real return of about 5%. The balance grew 8%, but only 5% of that represents increased buying power. The other 3% just kept pace with rising prices.
For long-term financial planning, using real returns produces more honest projections. The numbers are smaller but more meaningful.
Inflation and Fixed Debts: A Silver Lining
Here is a counterintuitive angle: inflation helps borrowers with fixed-rate debt.
A $2,000 monthly mortgage payment is $2,000 today. If incomes rise with inflation (say 3% annually), that same $2,000 payment feels more like $1,500 in ten years, relative to income. The debt amount stays fixed while the dollars used to pay it become less valuable.
This is one reason low-rate, fixed-rate mortgages are often kept rather than paid off aggressively. If the mortgage rate is below the inflation rate, the debt is effectively shrinking in real terms. Variable-rate debt does not have this benefit since rates can adjust upward.
Salary, Raises, and the Illusion of Progress
A 3% annual raise with 3% inflation means zero real increase. The paycheck is bigger but buys the same amount. Only raises above the inflation rate represent genuine gains in buying power.
This reframes how to think about career moves. A job paying $80,000 in a city with 2% local inflation might provide more actual purchasing power than $95,000 in a city where housing costs are rising 6% a year. The nominal salary is misleading without the inflation context.
Building Inflation Into Plans
Any financial plan extending beyond five years needs an inflation assumption. A few practical approaches:
Use real return rates for investment projections. Instead of projecting 10% stock returns, use 7%. The results are smaller but more honest about future purchasing power.
Increase savings contributions annually. If you save $500/month this year, $515/month next year (a 3% bump) keeps the real savings rate constant as prices and presumably income rise.
Review recurring expenses yearly. Insurance premiums, property taxes, subscriptions, and healthcare costs tend to creep up. Budgeting for these increases prevents the slow squeeze of expenses growing faster than the budget allocated to them.
The Financial Planning Template helps model projections with inflation assumptions. The Retirement Financial Planning Template specifically factors inflation into long-term retirement projections, where the impact is largest.
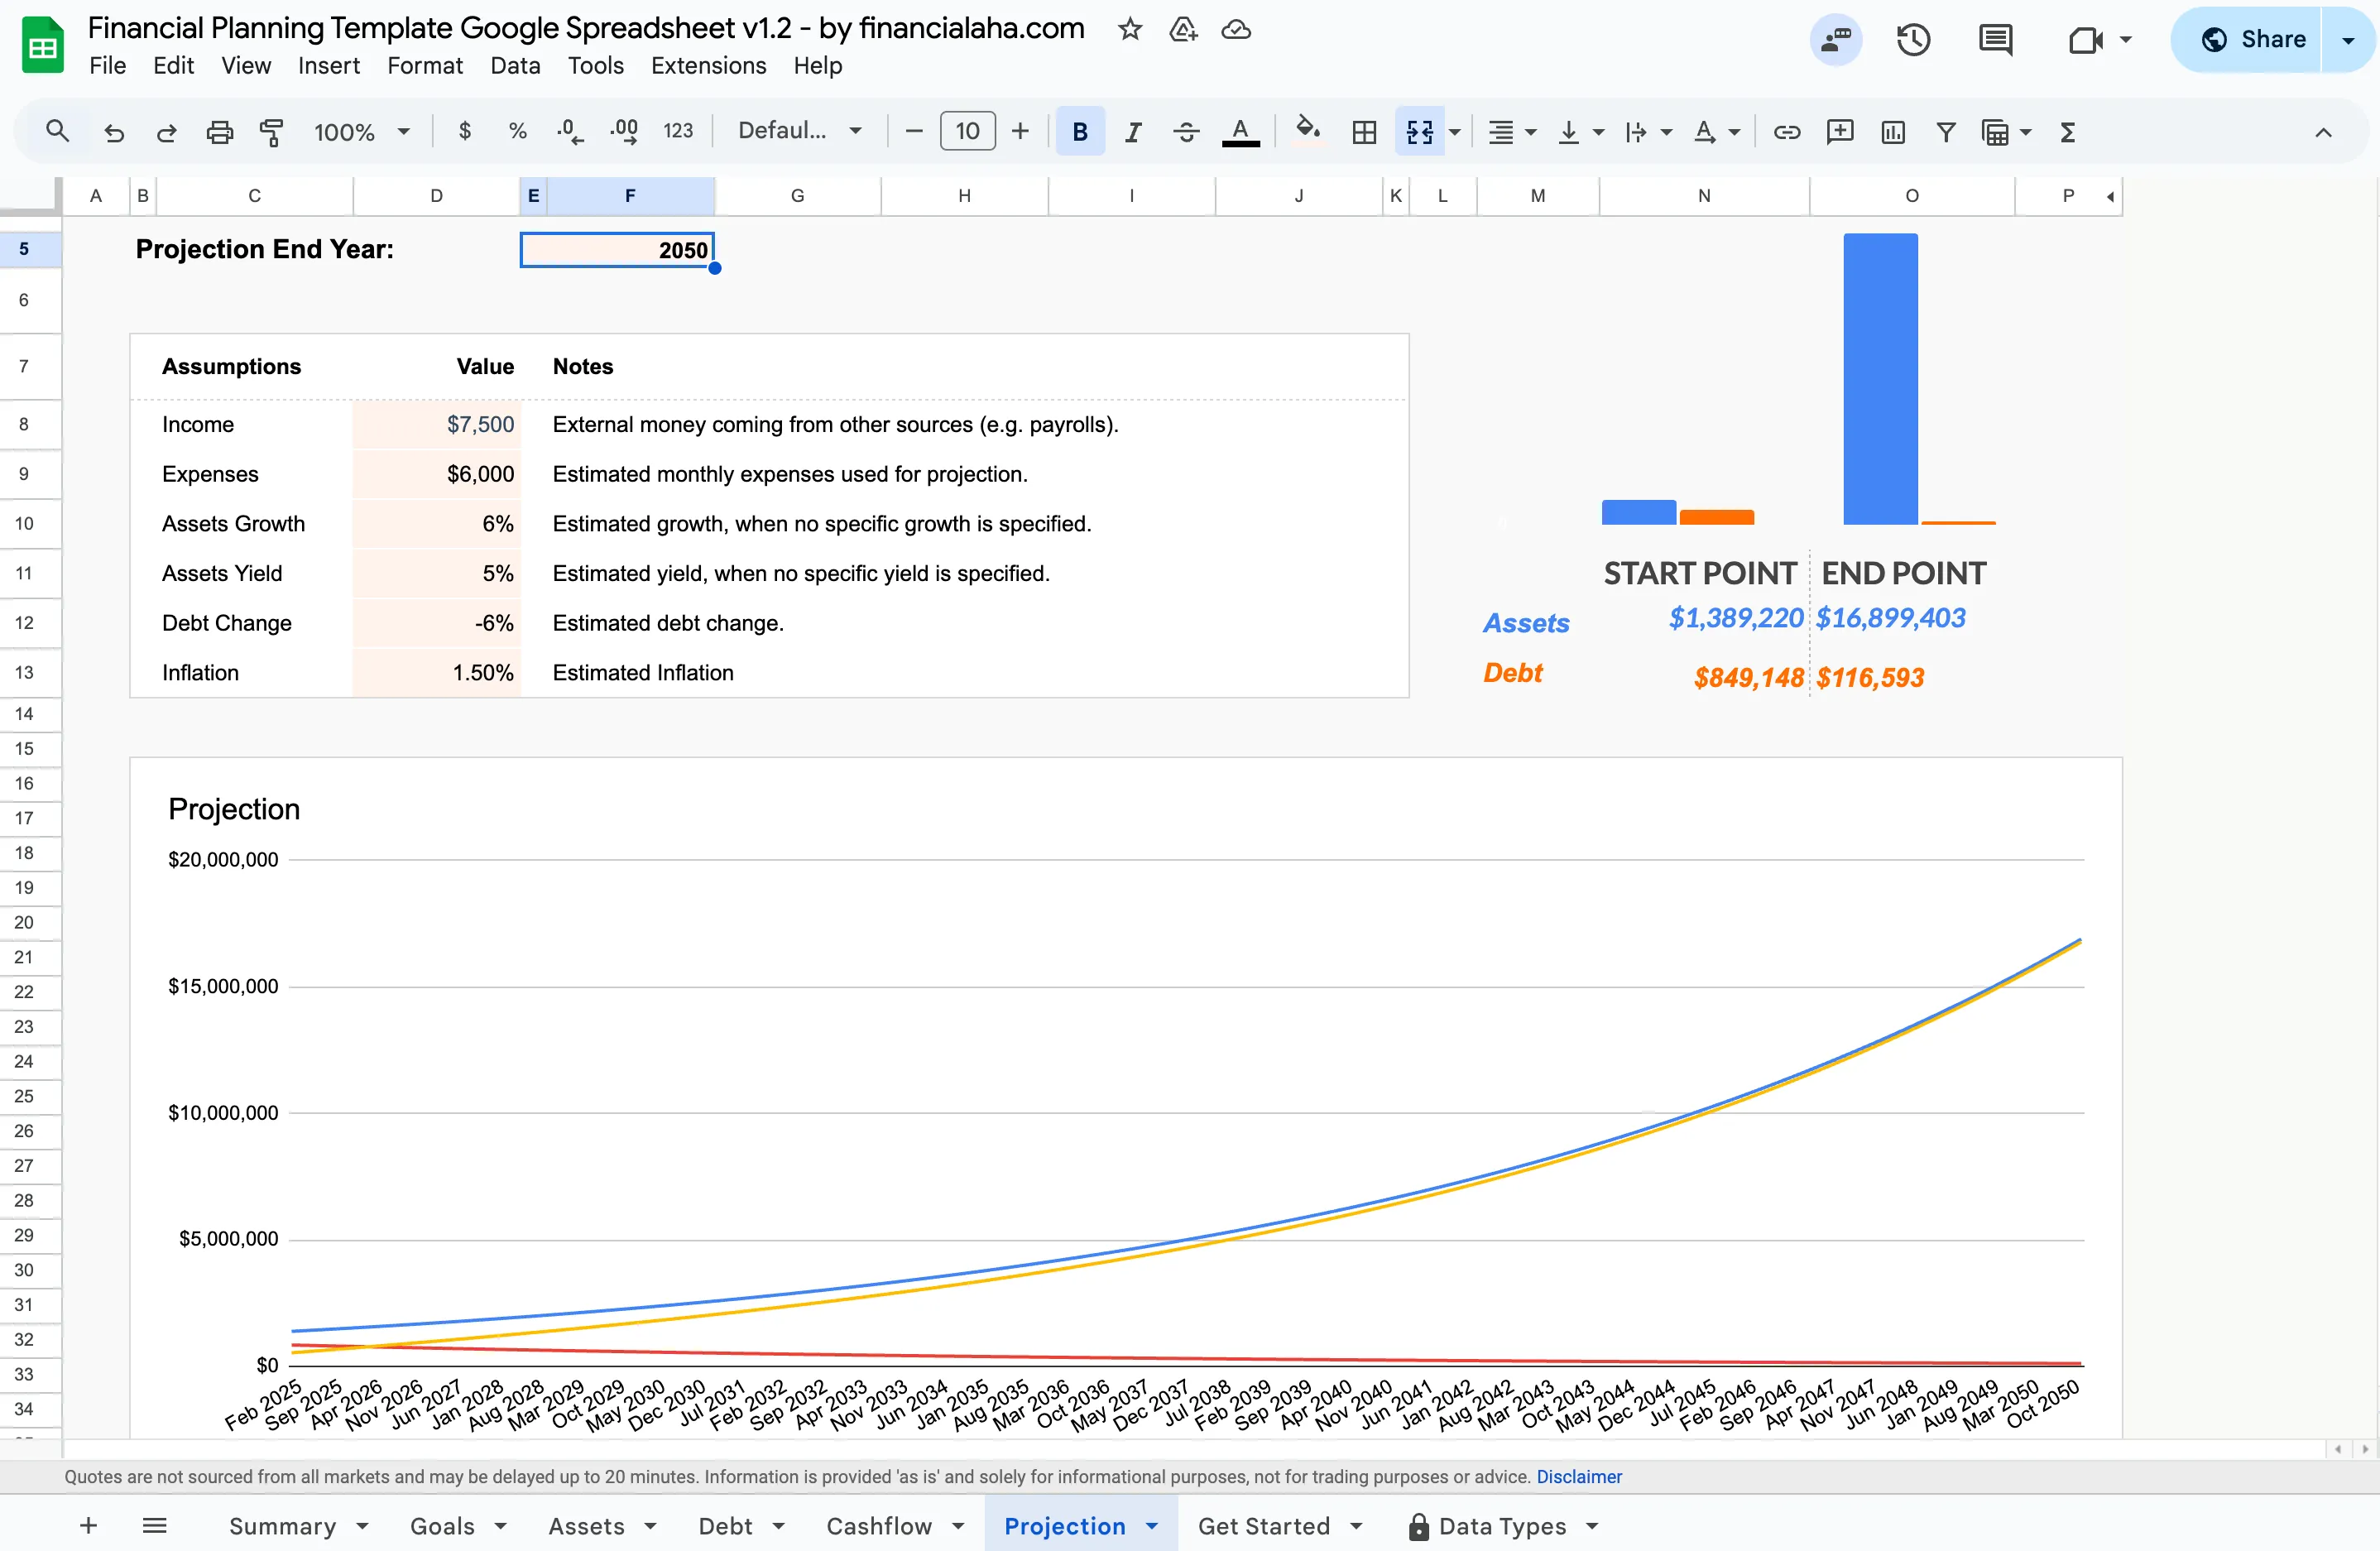 The Financial Planning Template (Premium) takes an inflation assumption as a direct input and carries it through the long-range projection.
More on Growth & Purchasing Power
- Compound Interest: The Math Behind Growth - How compounding works and why it matters for outpacing inflation
- Savings Calculator: How Your Money Grows - Model how regular contributions grow over time
Related
Frequently asked questions
What's a good inflation rate to assume for planning?
The US Federal Reserve targets 2% inflation over the longer run. The long-run historical average is closer to 3%. For conservative planning, using 3% is common. For recent-history planning, 2-2.5% has been more typical (excluding spikes).
Why does an inflation calculator give a different number than my own 3% math?
Because past-to-present conversions use actual recorded inflation, not a flat rate. A CPI-based tool such as the BLS inflation calculator pulls the cumulative price change between two years, so a real historical figure rarely matches a quick 3%-per-year estimate. The calculator on this page runs the other direction: it applies the flat rate you enter to each year ahead, since nobody knows the real future number yet.
Can I calculate inflation for a specific range of past years?
Not with the calculator on this page. It takes an amount, an annual inflation rate and a time period of 1 to 50 years, then projects forward from today. For a specific pair of past years, the BLS CPI inflation calculator uses recorded index data, which runs back to 1913.
Does inflation affect everyone equally?
No. Personal inflation depends on spending patterns. Someone whose budget is 40% housing in a rapidly appreciating area experiences higher inflation than the national average. Healthcare and education have historically inflated faster than the general rate.
How does inflation affect savings accounts?
If your savings account earns 4% and inflation is 3%, your real return is roughly 1%. Your balance grows, but purchasing power grows much more slowly than the account balance suggests.
Should I adjust my budget for inflation annually?
It's worth reviewing. If expenses rise 3% annually but income doesn't, the budget gradually tightens. Annual adjustments help catch this before it becomes a problem.
Sources
- Why does the Federal Reserve aim for inflation of 2 percent over the longer run? - Federal Reserve
- CPI Inflation Calculator - U.S. Bureau of Labor Statistics
- Consumer Price Index Databases - U.S. Bureau of Labor Statistics
- Median Sales Price of Houses Sold for the United States (MSPUS) - Federal Reserve Bank of St. Louis (FRED)
About this article
Purchasing-power figures were recomputed from the compound inflation formula at the stated rates. Historical dollar values were recomputed on 2026-09-10 from the BLS CPI-U series (CUUR0000SA0, July 2026 = 333.918); the 1990 and 2024 home prices come from the FRED median sales price series (MSPUS). Category inflation rates were recomputed on 2026-09-10 from the BLS medical care (CUUR0000SAM) and college tuition and fees (CUUR0000SEEB) indexes. Calculator inputs and outputs checked on 2026-09-10 against the shipped Inflation Calculator component: amount, annual inflation rate and years, returning Future Value Needed, Purchasing Power Lost and Real Value of Money. Template claims checked on 2026-09-10 against the shipped Financial Planning Google Sheet (Projection tab inflation assumption and projection chart) and the Retirement Financial Planning Projections Google Sheet (Inputs tab inflation rate, Projections scenario comparison). Last reviewed September 2026.