
On a $90,000 income (about $7,500 a month), the 28/36 rule caps the housing payment at $2,100 a month, which supports roughly a $326,000 home with 20% down at 6.5%. Conventional underwriting stretches total debt as far as 50% of gross income, so a pre-approval marks a ceiling rather than a comfortable target.
The bank says you can afford $420,000. Your gut says maybe $350,000. Your partner says $380,000. Everybody is using different math, and nobody is necessarily wrong - they are just measuring different things.
The bank measures risk to itself. Your gut measures monthly comfort. Only one of those two is arithmetic, and putting a number on it is what marks where the gap starts.
The Home Affordability Calculator takes annual income, monthly debts, down payment, interest rate, loan term, property tax rate and insurance rate, then applies the 28/36 ratios to return a maximum home price, the loan behind it, and the monthly payment. No signup required.
What the Bank Sees vs. What You Live
Lenders use the 28/36 rule, a debt-to-income ratio guideline, as a starting point:
- Housing costs (mortgage, taxes, insurance) should not exceed 28% of gross monthly income
- Total debt payments (housing plus car, student loans, credit cards) should not exceed 36% of gross monthly income
On a $90,000 salary - $7,500/month gross:
If you carry $400/month in other debt, the 36% test leaves $2,300 for housing, but the 28% test caps it at $2,100, so $2,100 is the number that binds. Other debt only starts cutting into the housing figure past $600 a month, the point where the two caps meet. The calculator takes the lower of the two the same way.
Here is the thing: conventional underwriting runs well past 36%. Fannie Mae’s selling guide puts the maximum total debt-to-income ratio at 50% for loan files run through its automated underwriting, and at 45% for manually underwritten loans that clear the credit score and reserve requirements. Getting approved for $400,000 does not mean a $400,000 mortgage fits your life. The lender’s model does not know about your childcare costs, retirement contributions, travel habits, or the fact that you eat out four nights a week and have no intention of stopping.
Many financial planning approaches suggest 25% of gross income for total housing costs instead of 28%. On $7,500/month, that is $1,875 rather than $2,100. A modest monthly difference, but it preserves flexibility for everything else.
From Payment to Price Tag
Working backward from a monthly payment to a purchase price:
Starting point: $2,100/month maximum housing cost.
Subtract property taxes ($300/month estimate) and homeowner’s insurance ($150/month). That leaves $1,650 for mortgage principal and interest.
At 6.5% interest on a 30-year term, $1,650/month supports a loan of about $261,000. With 20% down, the purchase price comes to roughly $326,000. With 10% down the same $261,000 loan covers a smaller share of the purchase, so the price lands closer to $290,000. Below 20% down, private mortgage insurance (PMI) also takes a slice of the payment, which pulls the workable figure lower still.
The calculator runs the payment-to-price loop instantly, taking property tax and insurance as rates on the home price rather than the flat dollar estimates used above. It has no PMI input, so that cost belongs alongside the result rather than inside it. Understanding how payment converts to price also helps when evaluating listings on the fly.
The Costs That Are Not the Mortgage
Comparing a mortgage payment to current rent is one of the most common mistakes in home buying. The mortgage is one line item:
| Cost | Typical Monthly Range | |------|----------------------| | Mortgage (principal + interest) | Varies | | Property taxes | $200 - $800+ | | Homeowner’s insurance | $100 - $300+ | | PMI (if less than 20% down) | $100 - $300 | | Maintenance and repairs | ~1% of home value per year | | HOA fees | $0 - $500+ | | Higher utilities vs. renting | $100 - $300 |
A $300,000 home with a $1,650 mortgage payment has a true monthly cost closer to $2,500-$3,000. That maintenance line, about $250/month on a $300,000 home, catches many new homeowners off guard. Roofs, water heaters, HVAC systems, and appliances do not break on a schedule, but they do break.
The Down Payment Trade-Off
On a $350,000 home at 6.5% for 30 years:
| Down Payment | Cash Needed | Monthly P&I | PMI | Total Monthly | |-------------|-------------|------------|-----|---------------| | 5% ($17,500) | $17,500 | $2,102 | ~$175 | $2,277 | | 10% ($35,000) | $35,000 | $1,991 | ~$130 | $2,121 | | 20% ($70,000) | $70,000 | $1,770 | $0 | $1,770 |
Going from 5% to 20% down saves $507/month - over $180,000 in reduced payments and eliminated PMI across the loan. But producing an extra $52,500 in cash takes time. Time during which home prices, interest rates, and rent all keep moving.
There is no universally correct answer here. Waiting to save 20% makes financial sense on paper but may not in a rising market with rising rents. Buying sooner with less down costs more monthly but locks in the purchase. Changing the down payment figure in the calculator shows how the maximum price and the monthly payment move together, with the PMI column above added on top.
The Down Payment Calculator estimates how long reaching a target takes from current savings, a monthly savings amount and the APY on the account, and it folds a closing costs percentage into the total needed.
Running Your Own Scenario
The manual process, if you want to understand the mechanics:
- Start with gross monthly income
- Multiply by 0.25 to 0.28 for a comfortable housing range
- Subtract estimated property taxes, insurance, and PMI (if applicable)
- The remainder is your maximum mortgage payment
- Convert that payment to a loan amount at current interest rates
- Add your down payment to get a maximum purchase price
Or skip the arithmetic and test scenarios in the calculator.
For seeing how a mortgage payment fits alongside every other monthly expense, the Monthly Budget Template shows housing costs in the context of the full picture. That context is where most people realize whether a number is genuinely comfortable or just technically possible.
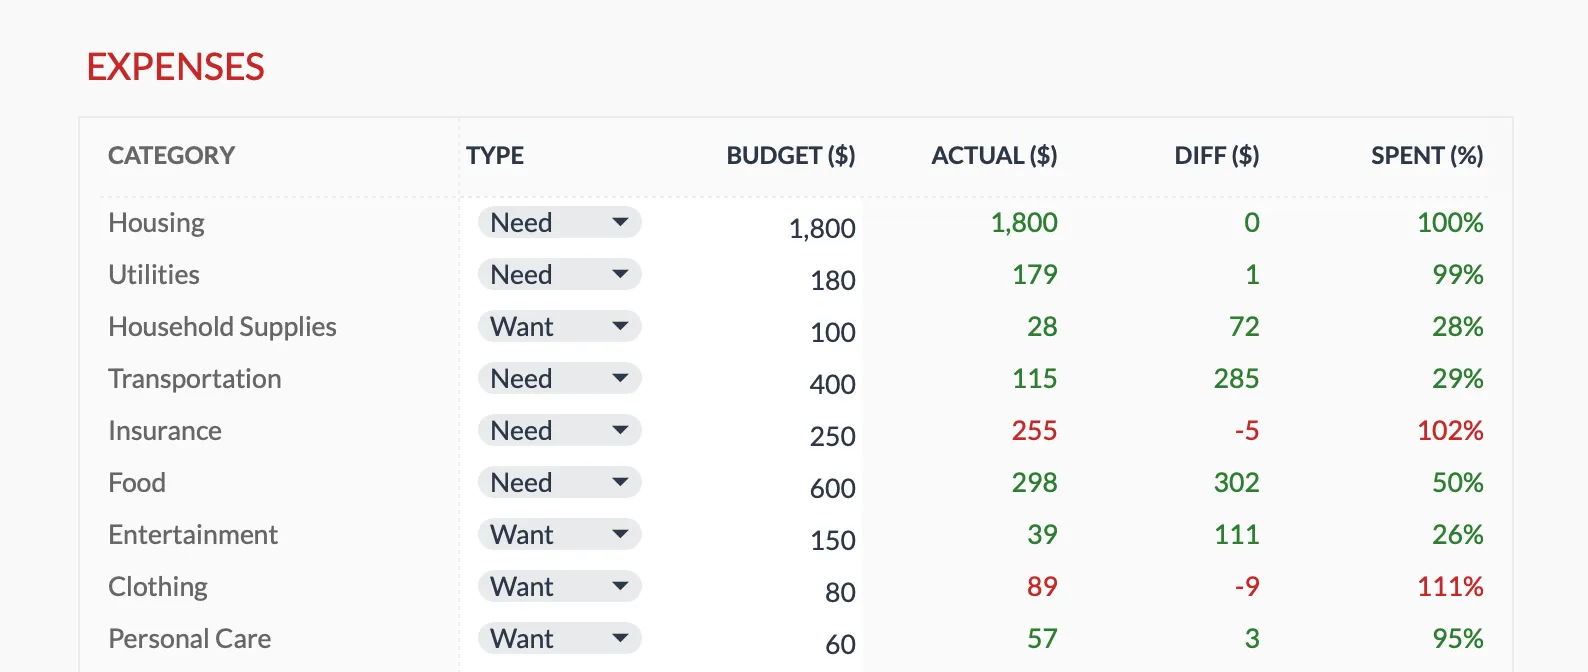 The Monthly Budgeting template (Premium tier) puts the housing line at the top of its Budget Plan sheet, with budget, actual and difference next to every other category, so a mortgage estimate stops being an isolated number.
More on Housing & Mortgages
- Down Payment Calculator: How Much to Save for a Home - How much to target, the tradeoffs of different percentages, and building a savings plan
- How Much House Can I Afford Spreadsheet - Runs the 28/36 ceiling, the lender DTI, and the true cost of ownership side by side
- Rent vs. Sell Calculator: What to Do With Your Property - The rent-out-versus-sell decision for a home you already own
- Rent vs. Buy Calculator: The Real Comparison - The full cost comparison between renting and buying, including opportunity cost
- Mortgage Payoff Calculator: Extra Payments Impact - How extra payments shorten your loan term and save on interest
- Mortgage Refinance Calculator: When Does Refinancing Make Sense? - The breakeven calculation for swapping to a lower rate
Related
Frequently asked questions
What is the 28/36 rule?
The 28/36 rule says housing costs (mortgage, taxes, insurance) shouldn't exceed 28% of gross income, and total debt payments shouldn't exceed 36%. These are guidelines, not absolute limits.
Does pre-approval mean I can afford that amount?
Not necessarily. Pre-approval shows what a lender will lend you, not what's comfortable. Lenders don't account for your childcare costs, savings goals, or lifestyle preferences.
How much should I put down?
20% avoids private mortgage insurance (PMI), but many buyers put down less. FHA loans allow 3.5%. The tradeoff is higher monthly payments and additional PMI costs.
What about property taxes and insurance?
These are part of your total housing cost and can add $300-$1,000+ monthly depending on location and home value. The Home Affordability Calculator takes both as percentage rates on the home price rather than flat amounts, so they scale as the price moves.
Should I use gross or net income for the 28/36 rule?
The 28/36 rule uses gross monthly income, meaning your pay before taxes and deductions. Because take-home pay is lower, the same percentages leave less real room than they appear to, which is one reason a payment a lender approves can feel tighter than the math suggested.
What interest rate should I plug into an affordability estimate?
A rate close to what you would actually be quoted today gives the most useful result, since the monthly payment moves sharply with it. The examples here use 6.5% on a 30-year term. Even a one-point change in the rate can shift the supported loan amount by tens of thousands of dollars.
Sources
- What is a debt-to-income ratio? - Consumer Financial Protection Bureau
- What is private mortgage insurance? - Consumer Financial Protection Bureau
- B3-6-02, Debt-to-Income Ratios - Fannie Mae Selling Guide
About this article
Monthly payment and loan-amount figures were recalculated from a 30-year amortization at 6.5% on 2026-09-10. Calculator inputs, the 28/36 ratio logic and the displayed outputs were checked on 2026-09-10 against the shipped Home Affordability Calculator component (annual income, monthly debts, down payment, interest rate, loan term, property tax rate, insurance rate; max home price, max loan amount, monthly payment, front-end and back-end DTI). Template sheets and figures were checked on 2026-09-10 against the shipped Monthly Budgeting Google Sheet (Summary, Budget Plan, Transactions tabs). PMI mechanics were verified against Consumer Financial Protection Bureau guidance, and lender debt-to-income ceilings against the Fannie Mae Selling Guide. Last reviewed September 2026.