Set up a transaction sheet with Date, Category, and Amount columns, total each category with SUMIFS or a pivot table, then add a chart to see where money goes. Google Sheets is free, syncs across every device, and takes about 2-3 minutes a day once the habit sticks. Build it from scratch or start from a ready-made template.
Tracking expenses in a spreadsheet means knowing exactly where your money goes each month. Not guessing, not estimating - knowing. It takes about 2-3 minutes per day once you have a system, and the clarity it provides changes how you think about spending.
Google Sheets is one of the simplest ways to do this. It’s free, works on your phone and computer, and keeps everything synced. Here’s how to set it up - either from scratch or with a template.
Quick option: If you want to skip the setup and start tracking today, the Monthly Expense Tracker (one-time purchase) comes with categories, formulas, and charts already built. Make a copy and start entering expenses.
Option 1: Use a Template
The fastest path. Three options depending on your budget:
Free - Google’s built-in template. Open Google Sheets, click Template Gallery, and choose “Monthly Budget.” It’s basic - income, expenses, and a summary - but functional for getting started.
FinancialAha Expense Tracker. Pre-built expense, income and savings categories, automatic totals showing each category’s share of the month, distribution charts, and a savings section next to the expense log. One copy covers one month. Works in Google Sheets. The setup is essentially: make a copy and start typing. One-time purchase.
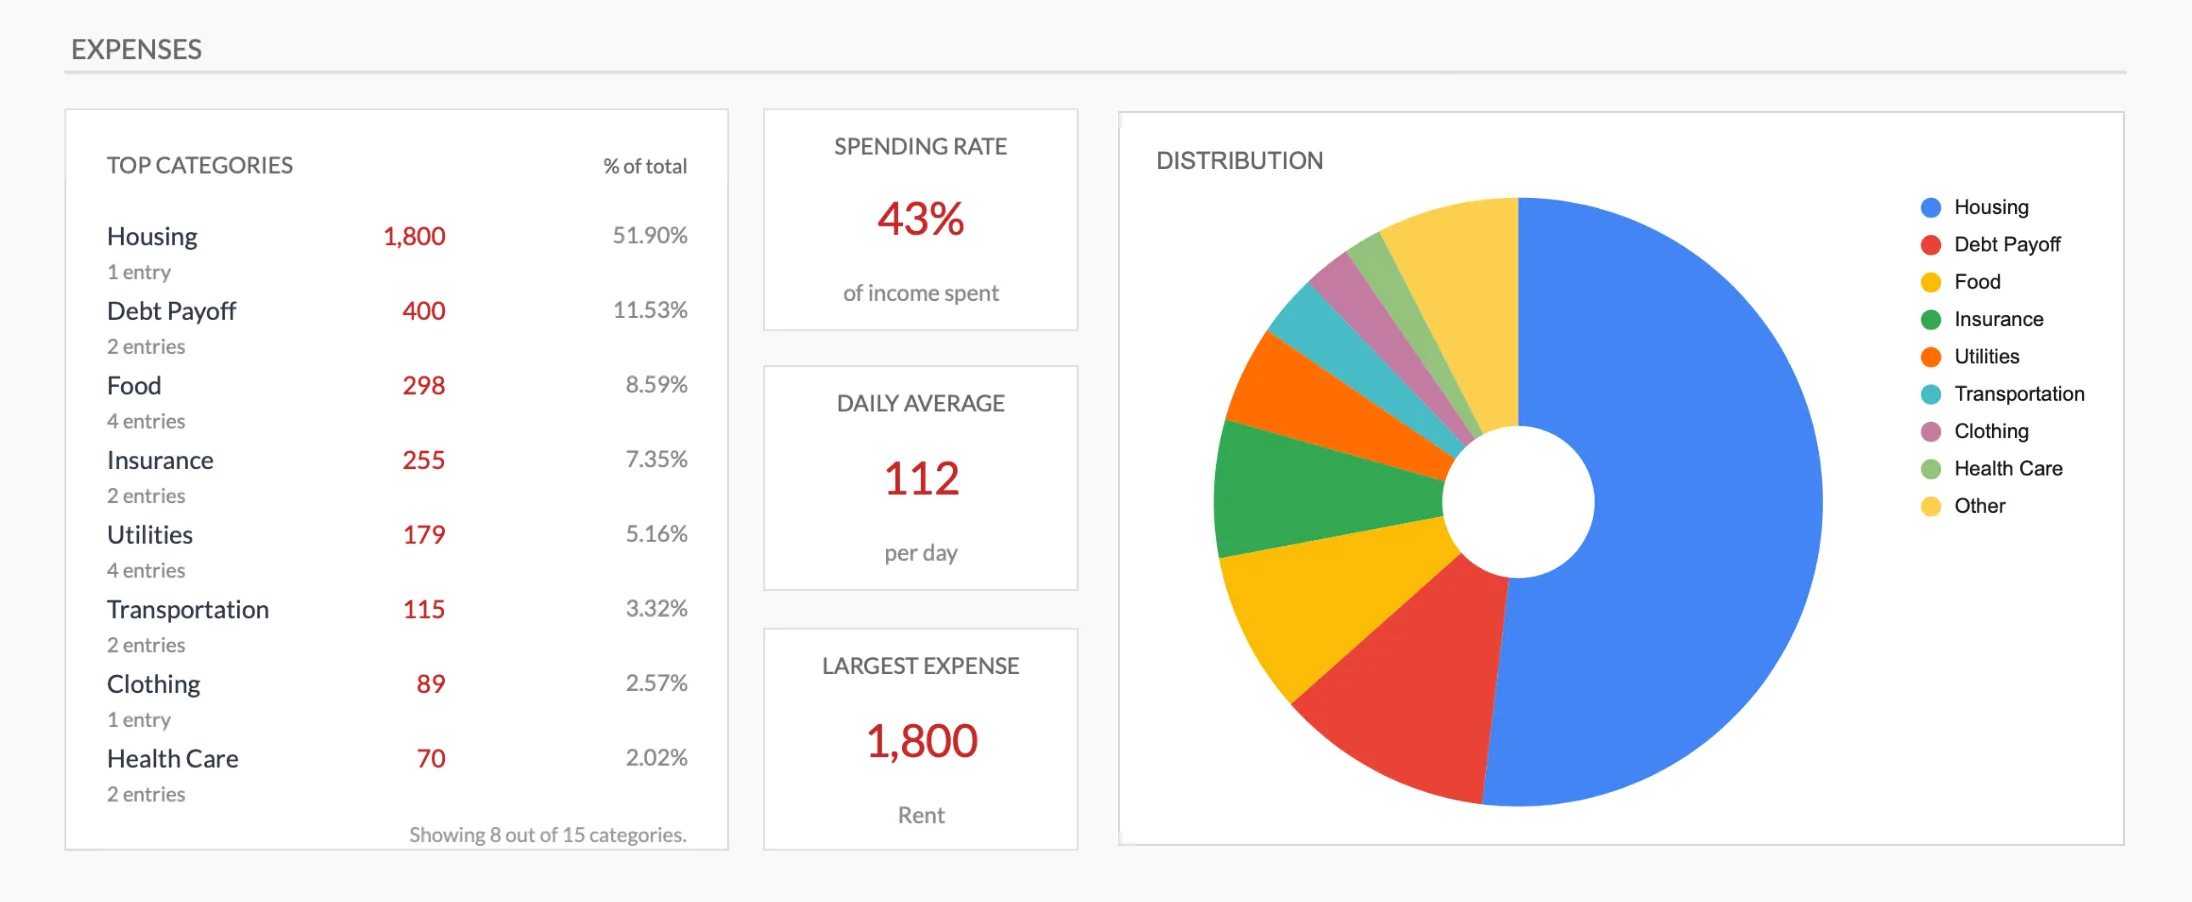 The Monthly Expense Tracker (Premium tier) ranks your top spending categories by share of the total and charts the split as you enter expenses.
FinancialAha Monthly Budget. The same transaction log and category totals, plus a Budget Plan sheet that holds a budget, an actual and the difference for every category. If you want to both track and plan, this covers both. One-time purchase. See the comparison for how these stack up against other options.
Option 2: Build Your Own
If you prefer to build from scratch, here’s a structure that works.
Step 1: Create the Transaction Sheet
Set up columns for:
| Date | Description | Category | Amount | Payment Method | Notes |
|---|---|---|---|---|---|
| 2026-03-01 | Grocery store | Food | 87.50 | Debit card | Weekly groceries |
| 2026-03-01 | Gas station | Transportation | 45.00 | Credit card | |
| 2026-03-02 | Electric bill | Utilities | 112.00 | Auto-pay |
The Date and Category columns are the most important. Date lets you filter by month. Category lets you see where money goes.
Step 2: Define Your Categories
Start simple. These 10 categories cover most people’s spending:
- Housing - Rent/mortgage, property tax, HOA
- Food - Groceries and dining out (split if you want more detail)
- Transportation - Gas, car payment, insurance, parking, transit
- Utilities - Electric, gas, water, internet, phone
- Insurance - Health, life, renter’s/homeowner’s (if not in housing)
- Healthcare - Co-pays, prescriptions, dental, vision
- Entertainment - Streaming, hobbies, events, dining out
- Personal - Clothing, haircuts, personal care
- Subscriptions - Monthly services, memberships, software
- Other - Anything that doesn’t fit neatly elsewhere
You can always split categories later. Starting with fewer categories means less decision fatigue when entering transactions. For a deeper look at which lines to include and how to group them, see how to organize expense categories.
Step 3: Add a Summary View
On a second tab, use SUMIFS to total spending by category:
=SUMIFS(Transactions!D:D, Transactions!C:C, "Food", Transactions!A:A, ">="&DATE(2026,3,1), Transactions!A:A, "<"&DATE(2026,4,1))This totals every “Food” expense dated in March 2026. SUMIFS needs each criteria to point at a real column, so the month is expressed as two date bounds (on or after March 1, before April 1) rather than wrapping the date column in MONTH(), which would return an array and break the formula. Create a row for each category, and change the dates to move to another month.
For a simpler approach, a pivot table does this automatically: Select your data, go to Insert > Pivot table, put Category in Rows and Amount in Values. Our Google Sheets formulas for budgeting guide walks through more of these totals.
Step 4: Add a Chart
Select your category totals and insert a pie chart (Insert > Chart). This gives the “where does my money go” visual at a glance.
A bar chart comparing categories month over month is even more useful once you have 2-3 months of data. Trends matter more than any single month.
Making It Stick
The spreadsheet is the easy part. The habit is what matters.
Enter expenses at the same time each day. After dinner, before bed, during your morning coffee - pick a time and make it routine. Two minutes a day is all it takes.
Use the Google Sheets mobile app. Enter expenses as they happen rather than trying to remember them later. The app is free and syncs instantly. Our guide to budgeting on the go in Google Sheets covers the mobile entry workflow.
Don’t aim for perfection. Forgetting to log a $4 coffee won’t ruin your financial picture. Missing a $200 utility bill will. Focus on capturing the big stuff consistently, and let small gaps go.
Review monthly. At the end of each month, spend 10 minutes looking at the totals. Which categories surprised you? Where did spending differ from what you expected? This monthly review is where the value actually lives.
When to Upgrade
If you’ve been tracking expenses for 2-3 months and want more, here are signs you’re ready for the next step:
- You want to set spending targets, not just record what happened - Monthly Budget Template
- You want to see the full year at once - Annual Budget Planner
- You want to track net worth alongside spending - Financial Planning Template
- You want to compare budgeting methods - see 15 budgeting methods compared
Start where you are. The most useful spreadsheet is the one you actually open. If you are still deciding between tracking and planning, expense tracker vs budget template lays out which job each one does.
Related
- Expense Tracker vs Budget Template - which tool fits tracking versus planning
- How to Organize Expense Categories - grouping your spending so totals mean something
- Google Sheets Formulas for Budgeting - the SUMIFS and totals your entries feed
- Google Sheets Mobile: Budget on the Go - entering expenses from your phone
- How to Import Bank Statements into Google Sheets - pull transactions in by CSV instead of typing each one
- How to Build a Side Hustle Income Tracker in Google Sheets - a separate tracker for 1099 income, expenses, and tax set-aside
Frequently asked questions
Is Google Sheets good for tracking expenses?
Yes. Google Sheets handles expense tracking well - it's free, accessible from any device, syncs automatically, and supports formulas that total categories and create charts. The main limitation is that you enter transactions manually rather than syncing with your bank.
How often should I enter expenses?
Daily is ideal but weekly works fine for most people. The longer you wait, the more transactions you forget. Many people enter expenses at the end of each day, which takes 2-3 minutes once the habit is established.
What expense categories should I use?
Start with 8-12 categories that match your actual spending: Housing, Food/Groceries, Transportation, Utilities, Insurance, Healthcare, Entertainment, Personal Care, Clothing, and Subscriptions cover the basics. Add or merge categories based on what matters to you.
Should I track every single expense?
Tracking everything gives the clearest picture, but tracking nothing is the alternative for most people who try to be perfect. If logging every coffee feels unsustainable, round to the nearest dollar and batch small purchases. Consistent approximate tracking beats sporadic perfect tracking.
What's the difference between expense tracking and budgeting?
Expense tracking records what you spent - it's backward-looking. Budgeting adds a plan - you set targets for each category and compare actual spending against them. Many people start with tracking alone and add budget targets once they understand their spending patterns.
Can Google Sheets import my bank transactions automatically?
Not on its own. Google Sheets has no built-in bank connection, so you enter transactions by hand or paste them in. One workaround is to download a CSV from your bank and copy it into your transaction sheet, then tidy up the columns. Some third-party add-ons offer bank sync, but the plain-Sheets approach is manual entry.
Does the expense tracker work in Excel, or only Google Sheets?
The FinancialAha Monthly Expense Tracker is built for Google Sheets. You make a copy into your own Google account and enter expenses there. If you prefer Excel, the formulas in this guide (SUMIFS, pivot tables, charts) all work in Excel too, so a from-scratch build carries over.
Sources
- SUMIFS function - Google Docs Editors Help
- Create & use pivot tables - Google Docs Editors Help
- Add & edit a chart or graph - Google Docs Editors Help
About this article
Formulas (SUMIFS, pivot tables, charts) tested in Google Sheets against the official Google Docs Editors Help references. Template sheets, inputs and outputs checked on 2026-09-10 against the shipped Monthly Expense Tracker (Summary, Transactions, Categories tabs) and Monthly Budgeting (Budget Plan tab) Google Sheets. Last reviewed September 2026.