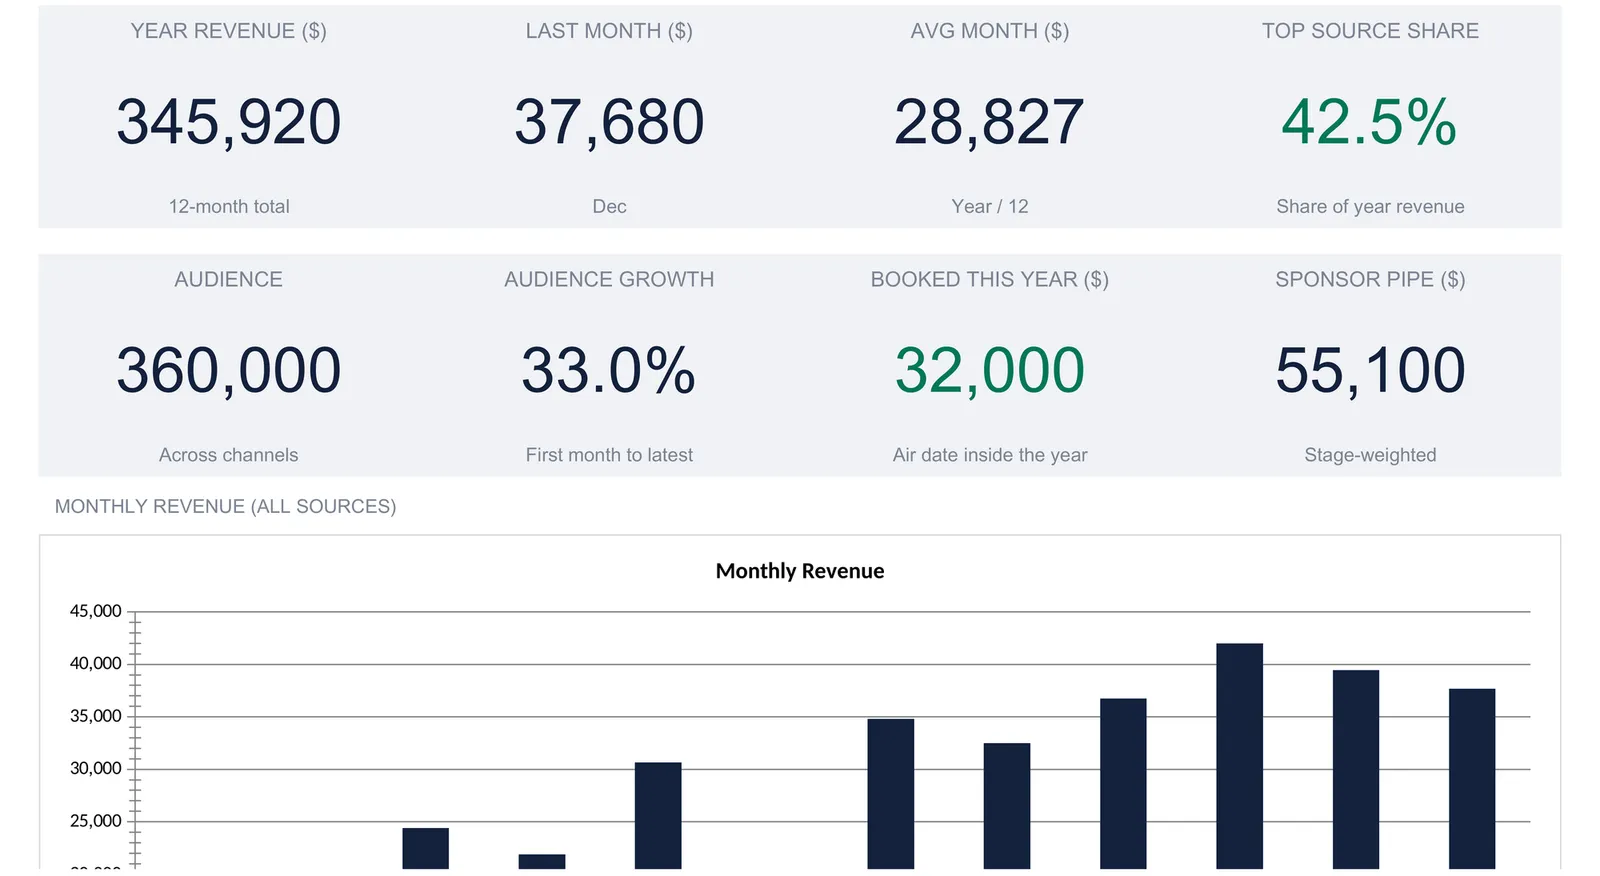
A creator revenue tracker keeps every income source in one monthly ledger and reads the rest from it: total by source, channel growth, RPM-based views revenue, and a stage-weighted sponsor pipeline. This walkthrough covers the full structure with a worked example, a creator business at $345,920 for the year across five sources, 360,000 followers, and a $55,100 weighted pipeline. Our Creator Revenue Tracker Spreadsheet Template ($29) ships the same structure ready for Excel and Google Sheets.
A creator business earns from more places than any single platform dashboard shows. Ad share lands from one place, a sponsor pays from another, an affiliate network reports somewhere else, and the digital products and paid community collect on their own schedules. Each source has its own login and its own idea of a month. Most creators can say what YouTube paid out last month. Far fewer can say what the whole business earned, which source is carrying it, and whether the audience that feeds all of it is still growing. The gap between those answers is structure, and a spreadsheet handles it well.
That structure is a handful of pieces: one monthly ledger of revenue by source, a channel table that sizes each platform and its views income, a subscriber trend behind those channels, a sponsor pipeline weighted by how likely each deal is to close, and a dashboard that reads all of it back. The examples below come from our Creator Revenue Tracker Spreadsheet Template ($29), which ships the whole thing ready-made for Excel and Google Sheets. The layout is reproducible by hand if you would rather build your own.
What a creator revenue tracker has to hold
Strip away the platform apps and a multi-source creator business comes down to a few kinds of data:
- Revenue by source, month by month. Platform ads, sponsorships, affiliate, digital products, paid community, and whatever else earns. This is the raw material for the year total and every share figure.
- Channel size and views income. How large each platform is, how fast it is growing, and the slice of revenue that comes purely from views at a given RPM.
- The subscriber trend. A monthly follower snapshot per channel, which is what turns a single follower count into a growth rate.
- The sponsor pipeline. Deals at different stages, each with a value and a probability of closing, so the future is weighted rather than guessed at.
- Derived metrics. Year revenue, average month, top source share, audience size and growth, booked deals, and the weighted pipeline. These are calculations, not entries; nothing here is ever typed.
The tracker gives each of these its own sheet (Revenue Streams, Channels, Audience, and Sponsors), with a Settings sheet for the constants, a Dashboard on top, and a How to Use sheet carrying the instructions. That is six working sheets, which is why this walkthrough runs longer than a single-ledger tracker: each sheet earns its place.
Start with the constants: the Settings sheet
Three fields on the Settings sheet scope everything downstream, so they come first.
Business name. A single label, “Aurora Creator” in the sample, that prints under the title on the Dashboard, on each of the four data sheets, and on Settings itself. One business name means one creator business per file.
Currency symbol. Chosen from a dropdown of 35 symbols. Picking one relabels every money column header and KPI label across the whole workbook. It relabels only, with no conversion of the numbers, so the figures keep their values and only the symbol in front of them changes.
Year. The tracking year, 2026 in the sample. This is not decoration. The year here sets the window for the booked-deal figure on the dashboard, so a sponsor deal only counts toward the year once its air date falls inside it.
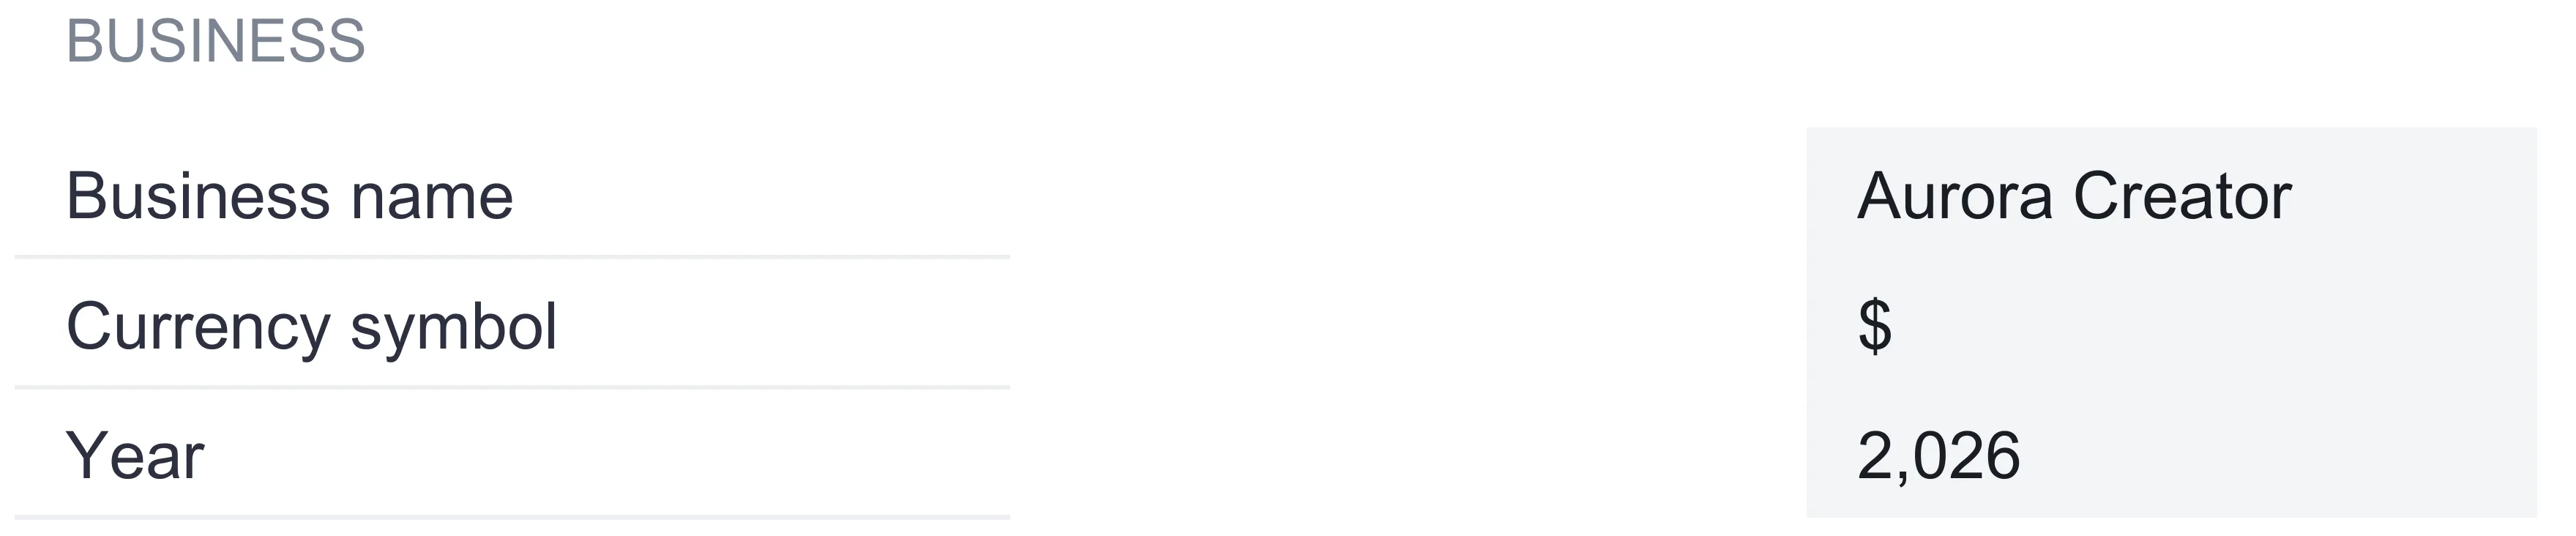
Those three settings are the entire input on this sheet. Everything else in the workbook is either a per-row entry on one of the four data sheets or a formula that reads back from them.
Log income by source: the Revenue Streams sheet
Revenue Streams is where content creator income gets recorded, and it is the sheet the year total is built from. Each row is a source, and each source has twelve monthly cells across January to December plus a Total column that sums them. The sample carries five named sources:
| Source | Year total ($) |
|---|---|
| Platform ads (YouTube) | 70,500 |
| Sponsorships | 147,000 |
| Affiliate | 19,720 |
| Digital products | 66,700 |
| Paid community | 42,000 |
| Year total | 345,920 |
The shape of each source tells its own story. Platform ads climb steadily from $3,200 in January to $8,200 in December, the signature of a growing channel earning more from the same effort. Sponsorships are the largest line at $147,000, yet they are also the lumpiest: two months, February and June, book nothing at all, while October alone brings $22,000. That combination is the whole reason to track by source rather than by one monthly figure. A creator reading only a lump total would see February dip and not know whether the audience softened or a sponsor simply slipped a month.
The bottom of the sheet carries a Monthly total row, which adds every source within each month and gives the twelve numbers the dashboard chart is drawn from: $19,200 in January, $11,450 in February, up through $42,000 in October, and $37,680 in December. The far corner of that row holds the year total, $345,920, which is the same figure whether you sum the source totals down the Total column or the monthly totals across the bottom.
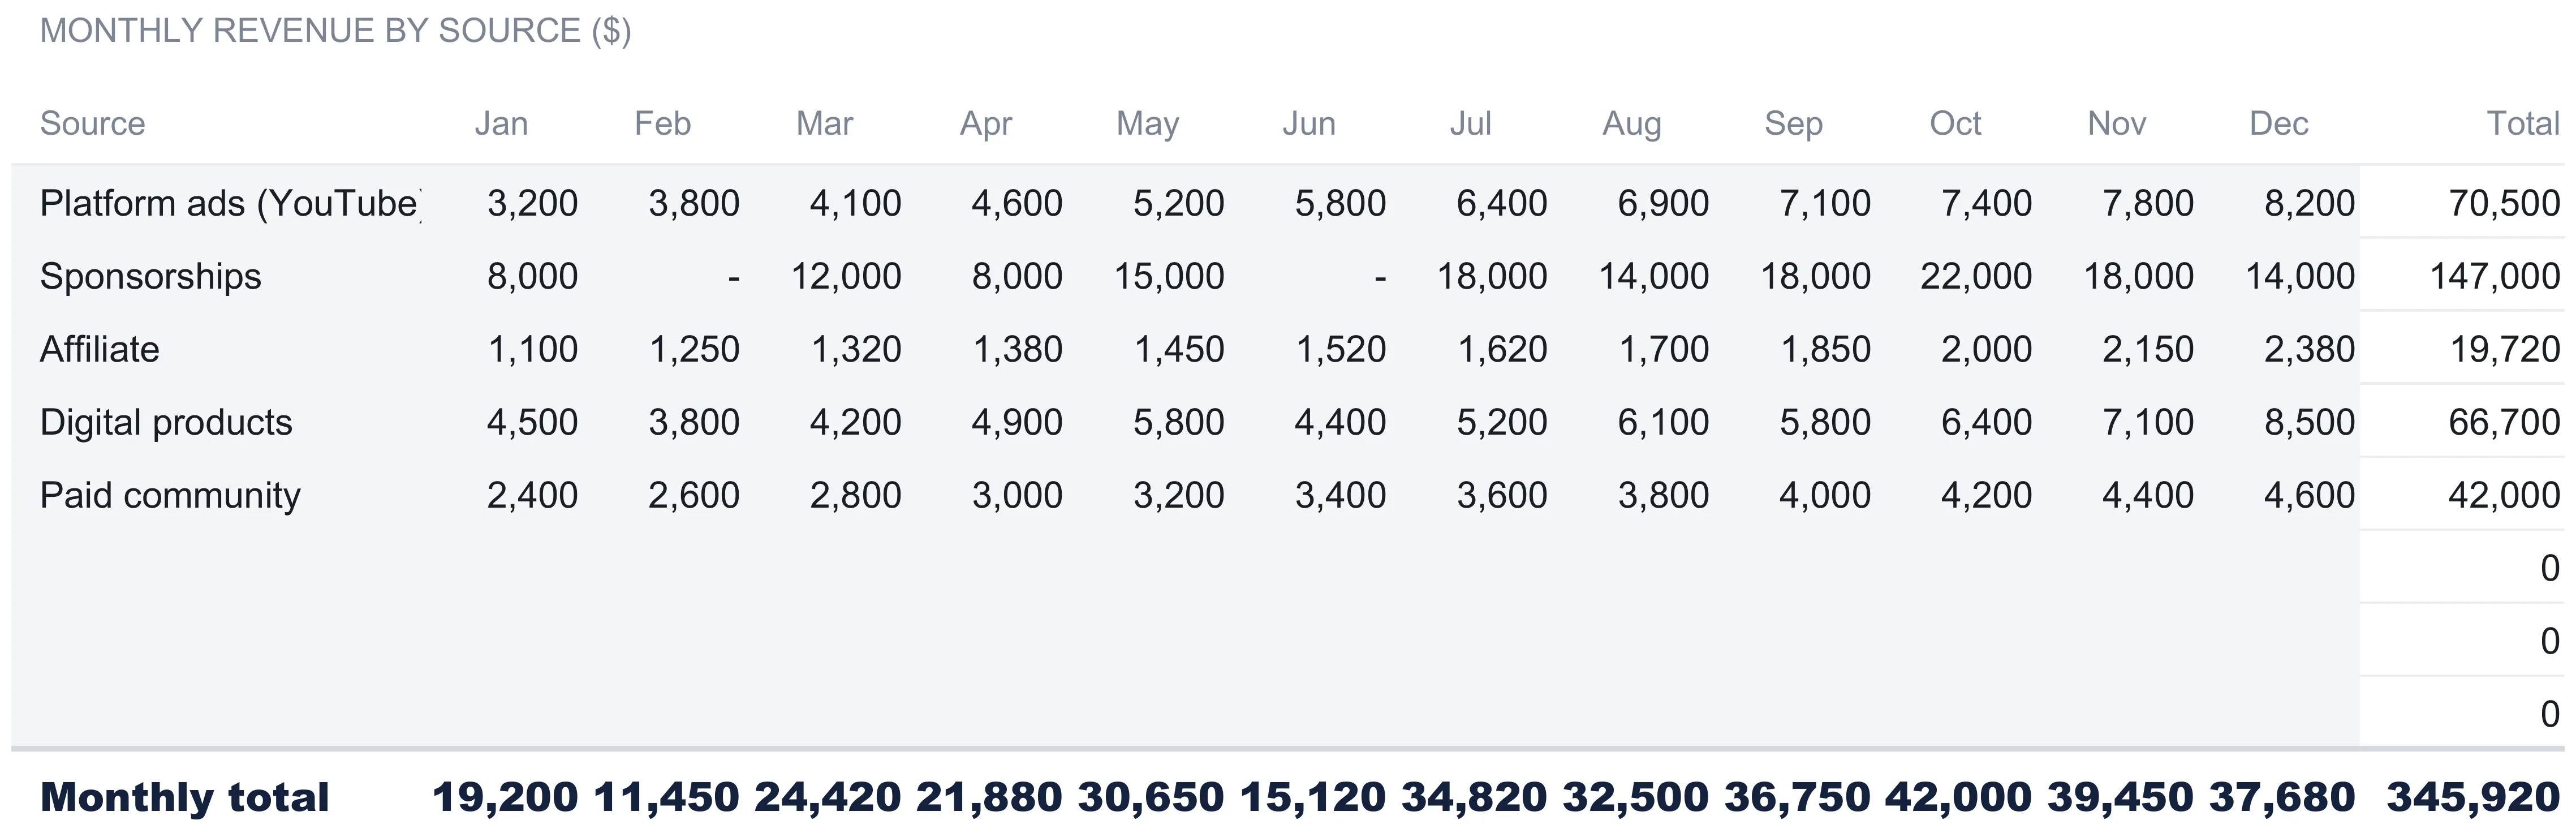
The other three sources each move differently, and reading them apart is the point of the sheet. Affiliate income is the steady climber, rising a little each month from $1,100 in January to $2,380 in December with no sudden jumps, the profile of a back catalogue earning quietly. Digital products swing with releases, ranging from $3,800 in February to $8,500 in December and dipping to $4,400 in June, so their line tracks launches rather than the calendar. Paid community rises in even steps from $2,400 to $4,600, the recurring shape of a membership that adds subscribers faster than it loses them. A creator watching only the combined total would see none of these; watching the five rows, the reason behind any given month is usually sitting in one of them.
One worked month makes the build concrete. October is the peak at $42,000, and it is not one source having a good month but all five stacking: platform ads $7,400, sponsorships $22,000, affiliate $2,000, digital products $6,400, and paid community $4,200. Add those and the month total is $42,000, with no cell typed twice. That is the payoff of a single ledger: the month figure, the source total, the year total, and the dashboard chart are all the same numbers read from different directions, so they cannot drift apart.
Below the five named sources sit three blank rows. They already carry the sum formulas and already sit inside the year total, the dashboard KPIs, and both charts. Naming one, say a consulting or licensing line, puts it straight into every figure above with nothing to drag or extend. Past those three, inserting a row between two existing ones keeps the ranges stretching with it.
Size each channel: the Channels sheet
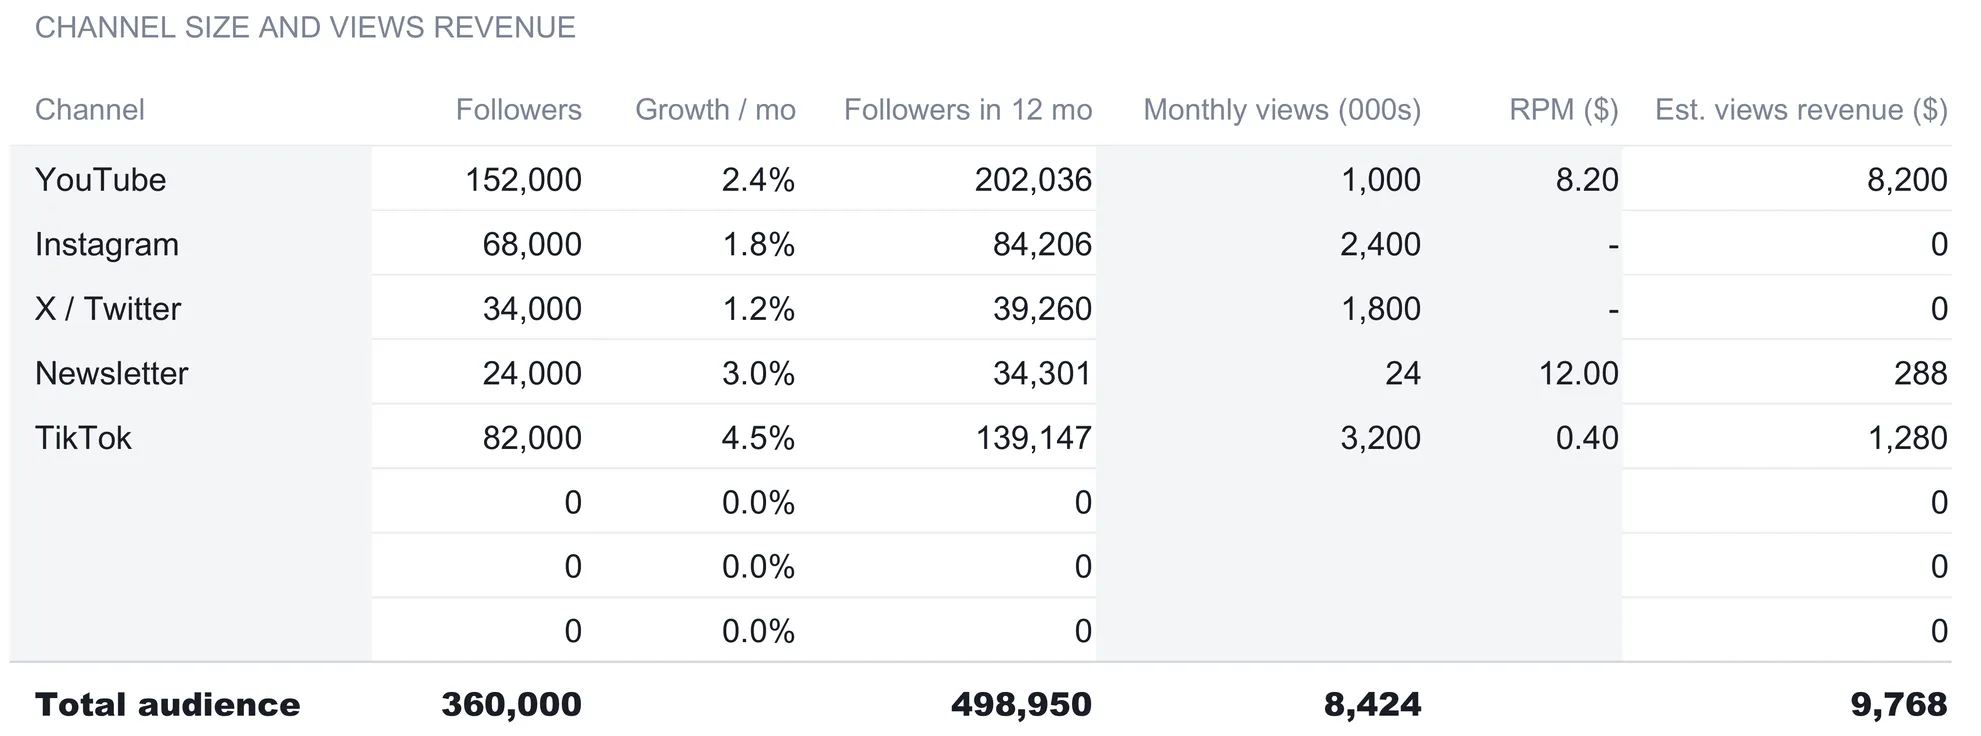
Where Revenue Streams records money, the Channels sheet sizes the platforms behind it and estimates the part of income that comes purely from views. Each channel row carries its follower count, a monthly growth rate, a twelve-month follower projection, monthly views in thousands, an RPM, and an estimated views revenue.
| Channel | Followers | Growth / mo | Followers in 12 mo | Monthly views (000s) | RPM ($) | Est. views revenue ($) |
|---|---|---|---|---|---|---|
| YouTube | 152,000 | 2.4% | 202,036 | 1,000 | 8.20 | 8,200 |
| 68,000 | 1.8% | 84,206 | 2,400 | 0 | 0 | |
| X / Twitter | 34,000 | 1.2% | 39,260 | 1,800 | 0 | 0 |
| Newsletter | 24,000 | 3.0% | 34,301 | 24 | 12.00 | 288 |
| TikTok | 82,000 | 4.5% | 139,147 | 3,200 | 0.40 | 1,280 |
| Total audience | 360,000 | 498,950 | 8,424 | 9,768 |
Two of those columns are not typed here at all. The follower count and the growth rate are read from the Audience sheet, so a channel is only ever counted once and its size always agrees with its own trend. The twelve-month projection then compounds the current followers forward at that monthly growth rate, which is how YouTube’s 152,000 at 2.4 percent a month becomes a projected 202,036.
The estimated views revenue is the honest, narrow number on this sheet. It multiplies monthly views in thousands by the RPM, so YouTube’s 1,000 (that is a thousand thousands, a million views) at an 8.2 RPM estimates $8,200, the newsletter’s 24 thousand sends at a 12.0 RPM estimates $288, and TikTok’s 3,200 at 0.40 estimates $1,280. Instagram and X carry a zero RPM in the sample, which reflects channels a creator keeps for reach rather than direct pay. The total views revenue of $9,768 deliberately does not roll into the year total, which is built from Revenue Streams alone. The sheet’s own note is explicit that views times RPM is the views-driven part of a channel only, and that sponsorships, product sales, and community income live on Revenue Streams, so the figure stays an estimate rather than a second copy of income already logged there.
The subscriber trend behind the channels: the Audience sheet
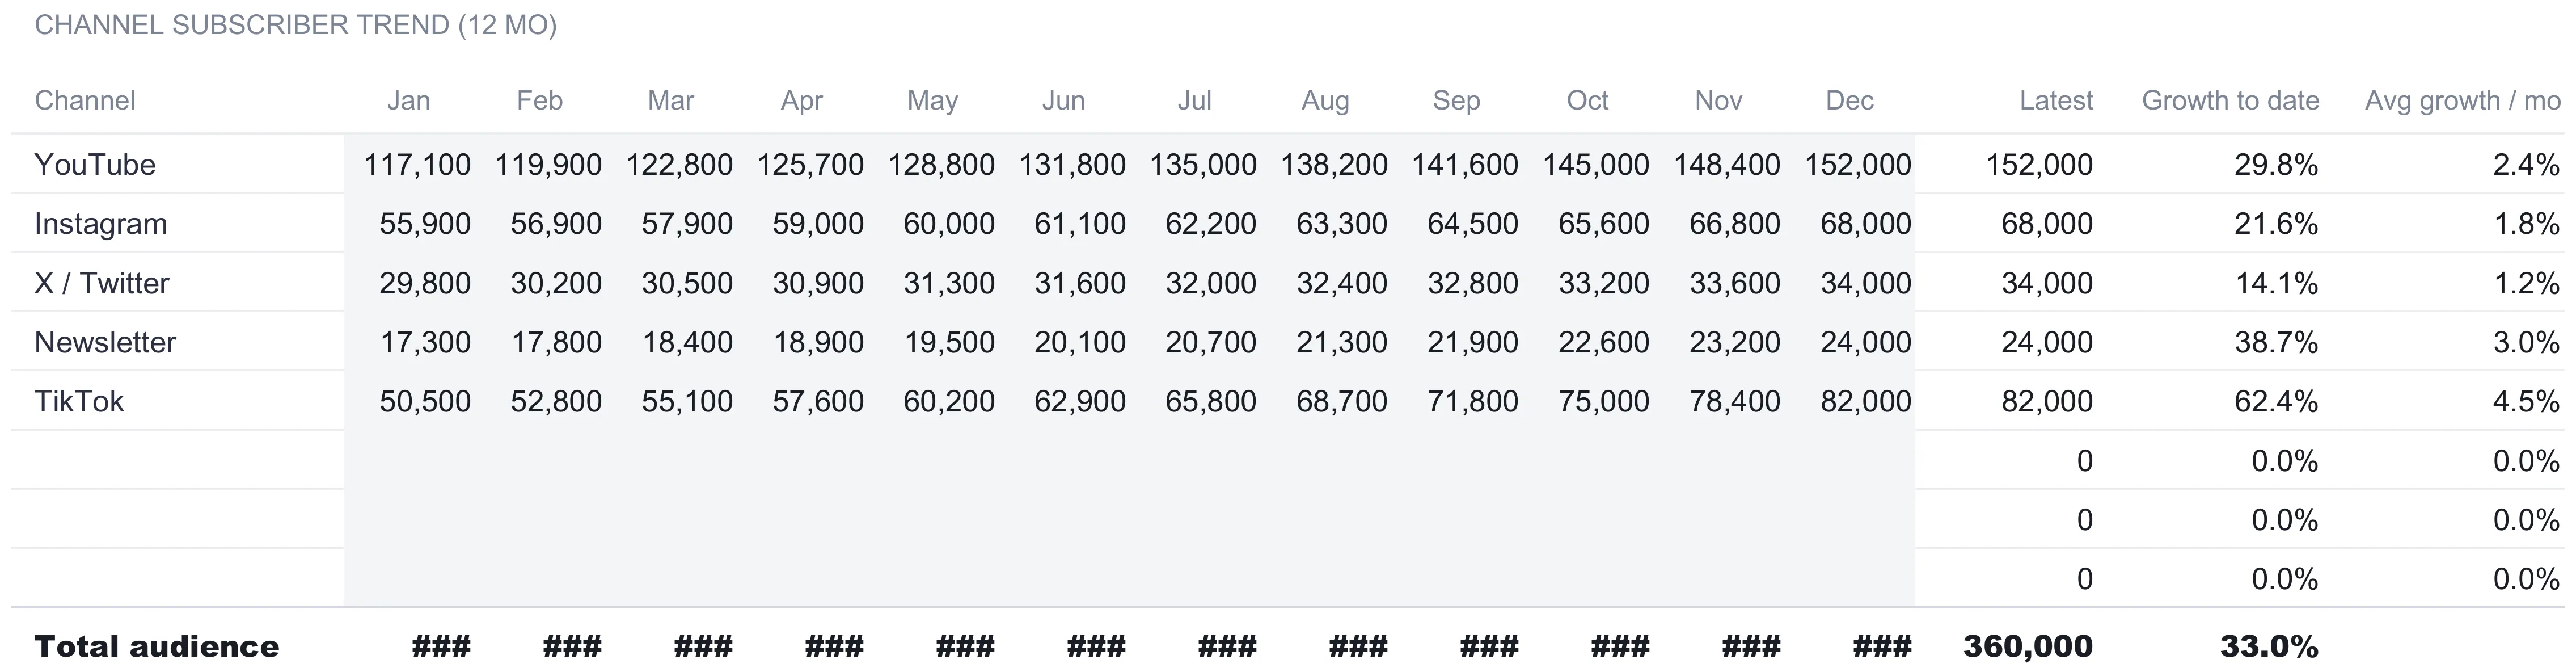
The follower counts on Channels have to come from somewhere, and that somewhere is the Audience sheet. Each channel gets twelve monthly subscriber snapshots, January to December, and from those the sheet derives three figures: the latest count, growth to date, and average growth per month.
The sample fills all twelve months, so the latest column simply reads December: YouTube 152,000, Instagram 68,000, X / Twitter 34,000, Newsletter 24,000, and TikTok 82,000. Those are the exact numbers the Channels sheet pulls back as followers, which is why the two sheets can never disagree.
Growth to date compares the latest month with the first, and it separates the channels that a raw follower count would flatten together. TikTok climbs from 50,500 in January to 82,000 in December, a 62.4 percent gain, the fastest mover in the file even though YouTube is nearly twice its size. YouTube itself grows 29.8 percent, the newsletter 38.7 percent, Instagram 21.6 percent, and X the slowest at 14.1 percent. Across every channel the total audience rises from 270,600 in January to 360,000 in December, a 33.0 percent gain for the year.
Average growth per month is the geometric monthly rate, the steady month-over-month percentage that would carry the first month’s count to the latest across the eleven steps between them. It is the figure Channels borrows to project followers forward, and it is why TikTok’s 4.5 percent a month adds more followers over the twelve-month projection than YouTube’s 2.4 percent does, 57,147 against 50,036, despite TikTok starting smaller.
Filling this sheet left to right each month is the one recurring habit the tracker asks for. The latest column is defined as the last month holding a number, so a half-filled year still reports correctly, with growth to date measured back to January either way.
Weigh the future: the Sponsors sheet
Sponsorships were the biggest revenue line, so the tracker gives the deal flow behind them its own sheet. Each deal on the Sponsors sheet has a sponsor name, a stage, a value, and an air date, plus a weighted figure the sheet computes.
| Sponsor | Stage | Value ($) | Air date | Weighted ($) |
|---|---|---|---|---|
| Acme Co. | Booked | 18,000 | 2026-09-22 | 18,000 |
| Beta Brands | Booked | 14,000 | 2026-10-15 | 14,000 |
| Cedar Software | Negotiating | 22,000 | 2026-11-10 | 14,300 |
| Delta Apps | Proposal | 16,000 | 2026-11-25 | 5,600 |
| Echo Audio | Lead | 12,000 | 1,200 | |
| Foxtrot Finance | Lead | 20,000 | 2,000 | |
| Granite Gear | Lost | 8,000 | 0 | |
| Totals (7 deals) | 110,000 | 55,100 |
The weighted column is the point of the sheet. Below the pipeline sits a small stage-probability table: lead 10 percent, proposal 35 percent, negotiating 65 percent, booked 100 percent, and lost 0 percent. Each deal’s weighted value is simply its value multiplied by the probability of its stage. Cedar Software’s $22,000 in negotiating weights to $14,300, Delta Apps’ $16,000 proposal to $5,600, and the two leads to a tenth of their face value. Granite Gear, marked lost, weights to zero. The seven deals total $110,000 at face value but $55,100 once weighted, and that weighted figure is the realistic pipeline number the dashboard reports.
That probability table is editable, and every weighted figure follows it. A creator who finds that their proposals close nearer half the time than a third can change the proposal probability to 50 percent, and the pipeline reweights instantly across every deal and the dashboard. The stages are a plain vocabulary rather than advice about which deals to chase.
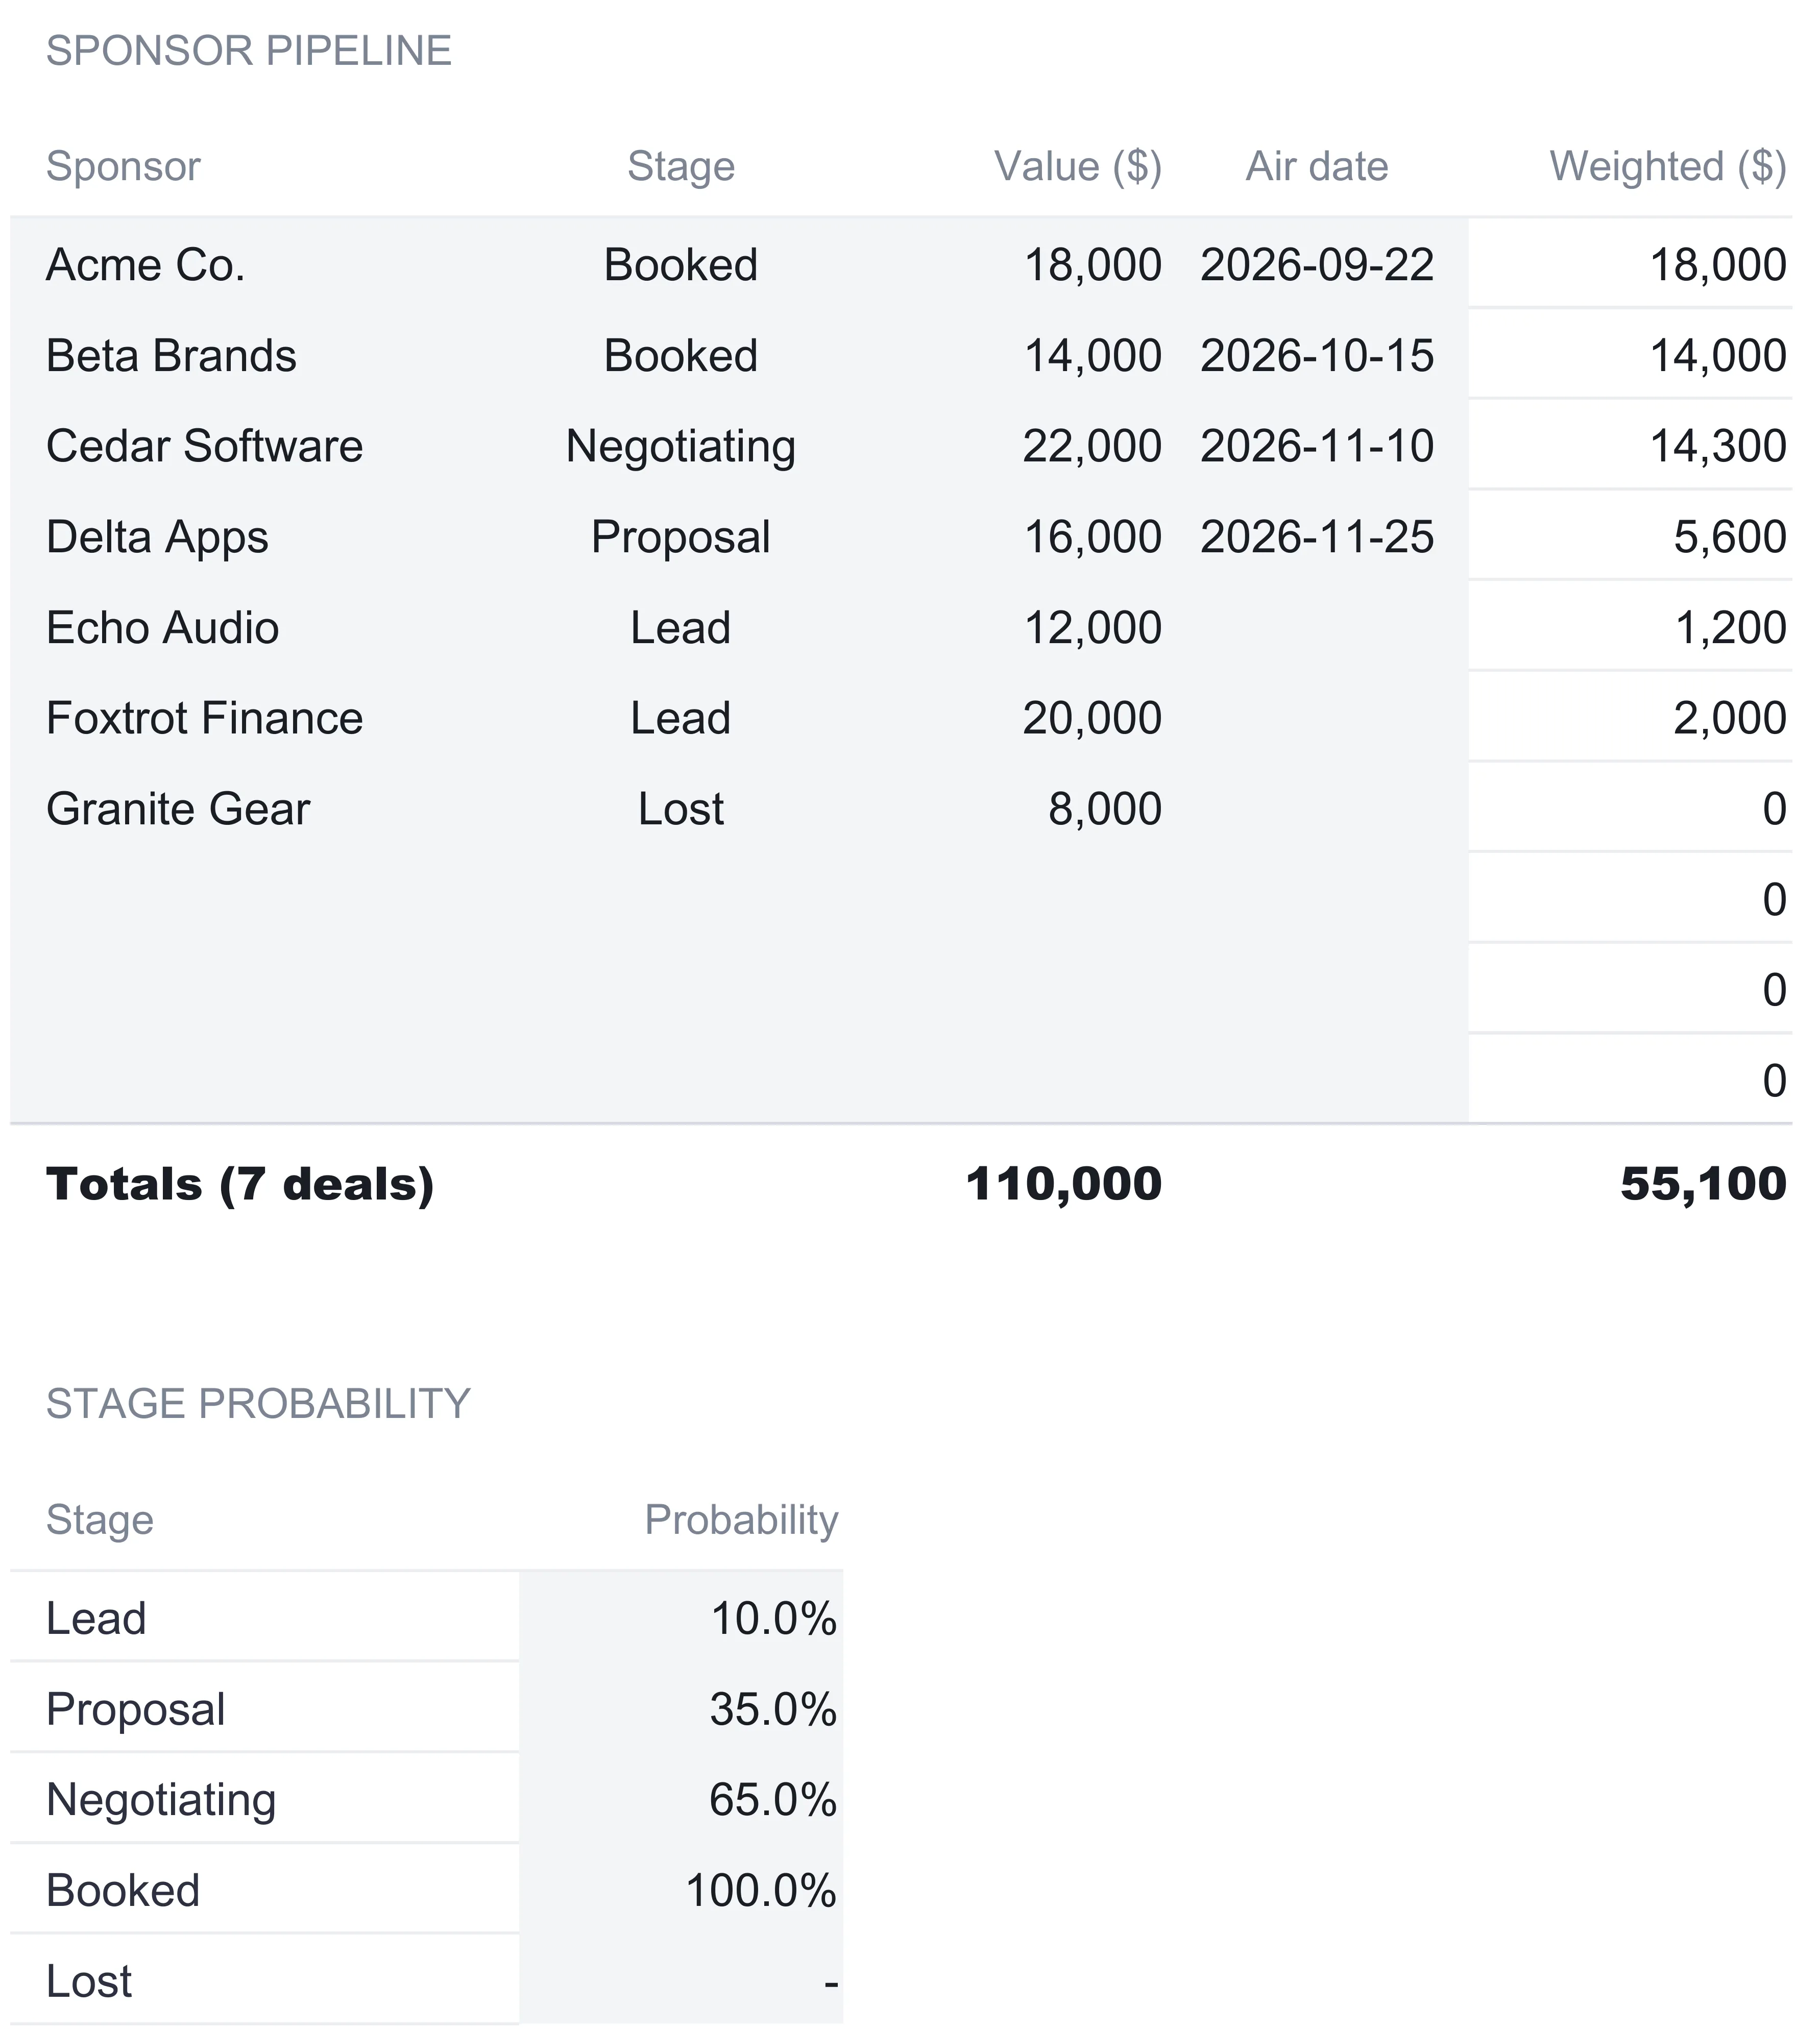
The air date does a second job. The dashboard counts a booked deal toward the year only if its air date falls inside the year set on Settings, so a booked deal with no date stays out of that figure until one is entered. In the sample, Acme Co. and Beta Brands are the two booked deals with 2026 air dates, which is why the dashboard’s booked-this-year figure is $32,000 rather than the full weighted pipeline.
How the six sheets fit together
How these sheets connect is the wiring that keeps a multi-source tracker from turning into six spreadsheets that disagree. Settings holds the year and the currency that scope and label everything. Revenue Streams is the only place income is typed by source, and its year total is the dashboard’s headline. Audience holds the monthly follower snapshots, Channels reads its latest follower count and growth rate from Audience so a channel is named and counted once, and the views-revenue estimate stays fenced off from the year total on purpose. Sponsors runs its own pipeline, and only its booked deals with an in-year air date reach the dashboard’s booked figure. The dashboard itself types nothing; it reads back. That one-directional flow puts entries on the four data sheets and the three Settings fields, with calculations everywhere else. It is the discipline that lets the year total, the monthly chart, and the source breakdown agree, because they are the same numbers viewed from different angles.
The dashboard: eight numbers and a status line
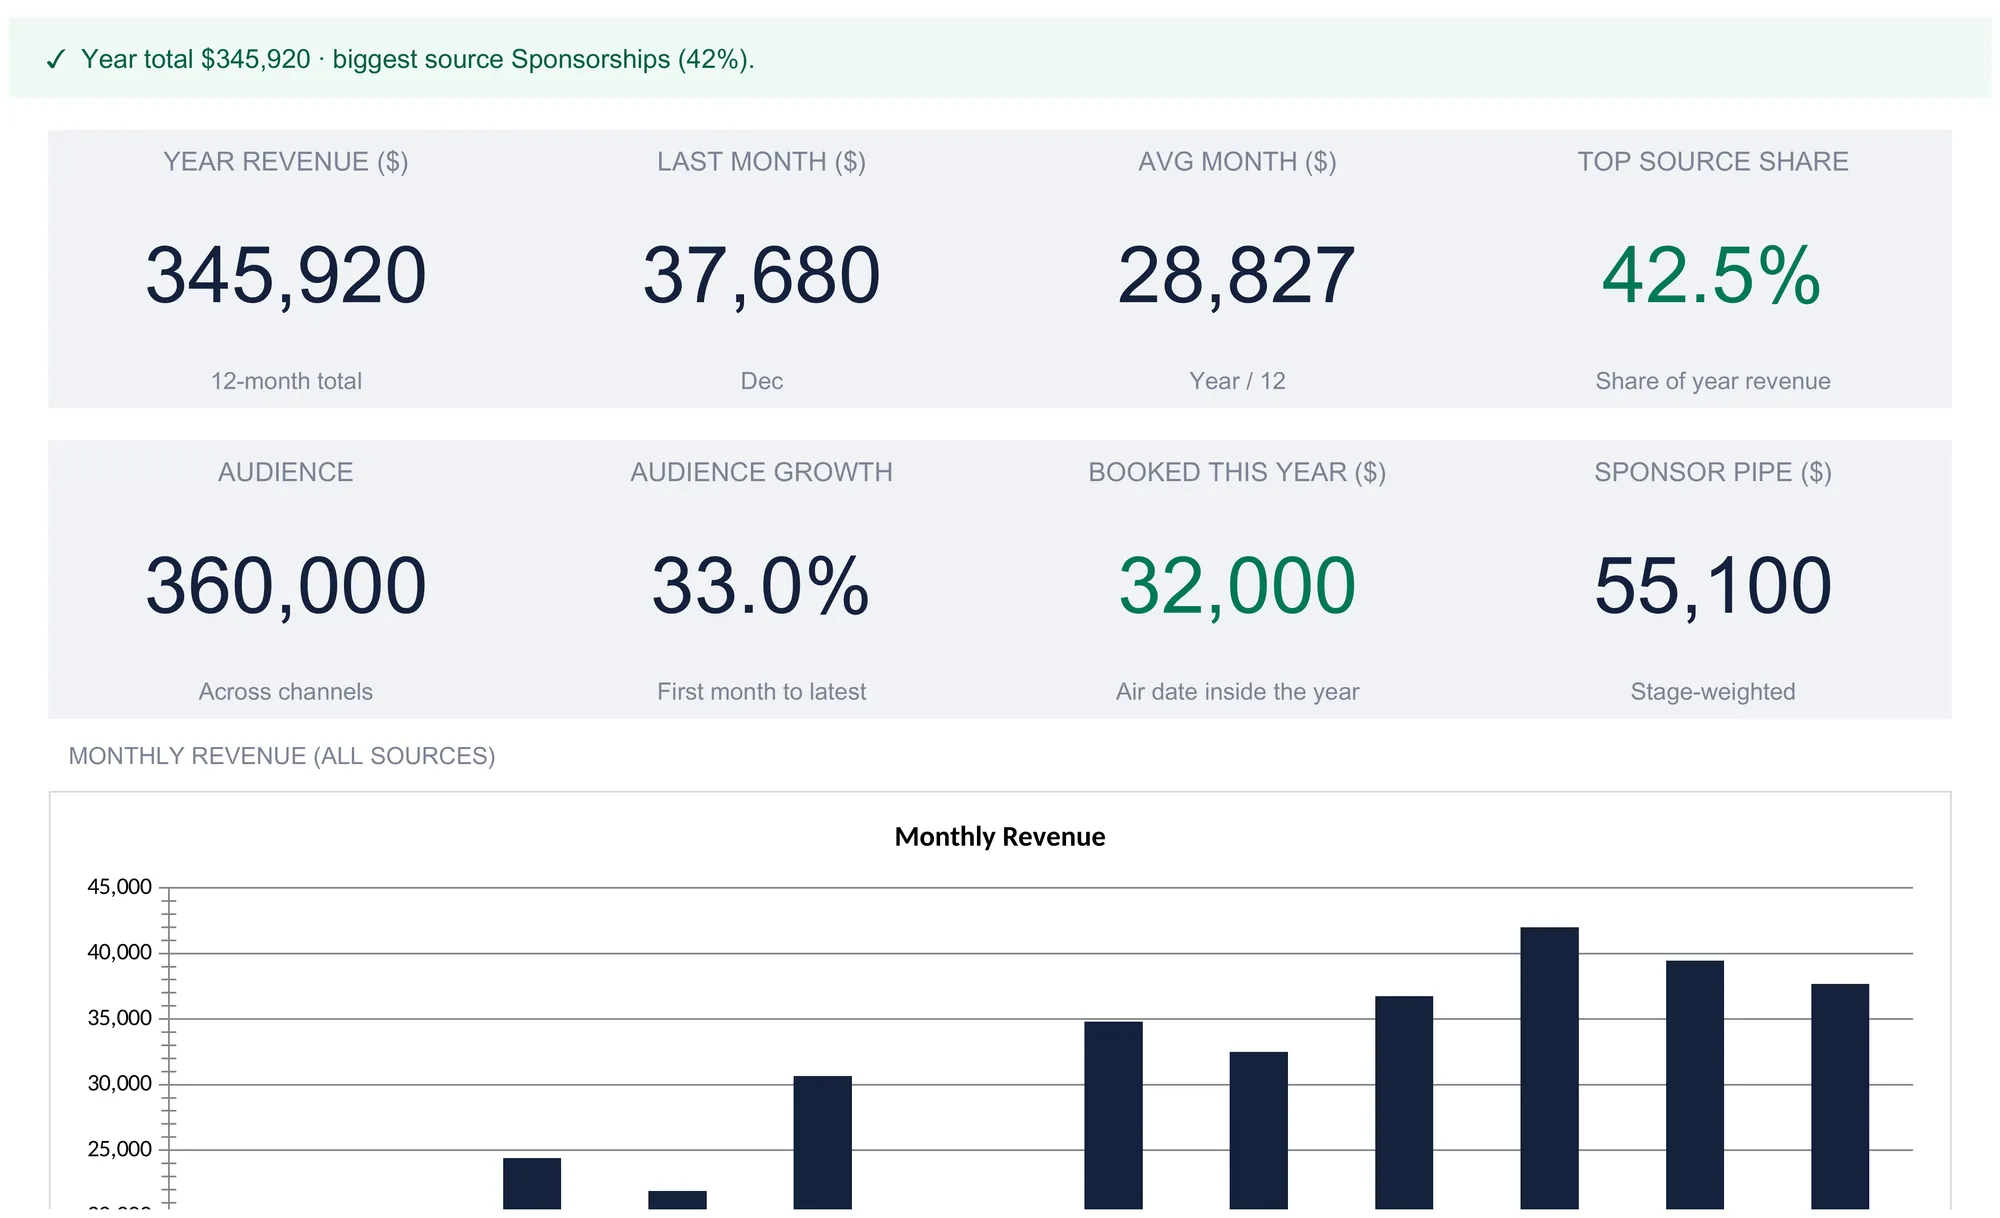
With the four data sheets filled, the dashboard computes the year and states it in one line across the top. The eight KPI tiles read:
| Metric | Sample value | How it is derived |
|---|---|---|
| Year revenue | 345,920 | Sum of every source’s year total |
| Last month | 37,680 | December on Revenue Streams |
| Average month | 28,827 | Year revenue ÷ 12 |
| Top source share | 42.5% | Largest source ÷ year revenue |
| Audience | 360,000 | Total latest followers across channels |
| Audience growth | 33.0% | First month to latest, all channels |
| Booked this year | 32,000 | Booked deals with an air date inside the year |
| Sponsor pipe | 55,100 | Stage-weighted value of all deals |
The status line above the tiles reads the year in a sentence: “Year total $345,920 - biggest source Sponsorships (42%).” It names the largest line automatically, so the moment a different source overtakes sponsorships the sentence updates on its own. The top source share tile carries the same idea as a number, 42.5 percent, which is a quiet measure of concentration risk: a business leaning 42 percent on one source reads differently from one spread evenly, and the tile puts that on the first screen.
The last-month and average-month tiles sit next to each other for a reason. Last month reads December at $37,680, while the average month across the year is $28,827, so the recent month is running well above the twelve-month pace. Seeing both at once separates a strong finish from a typical one without any mental arithmetic, and because both are read from the same ledger, a correction to any month updates both tiles together.
Below the tiles, a monthly revenue chart plots all sources combined across the twelve months, where October’s $42,000 peak and February’s $11,450 trough are visible at a glance, and a second chart breaks the year down by source. The two rows of tiles above them are grouped by intent: the top four report what came in, while the bottom four pair audience size and growth with the booked and stage-weighted sponsor figures, so what drives the business sits alongside what is still coming.
RPM, weighted pipeline, and growth in plain terms
Three ideas on this workbook carry a little jargon, and each is a plain calculation once unpacked.
RPM is revenue per thousand views or sends. Google’s own definition is that RPM represents total revenue after its revenue share per thousand views, which is exactly how the Channels sheet uses it: monthly views in thousands times the RPM gives the views-driven revenue (1,000 × $8.20 = $8,200 for YouTube). It is deliberately a partial number here, covering views income only, because everything else a channel earns is recorded on Revenue Streams.
Weighted pipeline is deal value times the probability of its stage. A $22,000 negotiating deal at 65 percent is worth $14,300 in planning terms ($22,000 × 0.65), which is more honest than counting the full $22,000 that has not closed or ignoring it entirely. Summed across the pipeline, the weighting turns $110,000 of face value into a $55,100 expectation.
Growth to date and average growth per month are two views of the same trend. Growth to date is the plain change from the first month to the latest (TikTok’s 50,500 to 82,000 is a 62.4 percent gain). Average growth per month is the steady monthly rate that would produce that same change compounded over the months between, which is the rate the follower projection runs forward. One answers how far the channel has come; the other answers how fast, in a form you can project.
Excel or Google Sheets for a creator revenue tracker
The tracker is an .xlsx file built on plain formulas, with no macros and no add-ons, so it runs identically in Microsoft Excel and in Google Sheets after upload. Google Sheets suits a creator who updates follower counts from a phone or shares the file with a manager; Excel suits those who prefer a local file. Both are genuinely supported, and the structure described here, one ledger by source with derived channel, audience, and pipeline views, is equally buildable by hand in either.
Which template fits which creator
- Creator Revenue Tracker Spreadsheet Template ($29) is the workbook this walkthrough follows: revenue by source, channel size and RPM-based views income, the subscriber trend, the stage-weighted sponsor pipeline, and the eight-metric dashboard, ready for a single creator business.
- Course Launch P&L Spreadsheet Template ($39) picks up where an ongoing revenue tracker stops, at the economics of a specific launch: the ad spend, refunds, and returns on a course or product push rather than the year-round mix of streams. A creator who sells digital products alongside sponsorships often runs both, one for the steady business and one for the campaigns inside it.
Related
- How to Calculate a Consulting Rate in a Spreadsheet - the rate-and-capacity math for a solo creator who also takes client work
- How to Track Business Taxes in a Spreadsheet - keeping categorized income and expenses ready for filing across multiple sources
- Spring Sprint: Business Spreadsheet Templates - where the creator, freelancer, and agency templates sit in the wider lineup
Frequently asked questions
What counts as creator revenue in this tracker?
Anything a creator business earns in a month. The Revenue Streams sheet ships with five sample sources named platform ads, sponsorships, affiliate, digital products, and paid community, and each has a row across the twelve months. The views-revenue estimate on the Channels sheet is separate and is not added into the year total, because sponsorships, product sales, and community income already sit on Revenue Streams. Three blank source rows are pre-wired for anything else, so a new line such as consulting or licensing starts counting the moment it is named.
What is RPM and how is the views revenue estimated?
RPM is revenue per thousand views or sends. On the Channels sheet, monthly views in thousands multiplied by the RPM gives the views-driven part of a channel, so the YouTube row of 1,000 (thousand views) at an 8.2 RPM estimates $8,200. Google states that RPM represents total revenue after its revenue share per thousand views. The estimate covers only the views-driven slice; a channel's sponsorship and product income is recorded on Revenue Streams instead, so the two are never double-counted.
How does the stage-weighted sponsor pipeline work?
Each deal on the Sponsors sheet has a stage, and a small editable table assigns a probability to each stage: lead 10 percent, proposal 35 percent, negotiating 65 percent, booked 100 percent, and lost 0 percent. The weighted figure is the deal value multiplied by its stage probability, so a $22,000 deal in negotiating shows $14,300. Editing any probability updates every weighted figure and the dashboard pipeline total, which reads $55,100 in the sample.
Why doesn't booked this year match my full pipeline?
They answer different questions. The dashboard pipeline of $55,100 is the stage-weighted value of every open and booked deal. Booked this year, $32,000 in the sample, sums only deals marked booked whose air date falls inside the year set on Settings. A booked deal with no air date stays out of that figure until a date is entered, which keeps the year number tied to work that actually airs in the tracked year.
Can I add my own revenue streams and channels?
Yes. Revenue Streams, Channels, Audience, and Sponsors each ship with three blank rows at the bottom of their list, already inside the totals and the dashboard figures above them, so naming one starts it counting with nothing to edit. On Revenue Streams those rows also sit inside both dashboard charts. Past those three, inserting a row between two existing rows rather than typing below the last one lets the ranges stretch with it. A channel is named once on the Channels sheet, and the Audience sheet mirrors that name for its monthly snapshots.
Sources
- RPM basics - YouTube Help (Google)
About this article
Sheets, inputs, sample figures and formulas checked on 2026-09-10 against the shipped Creator Revenue Tracker workbook, the exact file customers download (Dashboard, Revenue Streams, Channels, Sponsors, Audience, Settings and How to Use). The RPM definition was re-checked against the live YouTube Help page on 2026-09-10. Last reviewed September 2026.