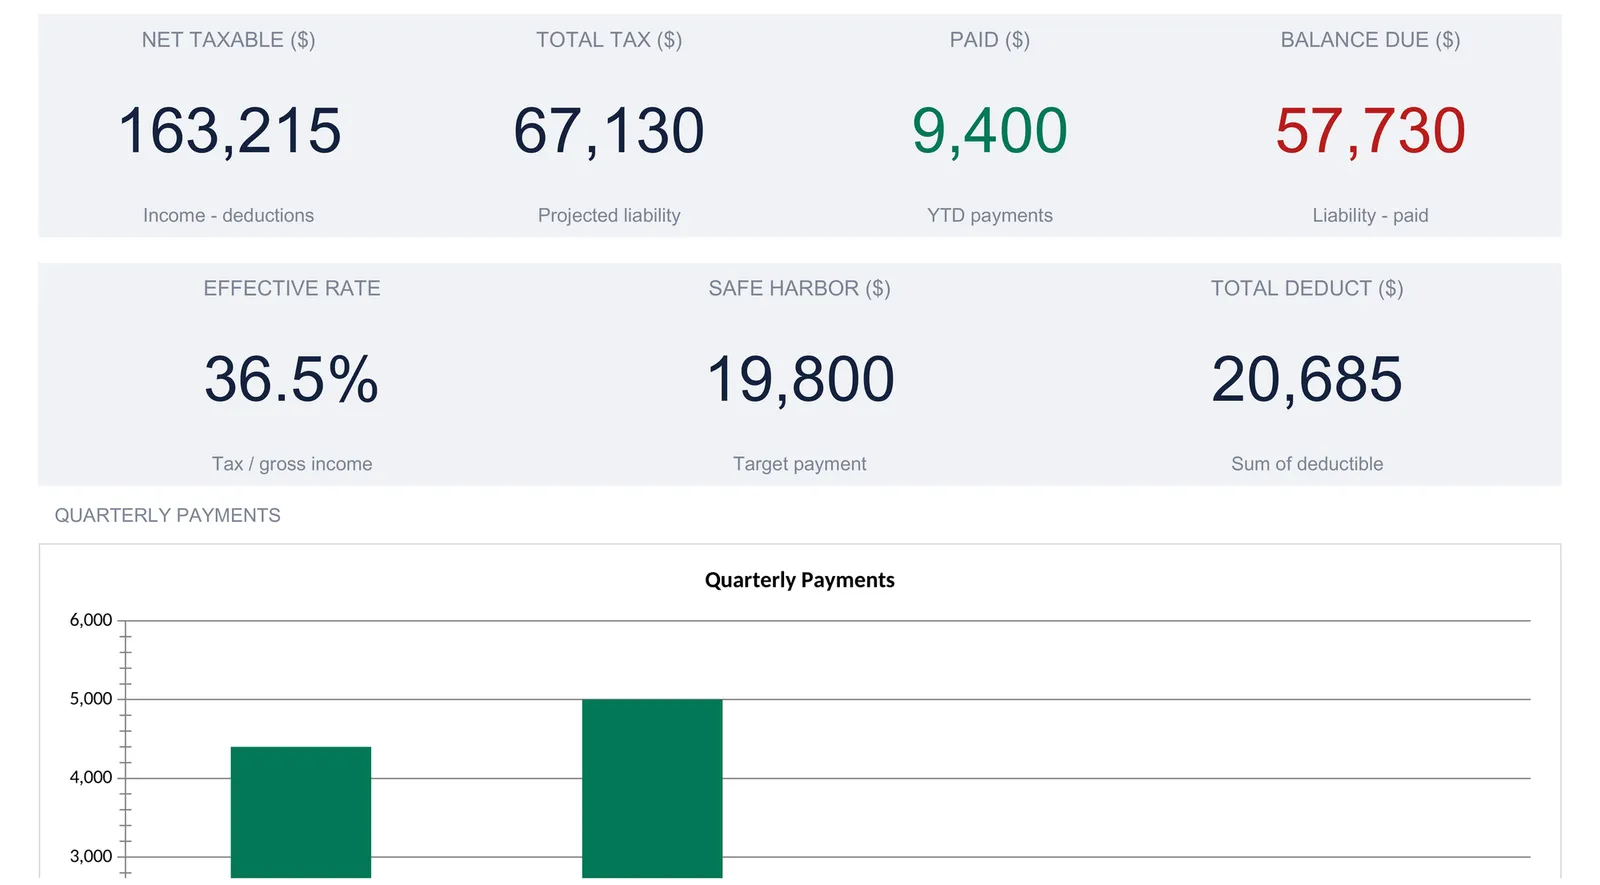
A business tax tracker keeps income, deductible expenses, and quarterly estimated tax payments in one workbook, then derives net taxable income, a projected liability, and the balance still owed. This walkthrough covers the full structure with a worked example: a consulting business with $183,900 of gross income, $20,685 in deductions, $163,215 net taxable, and $9,400 paid against a projected liability. Our Business Tax Tracker ($29) ships the same structure ready-made for Excel and Google Sheets. Every rate in the file is an adjustable sample, and every tax judgment belongs with a qualified professional.
A small business generates two streams of tax-relevant data all year, and they almost never live in the same place. Income arrives as invoices and deposits. Deductible costs arrive as receipts and card statements. Then, four times a year, an estimated tax payment goes out against a number nobody has actually totaled yet. Most owners can say what landed in the bank last month. Far fewer can say, in September, whether the payments made so far are on track for the year or well behind. The gap between those two positions is structure, and a spreadsheet closes it.
The structure here is five moving parts: a set of tax constants, an income log, a deductions log, a record of quarterly payments, and a summary that turns all of it into a projected liability. The examples below come from our Business Tax Tracker Spreadsheet Template ($29), which ships the whole thing built for Excel and Google Sheets. The layout is reproducible by hand if you would rather build your own, and every number in this walkthrough is read straight from the sample data in that file.
One point sits above everything that follows. This workbook is a planning tool, not a tax return, and it does not decide anything about your taxes. It records what you type, applies rates you can change, and shows the arithmetic. What counts as a deduction, which rate applies to you, and when a payment is due are all questions for a qualified tax professional. The figures below are the file’s sample data, present so the mechanics are concrete.
What a business tax tracker has to hold
Strip away the software and there are only five kinds of data a year-round tax picture needs:
- Tax constants. The rates and thresholds that apply to every calculation: a federal rate, a state rate, the self-employment tax components, and the safe-harbor inputs. These are set once and rarely touched.
- Income. Every revenue source, month by month, so the annual gross is a total and not a guess.
- Deductible expenses. Costs by category, month by month, each carrying its own deductible percentage so a category that is only partly deductible is not overstated.
- Quarterly payments. What was actually sent to federal and state for each estimated-tax quarter, with the due dates alongside.
- A summary and a dashboard. The derived layer: net taxable income, a projected liability broken into its parts, the balance still owed, and a handful of indicators. Nothing here is typed; it is all computed from the four input areas.
The tracker gives each of these its own sheet: Settings, Income, Deductions, Quarterly Payments, and Tax Summary, with a Dashboard on top and a How to Use sheet carrying the instructions. Seven tabs in all. The How to Use sheet describes each tab in a line and notes that the tinted cells are the ones you fill in while the tax amounts and totals are formulas. The walkthrough below follows the order the data flows: Settings, then Income, then Deductions, then Quarterly Payments, with Tax Summary and the Dashboard read last.
Start with the constants: the Settings sheet
Everything downstream reads its rates from Settings, so this sheet comes first. It is short, and the tinted cells are the only ones anyone fills in.
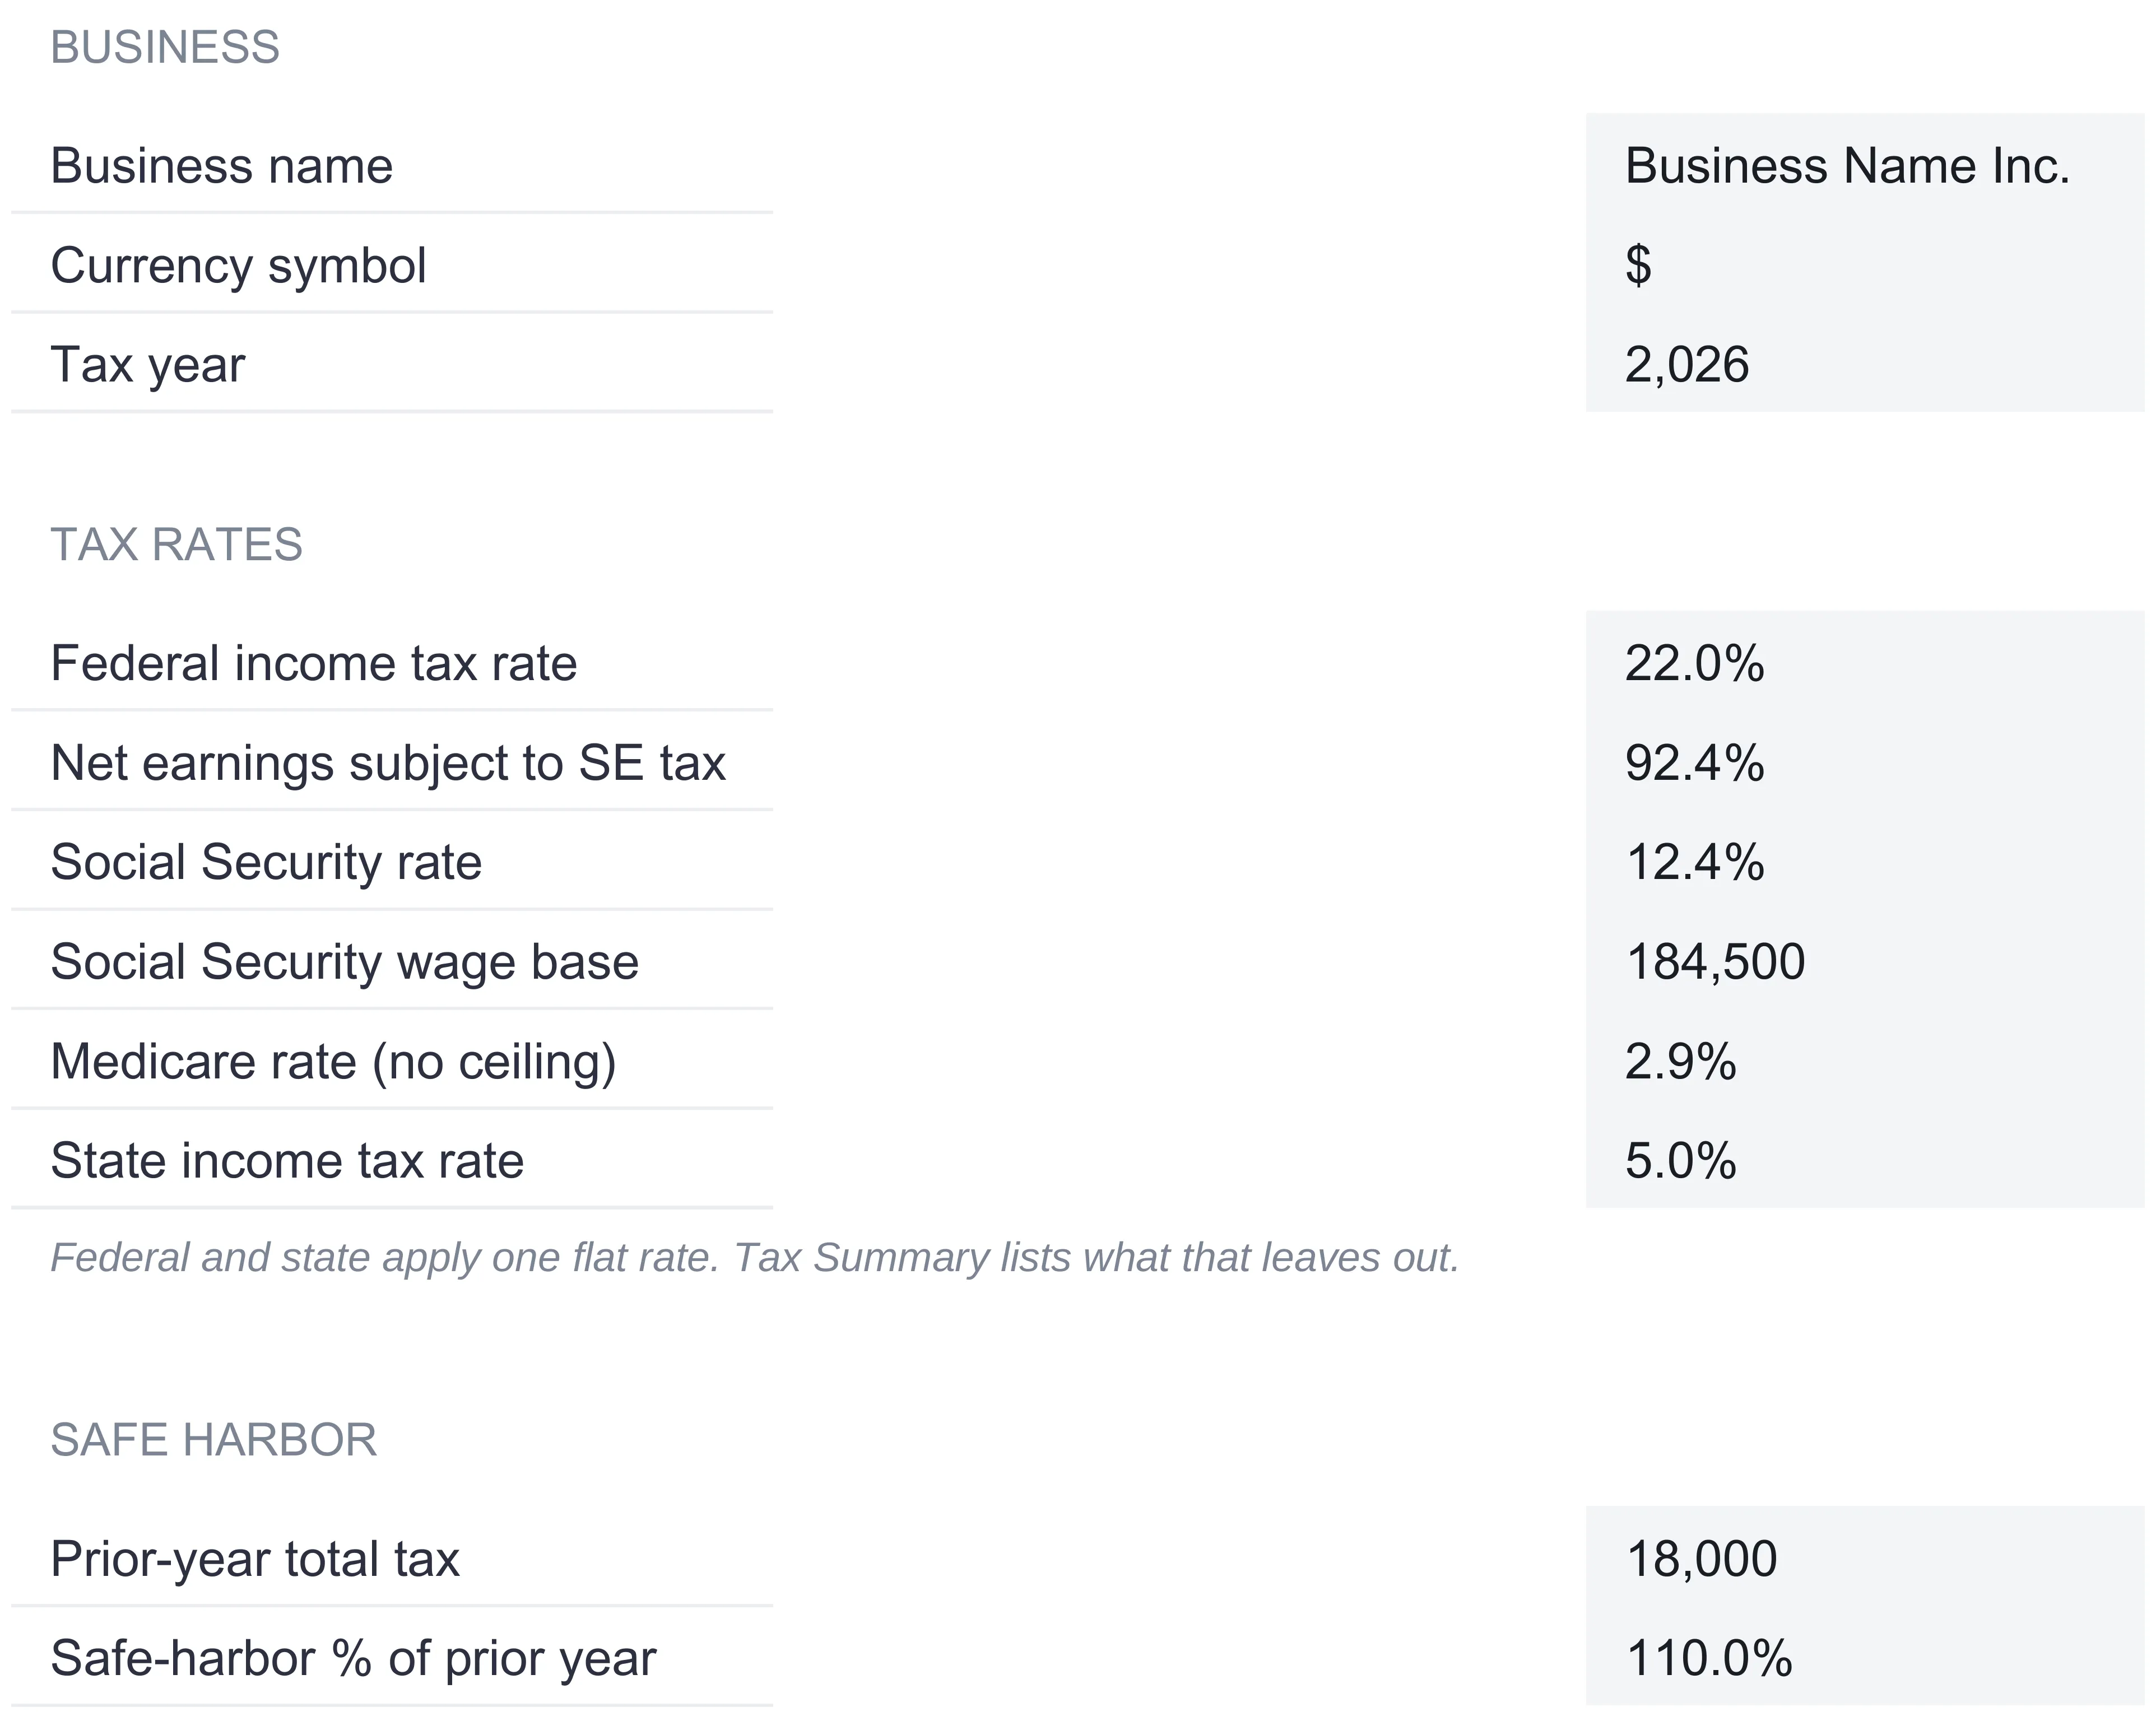
The Business block holds three items: a business name, a currency symbol, and a tax year. The sample carries “Business Name Inc.”, a dollar symbol, and 2026. The business name and tax year flow into the header of every other sheet, so setting them once labels the whole workbook.
The Tax rates block is the engine. The sample values are:
- Federal income tax rate, 22 percent
- Net earnings subject to SE tax, 92.35 percent
- Social Security rate, 12.4 percent
- Social Security wage base, 184,500
- Medicare rate (no ceiling), 2.9 percent
- State income tax rate, 5 percent
A note directly under the block is worth reading twice: federal and state apply one flat rate, and the Tax Summary sheet lists what that leaves out. In plain terms, these are placeholders. They are round, adjustable stand-ins that make the arithmetic run, not a claim about what any business owes. The self-employment components mirror the structure the IRS describes on its self-employment tax page, where the 12.4 percent Social Security part and the 2.9 percent Medicare part make up the combined rate, but the exact numbers here are the file’s samples and are meant to be changed.
The Safe harbor block holds two more inputs: a prior-year total tax, 18,000 in the sample, and a safe-harbor percentage of that prior year, 110 percent. Those two feed the safe-harbor target the dashboard watches. The Settings note is candid that the share which actually applies varies with income level, so the percentage is another adjustable placeholder rather than a rule the file is asserting.
One more control lives on this sheet. The currency symbol is a dropdown of 35 options, from the dollar and euro through to the rupee, real, and dozens more. Choosing one relabels every money column header and every dashboard tile across the workbook. It relabels only. The numbers themselves never convert, so a file switched from dollars to euros shows the same figures with a new symbol in front of them.
Log the money in: the Income sheet
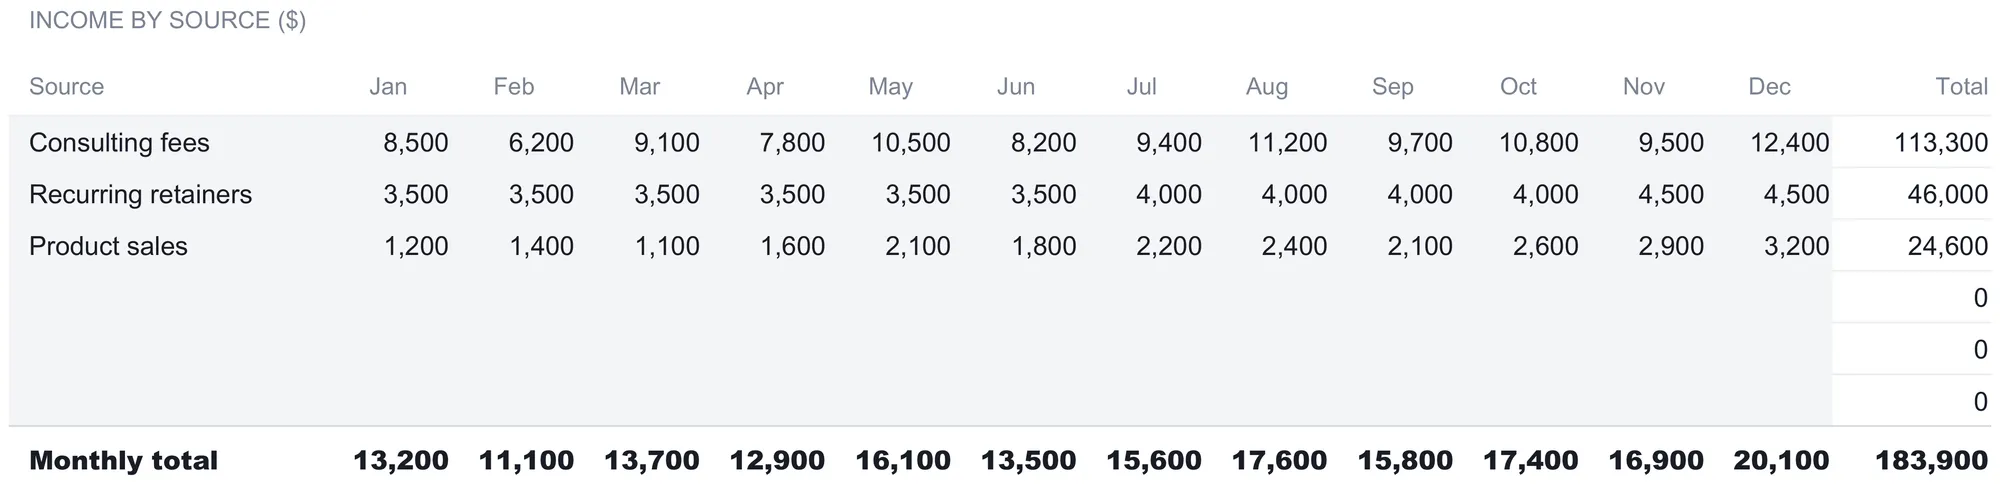
The Income sheet is a grid: one row per revenue source, one column per month from January to December, and a Total column on the right that sums the twelve months. The sample carries three named sources and three spare rows beneath them.
- Consulting fees, ranging from 6,200 in February to 12,400 in December, totaling 113,300 for the year
- Recurring retainers, stepping from 3,500 a month early in the year to 4,500 by December, totaling 46,000
- Product sales, climbing from 1,200 in January to 3,200 in December, totaling 24,600
A Monthly total row at the bottom adds every source within each month, and its own Total cell is the grand annual figure: 183,900. That single number is the gross income the rest of the workbook builds on. The three blank rows below the sample sources are already wired into every total, so naming one and typing amounts folds it in with no formula work. That is the design detail worth copying into any hand-built version, because the way these files usually break is a new source getting added to the list but left out of the sum.
What the Income sheet does not do is pull anything in on its own. There is no bank feed and no invoice import, so each month’s figures are typed. For a business already running dedicated bookkeeping, those monthly totals are a quick transcription from a report rather than a fresh reconstruction, which is one reason a tax tracker and a bookkeeping system sit well side by side rather than competing.
Log the money out: the Deductions sheet
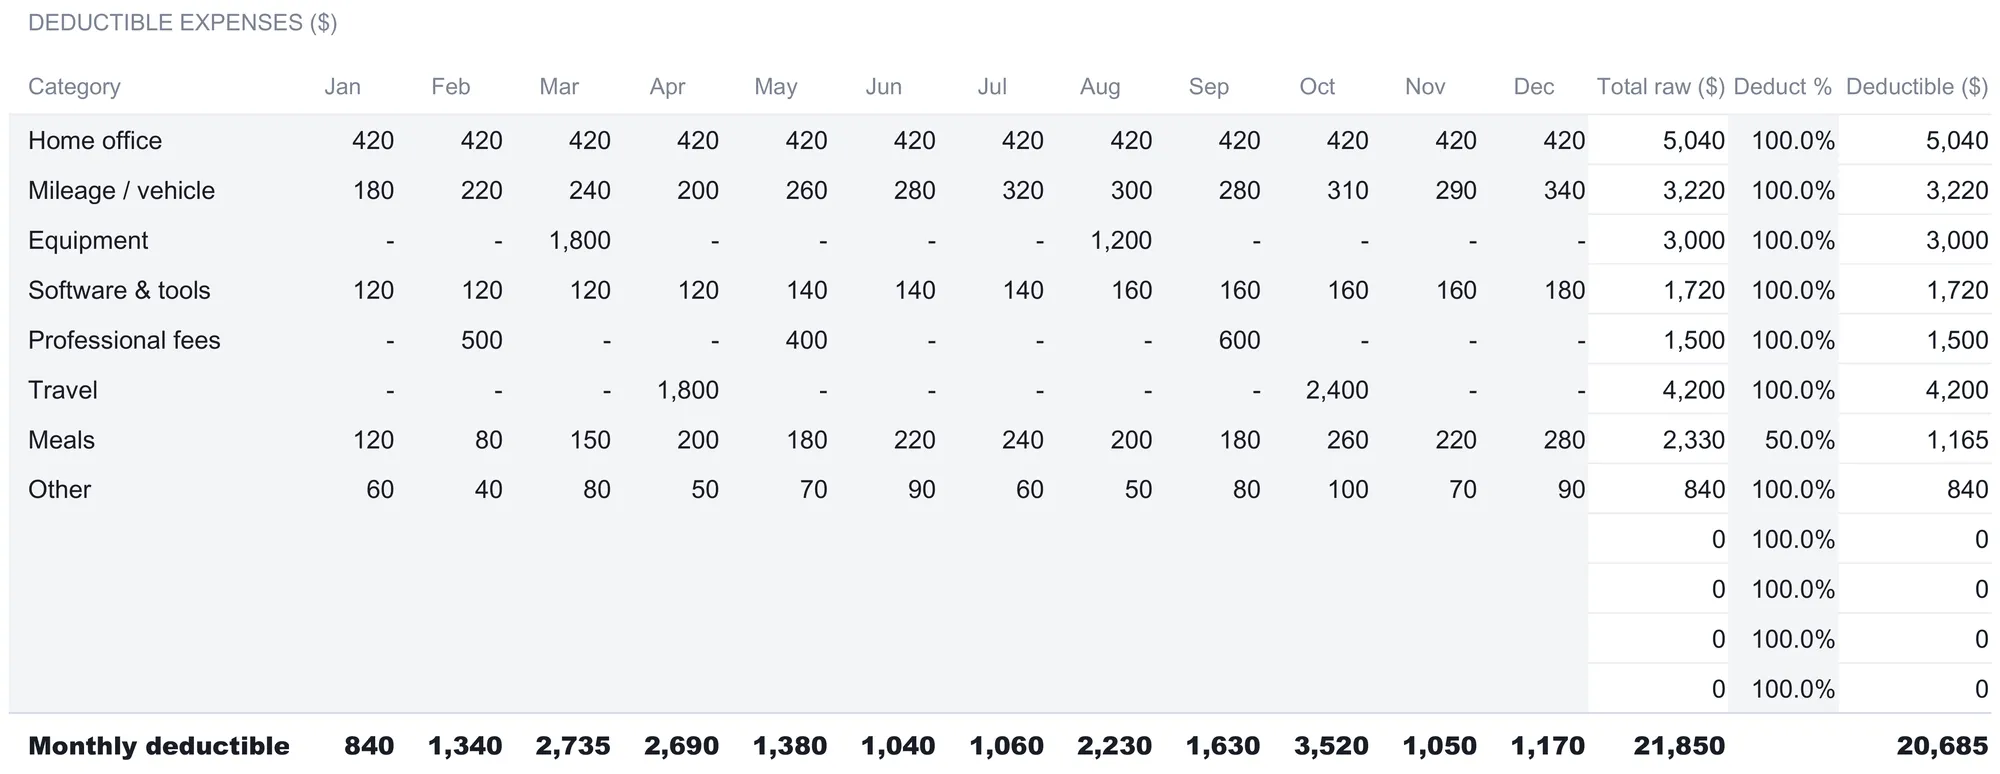
The Deductions sheet mirrors the income grid but adds a column that matters a great deal. Each category has its twelve monthly cells and a Total raw column, then a Deduct % column, then a Deductible column that multiplies the two. That middle percentage is the whole point: a cost can be fully counted, partly counted, or anything in between, and the sheet keeps the raw spend and the deductible portion visibly separate.
The sample lists eight categories:
| Category | Total raw ($) | Deduct % | Deductible ($) |
|---|---|---|---|
| Home office | 5,040 | 100% | 5,040 |
| Mileage / vehicle | 3,220 | 100% | 3,220 |
| Equipment | 3,000 | 100% | 3,000 |
| Software & tools | 1,720 | 100% | 1,720 |
| Professional fees | 1,500 | 100% | 1,500 |
| Travel | 4,200 | 100% | 4,200 |
| Meals | 2,330 | 50% | 1,165 |
| Other | 840 | 100% | 840 |
| Monthly deductible | 21,850 | 20,685 |
Meals is the row that shows the mechanism working. Its raw total is 2,330, but at a 50 percent deductible setting the deductible figure lands at 1,165. Every other sample category sits at 100 percent, so raw and deductible match. The raw column across all rows totals 21,850, while the deductible column totals 20,685, and that difference of 1,165 is exactly the half of meals the percentage carved off.
Two formulas drive the sheet. Each category’s deductible cell is its raw total times its own percentage. The Monthly deductible row uses a weighted sum across the month, so each month’s figure already reflects every category’s individual percentage rather than a flat haircut. The note on the sheet is explicit that the default percentages shown are just that, defaults, and that the deductibility of any category should be adjusted for your jurisdiction. The workbook is not asserting that meals are half deductible or that home office is fully deductible anywhere in particular. It is giving you a place to record whatever the correct treatment turns out to be, and that determination is a tax professional’s to make. Four spare rows sit below the eight categories, pre-wired into the totals and into the dashboard chart.
Record the payments: the Quarterly Payments sheet
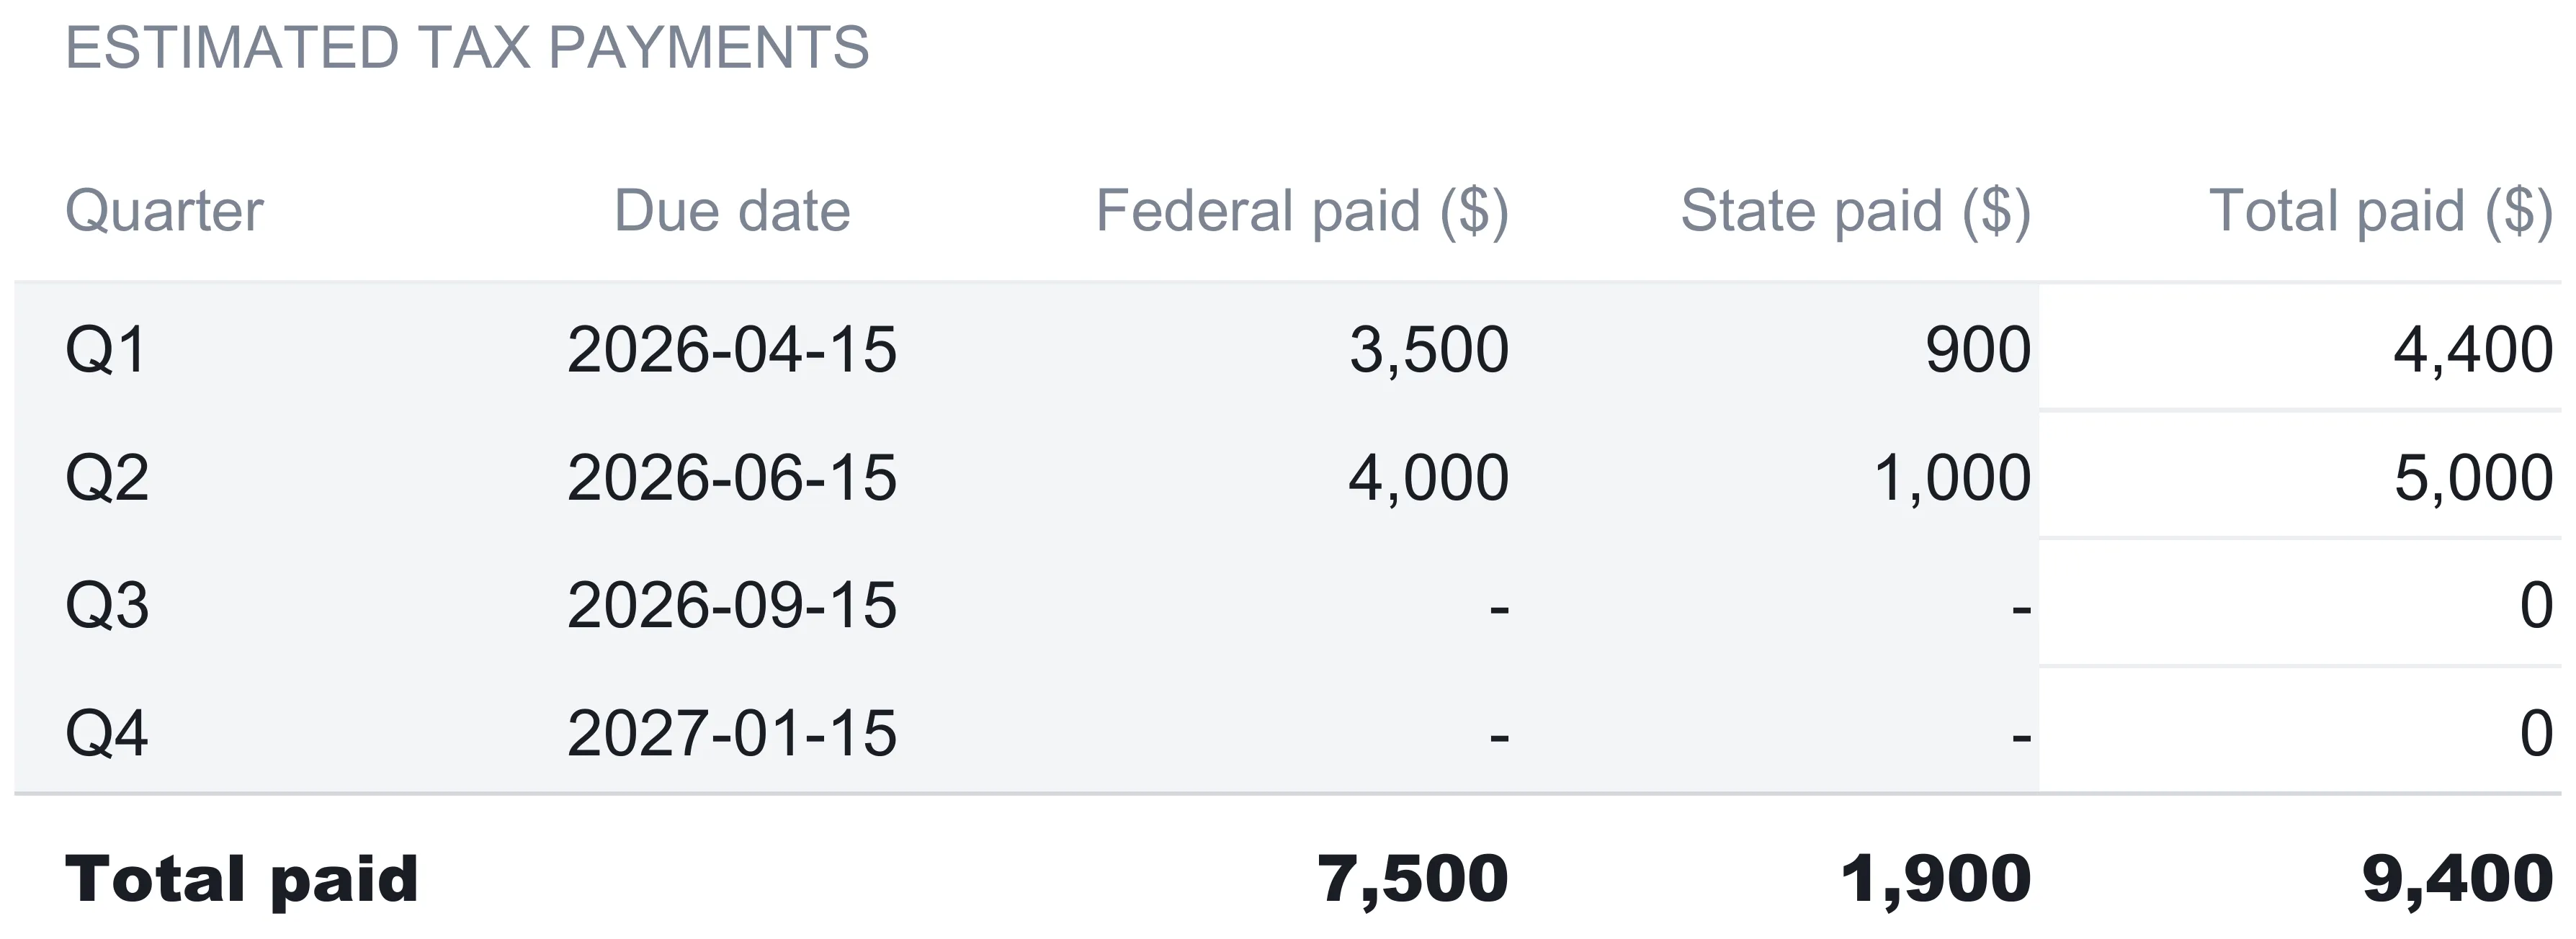
Estimated tax is paid in installments, and this sheet is where those installments are logged as they go out. It has one row per quarter, a due date, a Federal paid column, a State paid column, and a Total paid column that adds the two.
The sample records:
| Quarter | Due date | Federal paid ($) | State paid ($) | Total paid ($) |
|---|---|---|---|---|
| Q1 | 2026-04-15 | 3,500 | 900 | 4,400 |
| Q2 | 2026-06-15 | 4,000 | 1,000 | 5,000 |
| Q3 | 2026-09-15 | 0 | 0 | 0 |
| Q4 | 2027-01-15 | 0 | 0 | 0 |
| Total paid | 7,500 | 1,900 | 9,400 |
The sample shows a business partway through the year: Q1 and Q2 paid, Q3 and Q4 still at zero. The Total paid row sums each column, and its final cell, 9,400, is the year-to-date payments figure the summary and dashboard both read.
The due dates repay a second look. Q1 through Q3 fall in April, June, and September of the tax year, but Q4 lands the following January, on 2027-01-15 for a 2026 year. That later Q4 date is not a typo, and the How to Use sheet calls it out specifically: the fourth installment for a tax year falls in January of the next year. The dates in the file are the sample year’s; the IRS estimated taxes page is the authority on who needs to pay by installment and on the current year’s actual deadlines, and confirming those is a professional’s job rather than the spreadsheet’s.
Read the calculation: the Tax Summary sheet
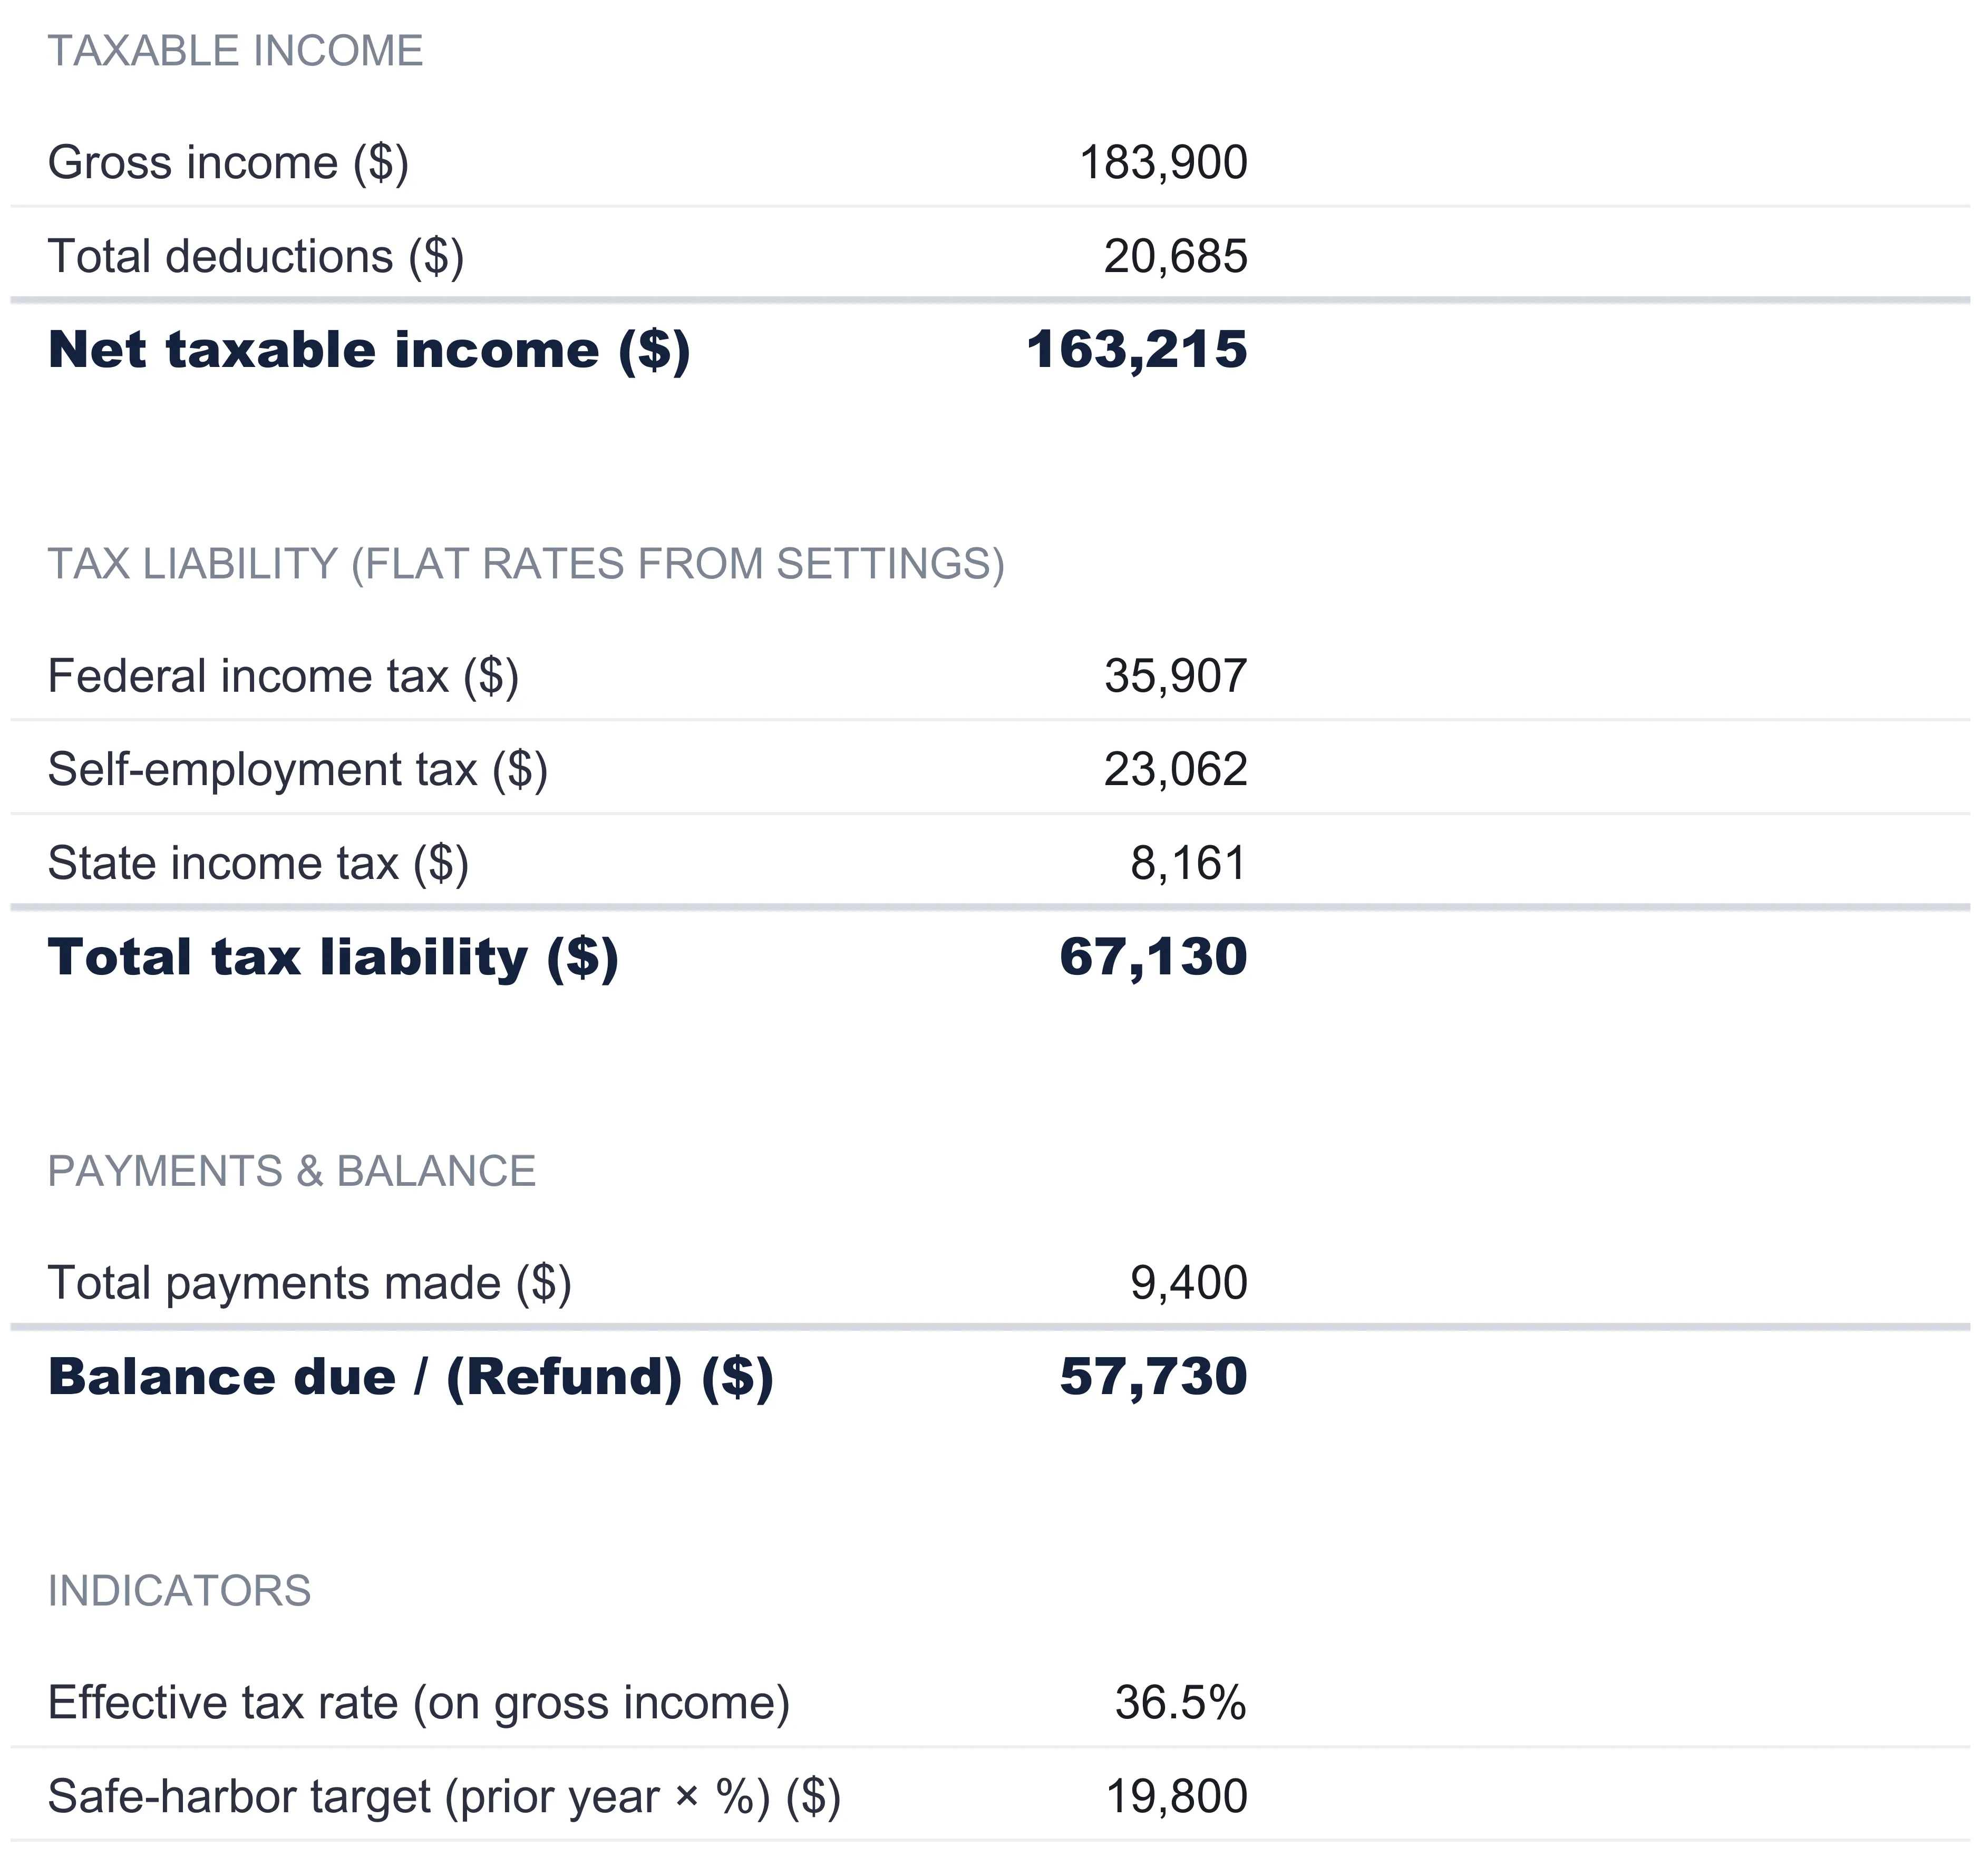
Everything typed so far comes together on the Tax Summary sheet, which lays the projection out as a readable top-to-bottom calculation rather than a wall of formulas. It has four blocks.
Taxable income starts from gross income, 183,900, pulled from the Income sheet’s grand total. It subtracts total deductions, 20,685, pulled from the Deductions sheet, to reach net taxable income of 163,215. That net figure is what the tax blocks below operate on.
Tax liability breaks the projection into three lines:
- Federal income tax, the net taxable income times the federal rate from Settings: 163,215 × 22% = 35,907.30, shown on the sheet as 35,907.
- Self-employment tax, the most involved line. The sheet first takes net taxable income times the 92.35 percent factor to get net earnings subject to the tax, about 150,729. The Social Security part applies its 12.4 percent rate to that figure but only up to the wage base of 184,500, so here the whole amount qualifies and the Social Security part is roughly 18,690. The Medicare part applies its 2.9 percent rate with no ceiling, adding about 4,371. Together the self-employment line shows as 23,062.
- State income tax, net taxable income times the state rate: 163,215 × 5% = 8,160.75, shown as 8,161.
Those three add to a total tax liability of 67,130, the same figure the dashboard carries on its tile. Every money cell on this sheet is formatted to whole units, so the cents behind each line sit in the file rather than on screen. A note under the block is unusually forthright about what this number is not. Because federal and state are single flat rates on net taxable income, there is no bracket table, no standard deduction, and no deduction for half of self-employment tax, so both the federal and self-employment figures read higher than a return applying all three would show. A second note explains the self-employment split in one line: the Social Security part stops at the wage base, the Medicare part does not. These are the file telling you plainly that it is an estimate built from placeholders.
Payments and balance subtracts what has been paid. Total payments made, 9,400, comes from the Quarterly Payments sheet. Total tax liability minus payments gives a balance due of 57,730, the number the dashboard tile prints in red. Where payments had exceeded the liability, the same line would show a refund instead, which is why it is labeled balance due or refund.
Indicators closes the sheet with two figures. The effective tax rate divides total tax by gross income, 67,130 ÷ 183,900, giving 36.5 percent. Note the denominator: this is tax against gross, not against net, so it sits below the 22 percent federal rate plus the others precisely because deductions shrink the taxed amount before any rate applies. The safe-harbor target multiplies the prior-year tax of 18,000 by the 110 percent from Settings to get 19,800. A closing note repeats that tax is computed at the rates set on Settings and that they should be adjusted to match your situation. Negative net taxable income, incidentally, produces zero in all three tax buckets rather than a negative tax.
The dashboard: seven numbers and a status line
With the input sheets filled, the Dashboard computes the year at a glance. Its header carries the business name, the tax year, and the currency, all drawn from Settings. Below that sits a status line, then seven tiles, then two charts.
| Tile | Sample value | What it means |
|---|---|---|
| Net taxable | 163,215 | Income minus deductions |
| Total tax | 67,130 | Projected liability |
| Paid | 9,400 | Year-to-date payments |
| Balance due | 57,730 | Liability minus paid |
| Effective rate | 36.5% | Tax divided by gross income |
| Safe harbor | 19,800 | Target payment |
| Total deduct | 20,685 | Sum of deductible expenses |
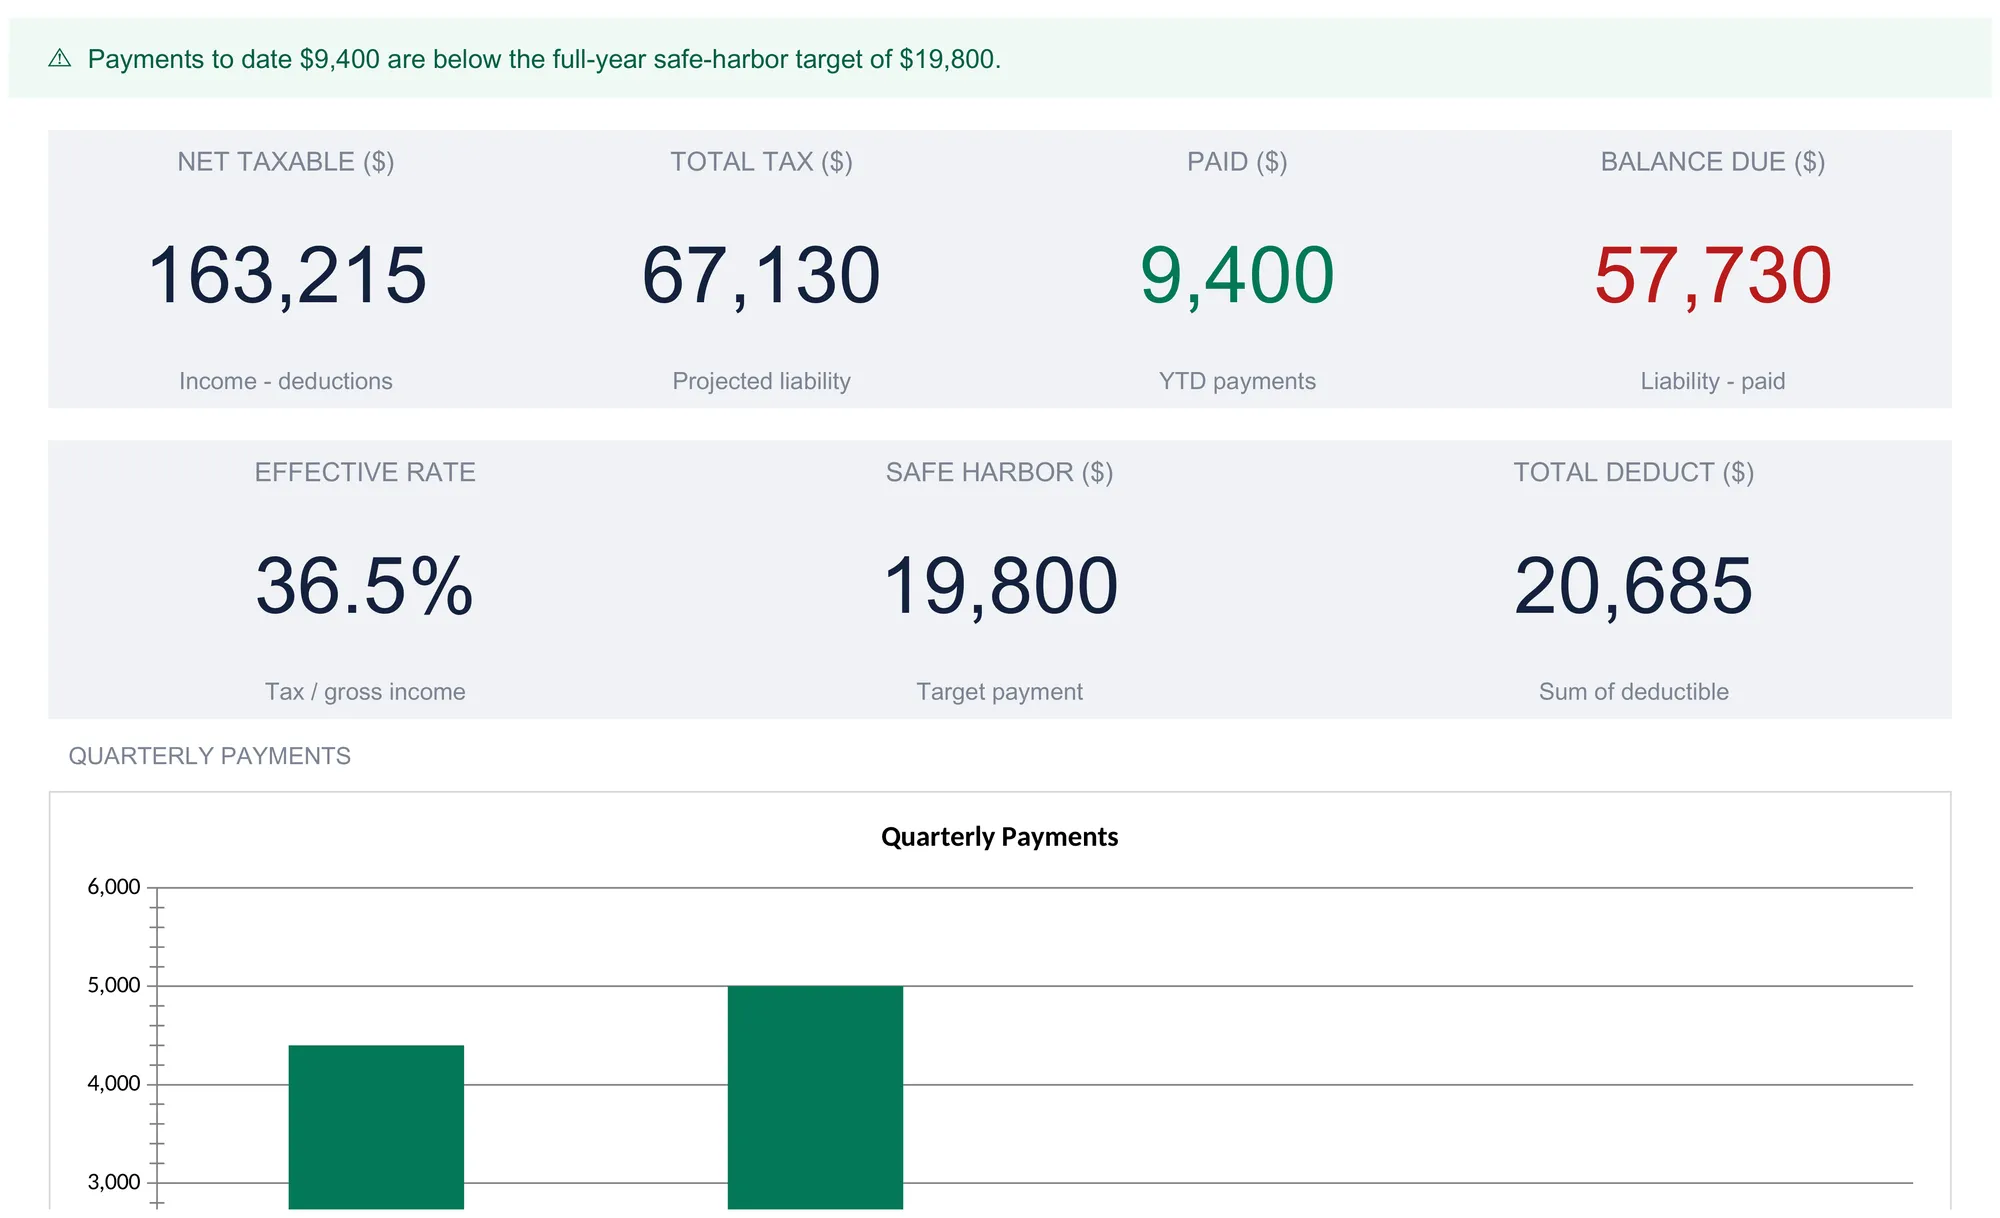
The status line above the tiles is the one piece of judgment the file makes, and even that is a mechanical comparison rather than advice. It checks payments to date against the safe-harbor target and writes one of two sentences. In the sample, payments of 9,400 sit below the target of 19,800, so it reads as a warning that payments to date are below the full-year safe-harbor target. Once payments reach or pass that target, the same line flips to a confirmation with a check mark. It is a reminder tied to the numbers you entered, nothing more, and the target itself rests on placeholder inputs you control.
The balance due tile is the figure no bank statement shows. Deposits and card charges are visible all year; the gap between the tax those imply and what has actually been sent is not, until something totals both sides. In the sample, a projected liability of 67,130 against 9,400 paid leaves 57,730 outstanding, and seeing those on one screen is most of the reason to keep the file.
Below the tiles, two charts read straight from the input sheets. One plots the quarterly payments, so the two funded quarters and the two empty ones are obvious at a glance. The other breaks the deductible total down by category, which is where a single large category, travel or home office in the sample, stands out against the smaller ones. Both redraw the moment a figure changes upstream, and the category chart picks up one of the spare deduction rows as soon as it is named.
Excel or Google Sheets for a business tax tracker
The tracker is an .xlsx workbook built on ordinary formulas, with no macros and no add-ons, so it behaves the same in Microsoft Excel and in Google Sheets after an upload. The How to Use sheet states the compatibility outright. Google Sheets suits an owner who wants the file reachable from a phone and shareable with a bookkeeper by link; Excel suits one who prefers a local file and desktop control. The weighted-sum and conditional formulas that drive the deductions and the status line are standard spreadsheet functions that both applications read identically, so nothing in the walkthrough above depends on which one you open it in.
How the tracker fits with the rest of the books
A tax tracker answers one question well: given the year’s income, deductions, and payments, what does the projected liability look like and how far short are the payments. It is deliberately narrow. It does not record individual transactions, reconcile a bank account, or produce financial statements, and it is not trying to.
That is where a general ledger comes in. The Business Bookkeeping Spreadsheet Template ($29) is the transaction-level system that sits underneath a tracker like this: it captures each entry as it happens and rolls the results up, which is exactly the source those monthly income and deduction totals are transcribed from. Many owners keep both, one for the day-to-day record and one for the year-round tax view, because each does a job the other leaves alone. The Business Tax Tracker Spreadsheet Template ($29) is the workbook this walkthrough follows, ready to use for a single business and a single tax year.
Whichever you reach for, the file is a place to organize numbers and see the arithmetic, not a substitute for advice. What is deductible, which rate is right, what is owed, and when it is due are determinations for a qualified tax professional. Arriving at that conversation with income, deductions, and payments already totaled and categorized is the practical payoff, turning a scramble into a review.
Related
- How to Do Bookkeeping in a Spreadsheet - the transaction-level ledger that feeds the monthly totals this tracker reads
- How to Build a Profit and Loss Statement in a Spreadsheet - the same income and expense data arranged as a P&L
- How to Create an Expense Report in a Spreadsheet - a closer look at logging and categorizing the business costs that land on the Deductions sheet
VERIFIED FACTS
- The workbook has seven sheets: Dashboard, Income, Deductions, Quarterly Payments, Tax Summary, Settings, and How to Use.
- How to Use gives a one-line sheet overview in tab order (Dashboard, Income, Deductions, Quarterly Payments, Tax Summary, Settings) and notes that tinted cells are inputs while tax amounts and totals are formulas. It does not prescribe a fill order.
- Settings Business block sample: business name “Business Name Inc.”, currency symbol ”$”, tax year 2026 (renders as “2,026” with a thousands separator in the gallery image).
- Settings currency dropdown has 35 symbols (named range CurrencySymbols = Settings!$G$2:$G$36); changing it relabels every money header and KPI across the workbook but does not convert the numbers (stated on How to Use).
- Settings tax-rate samples: federal income tax 22% (0.22); net earnings subject to SE tax 92.35% (0.9235); Social Security rate 12.4% (0.124); Social Security wage base 184,500; Medicare rate 2.9% (0.029, no ceiling); state income tax 5% (0.05).
- Settings safe-harbor samples: prior-year total tax 18,000; safe-harbor percentage 110% (1.1).
- Income sheet: rows per source × months Jan-Dec plus a Total column = SUM(B:M). Sample sources: consulting fees 113,300; recurring retainers 46,000; product sales 24,600. Three spare rows. Monthly total row grand total = 183,900.
- Deductions sheet: 8 categories plus 4 spare rows; columns Jan-Dec, Total raw (N), Deduct % (O), Deductible (P). Deductible = Total raw × Deduct % (P = N × O).
- Deductions sample raw/deductible: home office 5,040/100%/5,040; mileage-vehicle 3,220/100%/3,220; equipment 3,000/100%/3,000; software & tools 1,720/100%/1,720; professional fees 1,500/100%/1,500; travel 4,200/100%/4,200; meals 2,330/50%/1,165; other 840/100%/840.
- Deductions totals: raw total 21,850; deductible total 20,685. The Monthly deductible row uses SUMPRODUCT of the month against the per-category percentages.
- Quarterly Payments: Q1 due 2026-04-15 (fed 3,500, state 900, total 4,400); Q2 due 2026-06-15 (fed 4,000, state 1,000, total 5,000); Q3 due 2026-09-15 (0); Q4 due 2027-01-15 (0). Total paid: federal 7,500, state 1,900, total 9,400. Total paid = Federal + State per row.
- How to Use notes the Q4 estimated payment falls in January of the following year, later than Q1-Q3.
- Tax Summary: gross income 183,900 (from Income N13); total deductions 20,685 (from Deductions P19); net taxable income 163,215 (= gross - deductions).
- Tax Summary federal tax = MAX(0, net) × federal rate = 163,215 × 22% = 35,907.30.
- Tax Summary self-employment tax = MIN(net × 0.9235, 184,500) × 12.4% + net × 0.9235 × 2.9% = 23,061.55 (net earnings subject ≈ 150,729; SS part ≈ 18,690; Medicare part ≈ 4,371).
- Tax Summary state tax = net × 5% = 8,160.75. Total tax liability = 35,907.30 + 23,061.55 + 8,160.75 = 67,129.60 (displayed 67,130). Every money cell on Tax Summary uses the #,##0 format, so the lines display as 35,907 / 23,062 / 8,161.
- Tax Summary payments 9,400 (from Quarterly Payments E11); balance due / (refund) = 67,129.60 - 9,400 = 57,729.60 (displayed 57,730).
- Tax Summary indicators: effective tax rate = total tax ÷ gross income = 67,130 ÷ 183,900 = 36.5%; safe-harbor target = prior-year tax × percentage = 18,000 × 110% = 19,800. Negative net taxable income yields zero tax in all three buckets.
- Dashboard has seven KPI tiles: Net taxable 163,215, Total tax 67,130, Paid 9,400, Balance due 57,730 (red), Effective rate 36.5%, Safe harbor 19,800, Total deduct 20,685. Header shows business name, tax year, and currency.
- Dashboard status line compares payments to date against the safe-harbor target: warning (⚠) when below, confirmation (✓) when reached. Sample shows the warning: payments 9,400 below target 19,800.
- Dashboard has two charts: quarterly payments by quarter (Q1 4,400, Q2 5,000, Q3 0, Q4 0) and deductible by category. Both update when spare rows are named.
- Tax Summary and How to Use both state the flat-rate simplification: no bracket table, no standard deduction, no deduction for half of SE tax, so federal and SE figures read higher than a full return; the workbook is a planning tool, not a tax filing.
- The file is an .xlsx with no macros and no add-ons; How to Use states it works in Microsoft Excel and Google Sheets. Tinted cells are inputs; totals and tax amounts are formulas.
Frequently asked questions
What is the difference between net taxable income and gross income here?
Gross income on the Tax Summary sheet is the grand total of every source on the Income sheet, $183,900 in the sample. Net taxable income subtracts total deductions, $20,685, to reach $163,215. The workbook applies its flat sample rates to the net figure, not the gross. The effective rate tile divides total tax by gross income, so it reads lower than the Settings rates added together because part of gross income is deducted before any rate applies.
Why does the sample tax read higher than what a real return would show?
The Tax Summary sheet says so directly: federal and state tax are one flat rate applied to net taxable income, with no bracket table, no standard deduction, and no deduction for half of self-employment tax. A real return applies all three, so the workbook's figures sit above what a filed return typically produces. It is a planning estimate, not a filing, and the rates are placeholders to change on Settings.
How does the workbook handle the self-employment tax split?
Self-employment tax is computed in two parts. The Social Security portion applies its rate to net earnings only up to the wage base set on Settings ($184,500 in the sample), so it stops once earnings pass that ceiling. The Medicare portion applies its rate with no ceiling. Both parts run on net earnings after the 92.35% factor on Settings. The IRS self-employment tax page describes the same 12.4% Social Security and 2.9% Medicare structure.
What is the safe-harbor target on the dashboard?
The safe-harbor tile multiplies the prior-year total tax entered on Settings ($18,000) by the safe-harbor percentage there (110%), giving $19,800. The dashboard compares payments to date against that number and shows a warning when payments fall short. The percentage that actually applies to a given taxpayer varies with income, so the Settings note flags it as adjustable and the figure is illustrative only.
Can this replace bookkeeping software or an accountant?
No. It is a single-year planning workbook that records income, deductions, and payments and projects a liability from sample rates. It does not file anything, does not track invoices or bank transactions, and does not confirm which expenses are deductible in your jurisdiction. Confirming deductions, rates, and deadlines is work for a qualified tax professional, and day-to-day transaction recording is what dedicated bookkeeping tools handle.
Sources
- Estimated taxes - Internal Revenue Service
- Self-employment tax (Social Security and Medicare taxes) - Internal Revenue Service
About this article
Every figure, column name, formula, and feature description checked on 2026-09-10 against the shipped Business Tax Tracker Premium workbook (Dashboard, Income, Deductions, Quarterly Payments, Tax Summary, Settings and How to Use sheets) and the screenshots in this article. IRS estimated taxes and self-employment tax references checked against the live IRS pages at writing time. Last reviewed September 2026.