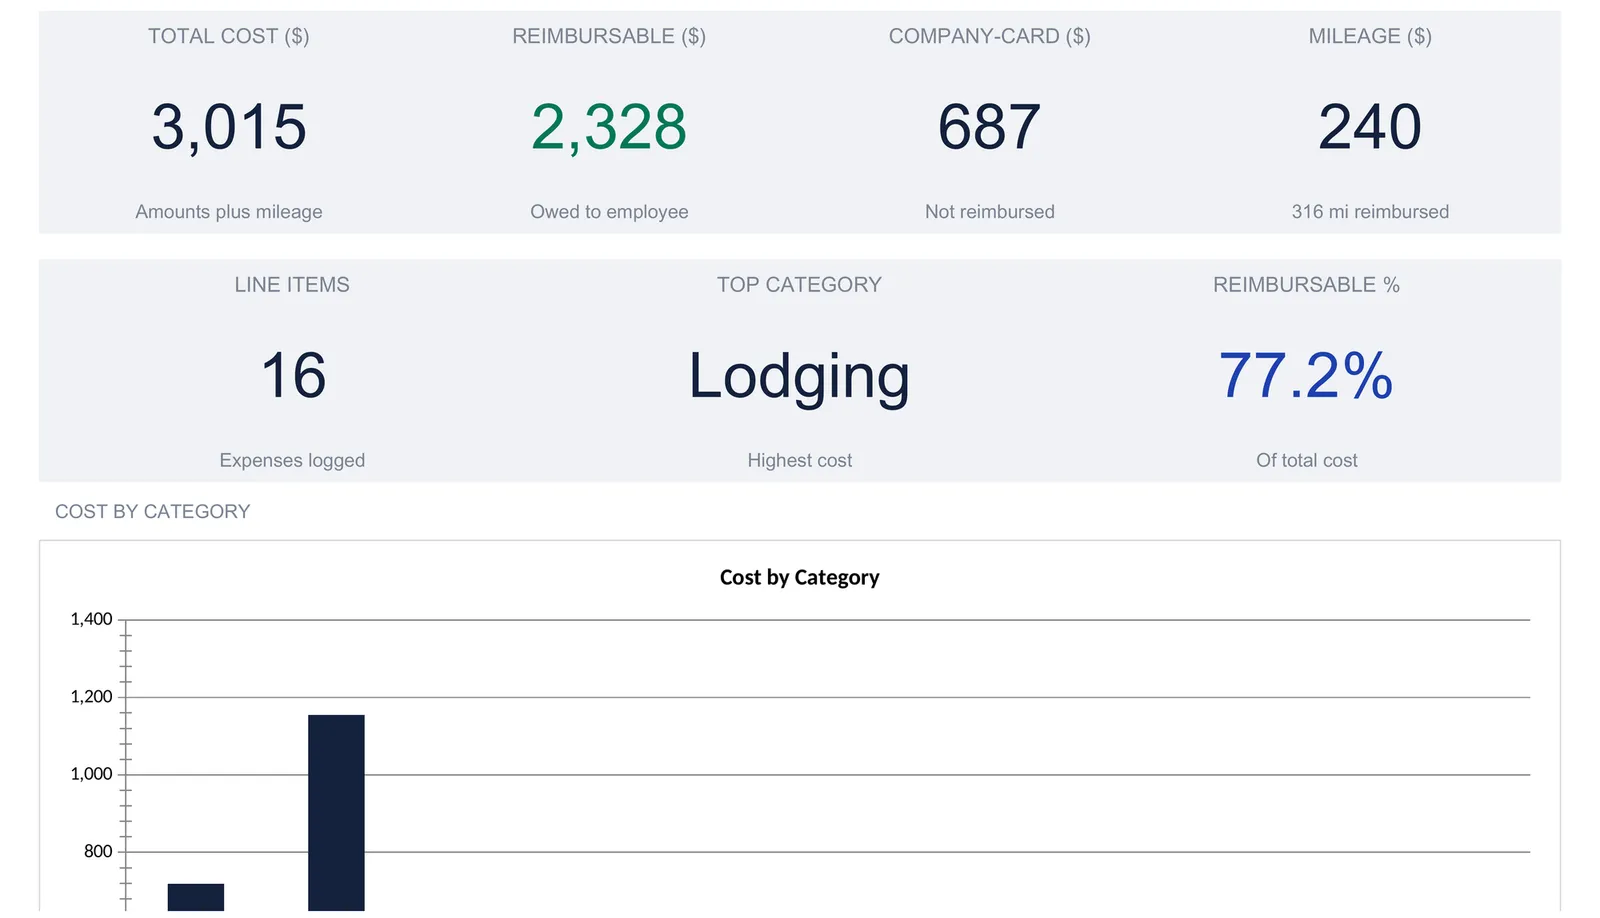
A business expense report starts with one line-item log and derives everything else from it: mileage priced per trip, the amount owed back to the employee, company-card spend that is not reimbursed, and category totals checked against policy caps. This walkthrough follows the full structure with a worked example, a single employee's August claim of 16 expenses totaling $3,015.06 in cost, $2,328.06 reimbursable, and $240.16 of mileage across 316 miles. Our Expense Report Spreadsheet Template ($19) ships the same structure ready-made for Excel and Google Sheets.
An expense report is a small document with a lot of edges. One trip can mix a flight paid out of pocket, a hotel on a personal card, a client dinner on the company card, and a drive that earns mileage but costs nothing at the pump. Some of that is owed back to the person who traveled, some was already paid by the business, and some can be rebilled to a client. A payout figure alone cannot tell those apart. Keeping them straight is a structure problem, and a spreadsheet handles it cleanly.
That structure is a handful of pieces: a claimant and a set of rates, a list of category caps, one line-item log where every expense is typed once, and the derived views that fall out of it (a category summary, a submittable report, and a dashboard). The examples below come from our Expense Report Spreadsheet Template ($19), which ships the whole thing ready-made for Excel and Google Sheets. The same layout is reproducible by hand if you would rather build your own.
What a business expense report has to hold
This is not a personal expense tracker. A personal tracker answers “where did my money go this month?” A business expense report answers a different and narrower question: “of everything spent on this trip or this period, how much does the company owe this person back?” Those are not the same total, because a business expense report has to separate money the employee fronted from money the business already paid, and it has to check the whole thing against a spending policy before anyone signs off.
Strip it down and there are five kinds of data:
- The claim header. Who is claiming, who approves it, and the period it covers. One report is one person for one period.
- The rates and rules. The per-mile reimbursement rates and the date they change, plus a currency label for display.
- The policy. A named list of expense categories and a spending cap for each one.
- The line items. Every expense typed once: date, category, description, amount, how it was paid, miles driven, and whether it can be rebilled to a client.
- The derived views. The category summary, the reimbursement report, and the dashboard. Nothing here is typed; it is all calculated from the line items.
The template gives each of these its own sheet. There are seven in total: Settings, Policy, Expenses, Summary, Report, and a Dashboard on top, with a How to Use sheet carrying the instructions. The rest of this walkthrough follows them in the order the How to Use sheet lays out, which is also the order the work happens.
Start with the claim and the rates: the Settings sheet
Settings is where the report is addressed and where the mileage math is defined, so it comes first.
Three cells name the claim: the employee, the approving manager, and the report period. Those three flow through to the top of every other sheet and onto the printed report, so they are typed once and never again. The sample uses placeholders, “Employee Name”, “Manager Name”, and a period of “Aug 2026”.
Below the claim sit the numbers that drive mileage. There are two per-mile rates and a changeover date. Each expense line later picks its own rate by comparing its trip date to that changeover date, which is what lets a single report span a rate change without any manual sorting. The sample ships with the 2026 IRS standard business mileage figures: 72.5 cents per mile for trips before 1 July 2026, and 76 cents from 1 July onward. A note on the sheet spells out that those are the published federal figures and that a company reimbursing at its own rate can simply overwrite the two cells.
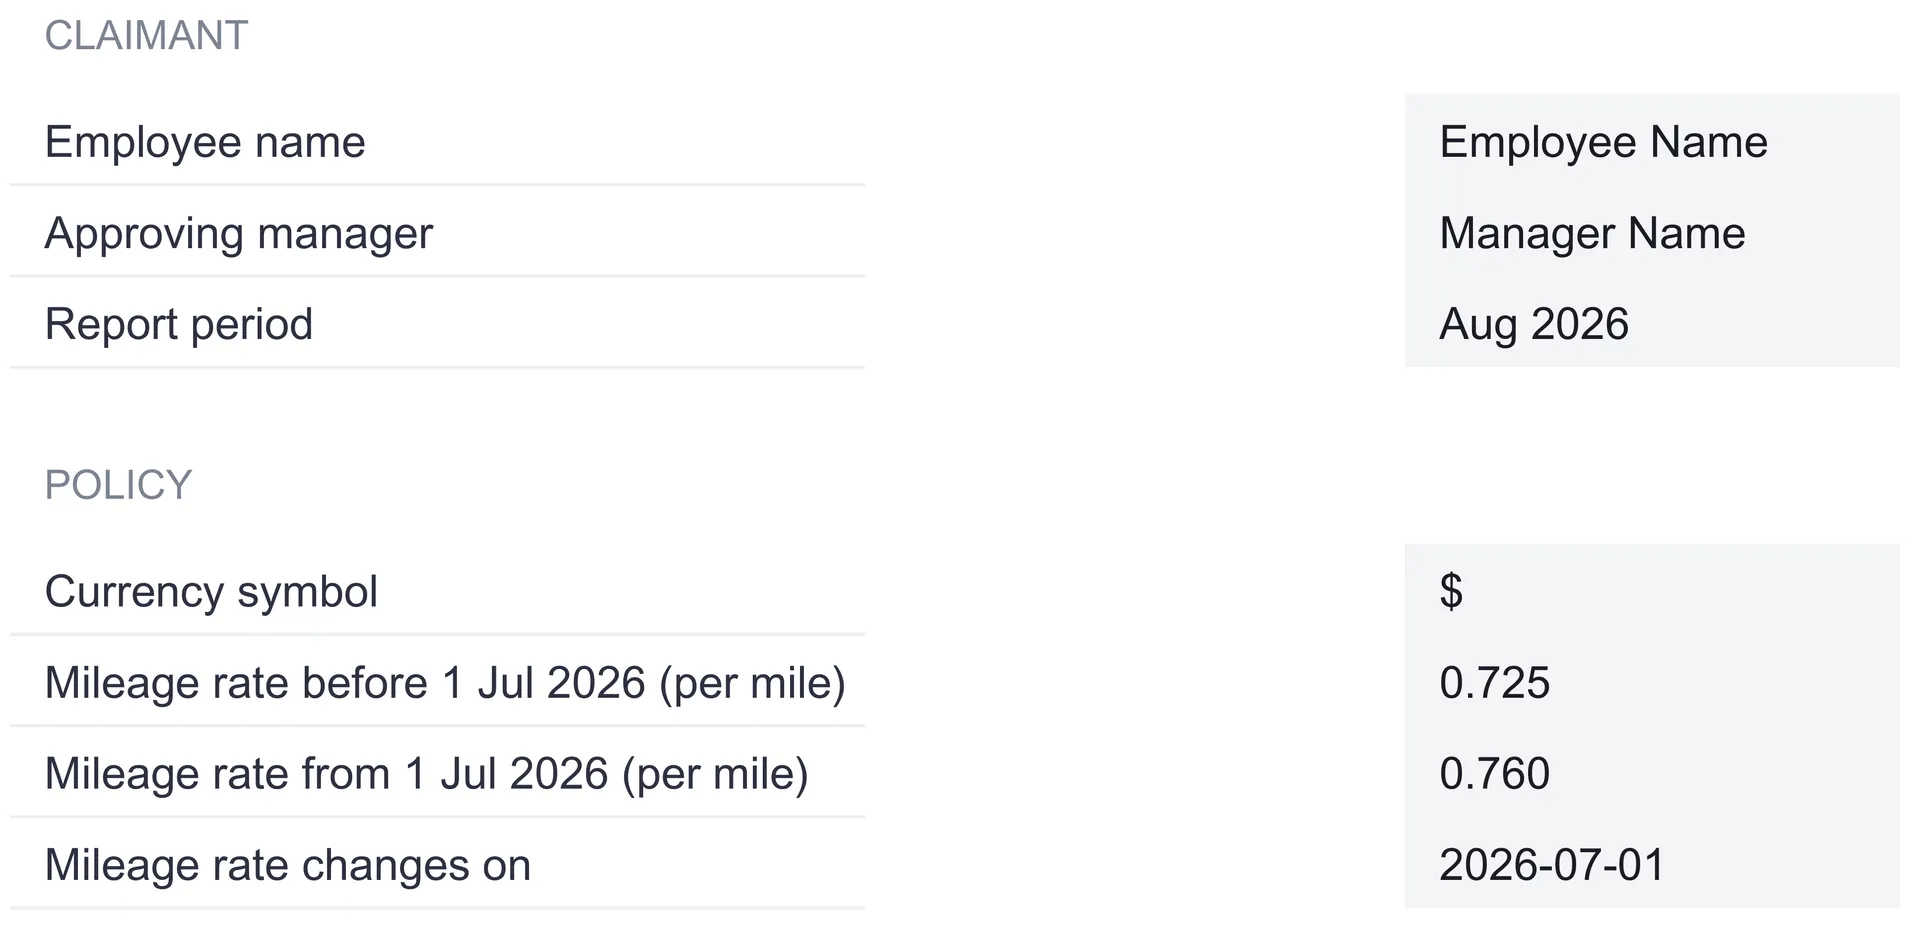
Settings holds one more control, a currency symbol at the top of the same policy block, chosen from a dropdown of 35 options. Picking one relabels every money column and every dashboard tile across the workbook at once. It relabels only, with no conversion of the underlying numbers, so it is a display choice rather than an exchange-rate tool.
Set the category caps: the Policy sheet
The Policy sheet is short but it does two jobs. It names the expense categories the report recognizes, and it sets a spending cap for each one per report.
The sample ships seven categories with these caps:
| Category | Cap per report ($) |
|---|---|
| Travel | 3,000 |
| Lodging | 4,000 |
| Meals | 1,500 |
| Supplies | 1,000 |
| Software | 1,200 |
| Client entertainment | 2,000 |
| Other | 800 |
Three further blank rows sit below the list for companies that need extra categories, so the policy holds up to ten in all. The cap is per report and it covers the full cost of the category, mileage included, rather than just the out-of-pocket portion.
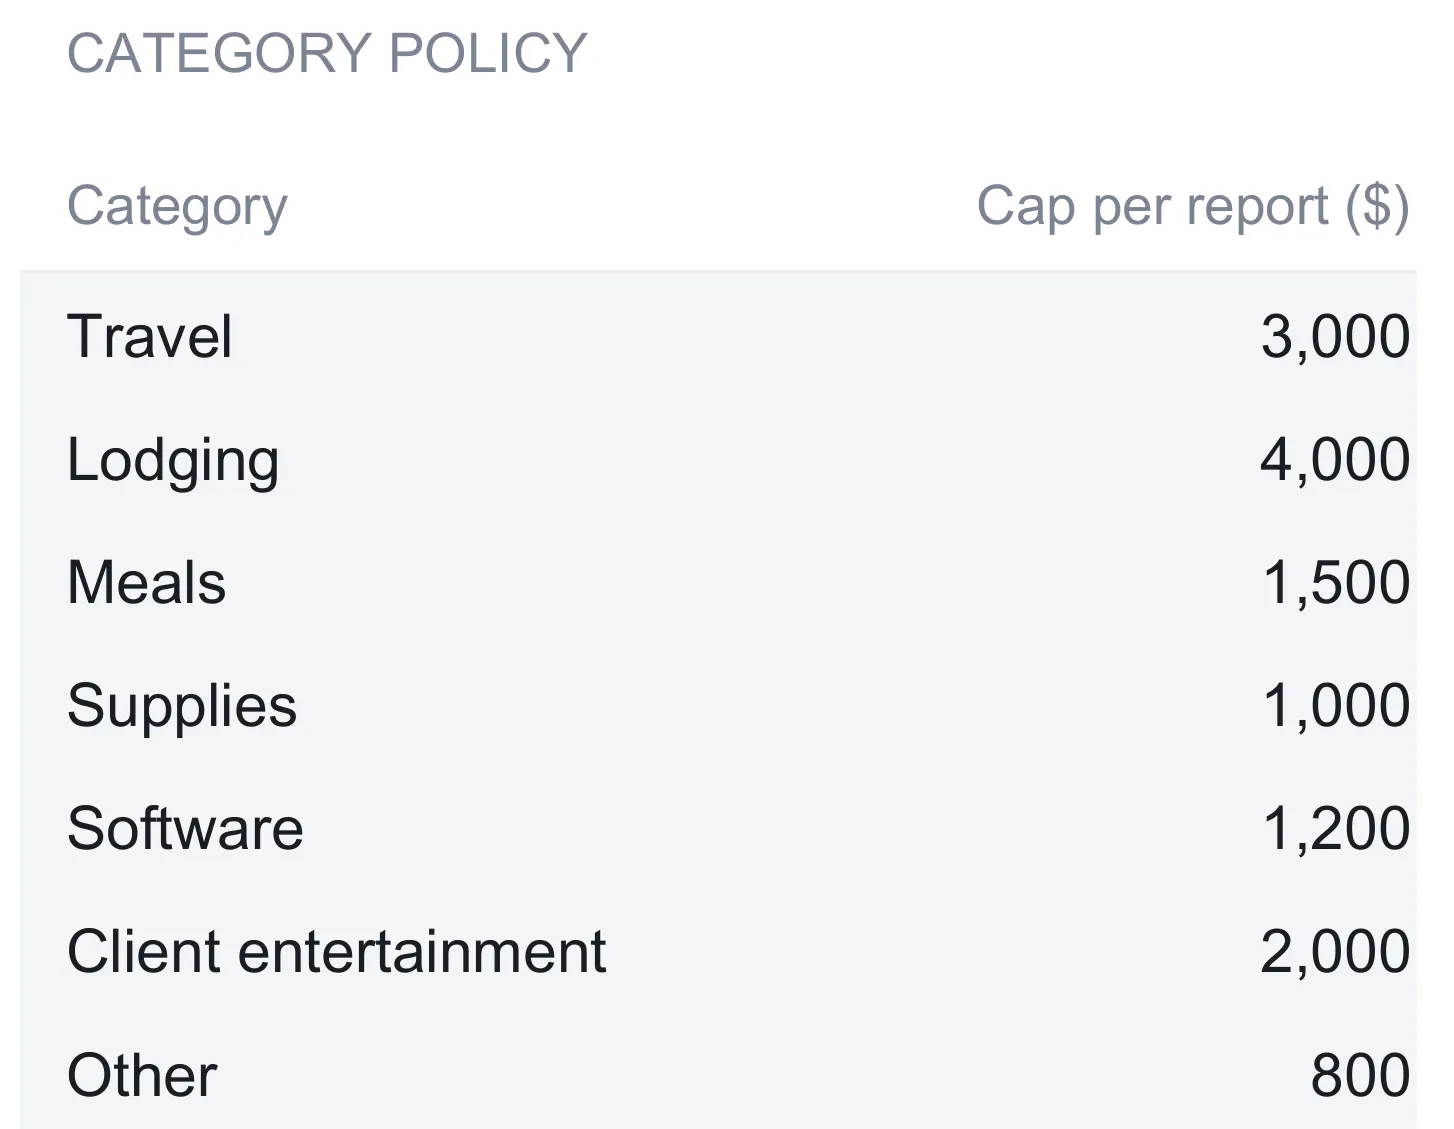
These names do more than sit in a table. They drive the Category dropdown on the Expenses sheet and they become the rows of the Summary, so the whole workbook stays consistent with one edited list. There is a design detail worth copying into any hand-built version: rename a category here and both the dropdown and the Summary follow, but any line already logged under the old name drops to an Uncategorised row until it is re-picked. That behavior is a feature rather than a bug, because it surfaces the orphaned lines instead of silently dropping their totals.
Log each expense once: the Expenses sheet
The Expenses sheet is the only place an expense is ever typed. It has ten columns, and the split between what is entered and what is calculated is the heart of the design.
Eight columns are entries: date, category, description, amount, method (how it was paid), miles driven, whether the line is billable to a client, and a free-text note. Two columns are formulas that fill in as you type:
- Mileage = miles × the per-mile rate for the trip date. In words, the line looks at its own date, chooses the before-changeover rate or the from-changeover rate on Settings, multiplies by the miles, and rounds to the cent.
- Reimbursable = the amount, unless the method is Company, plus that line’s mileage, rounded to the cent. Spend put on a company card reimburses nothing; anything else is treated as out of pocket and paid back, and mileage is always added on top.
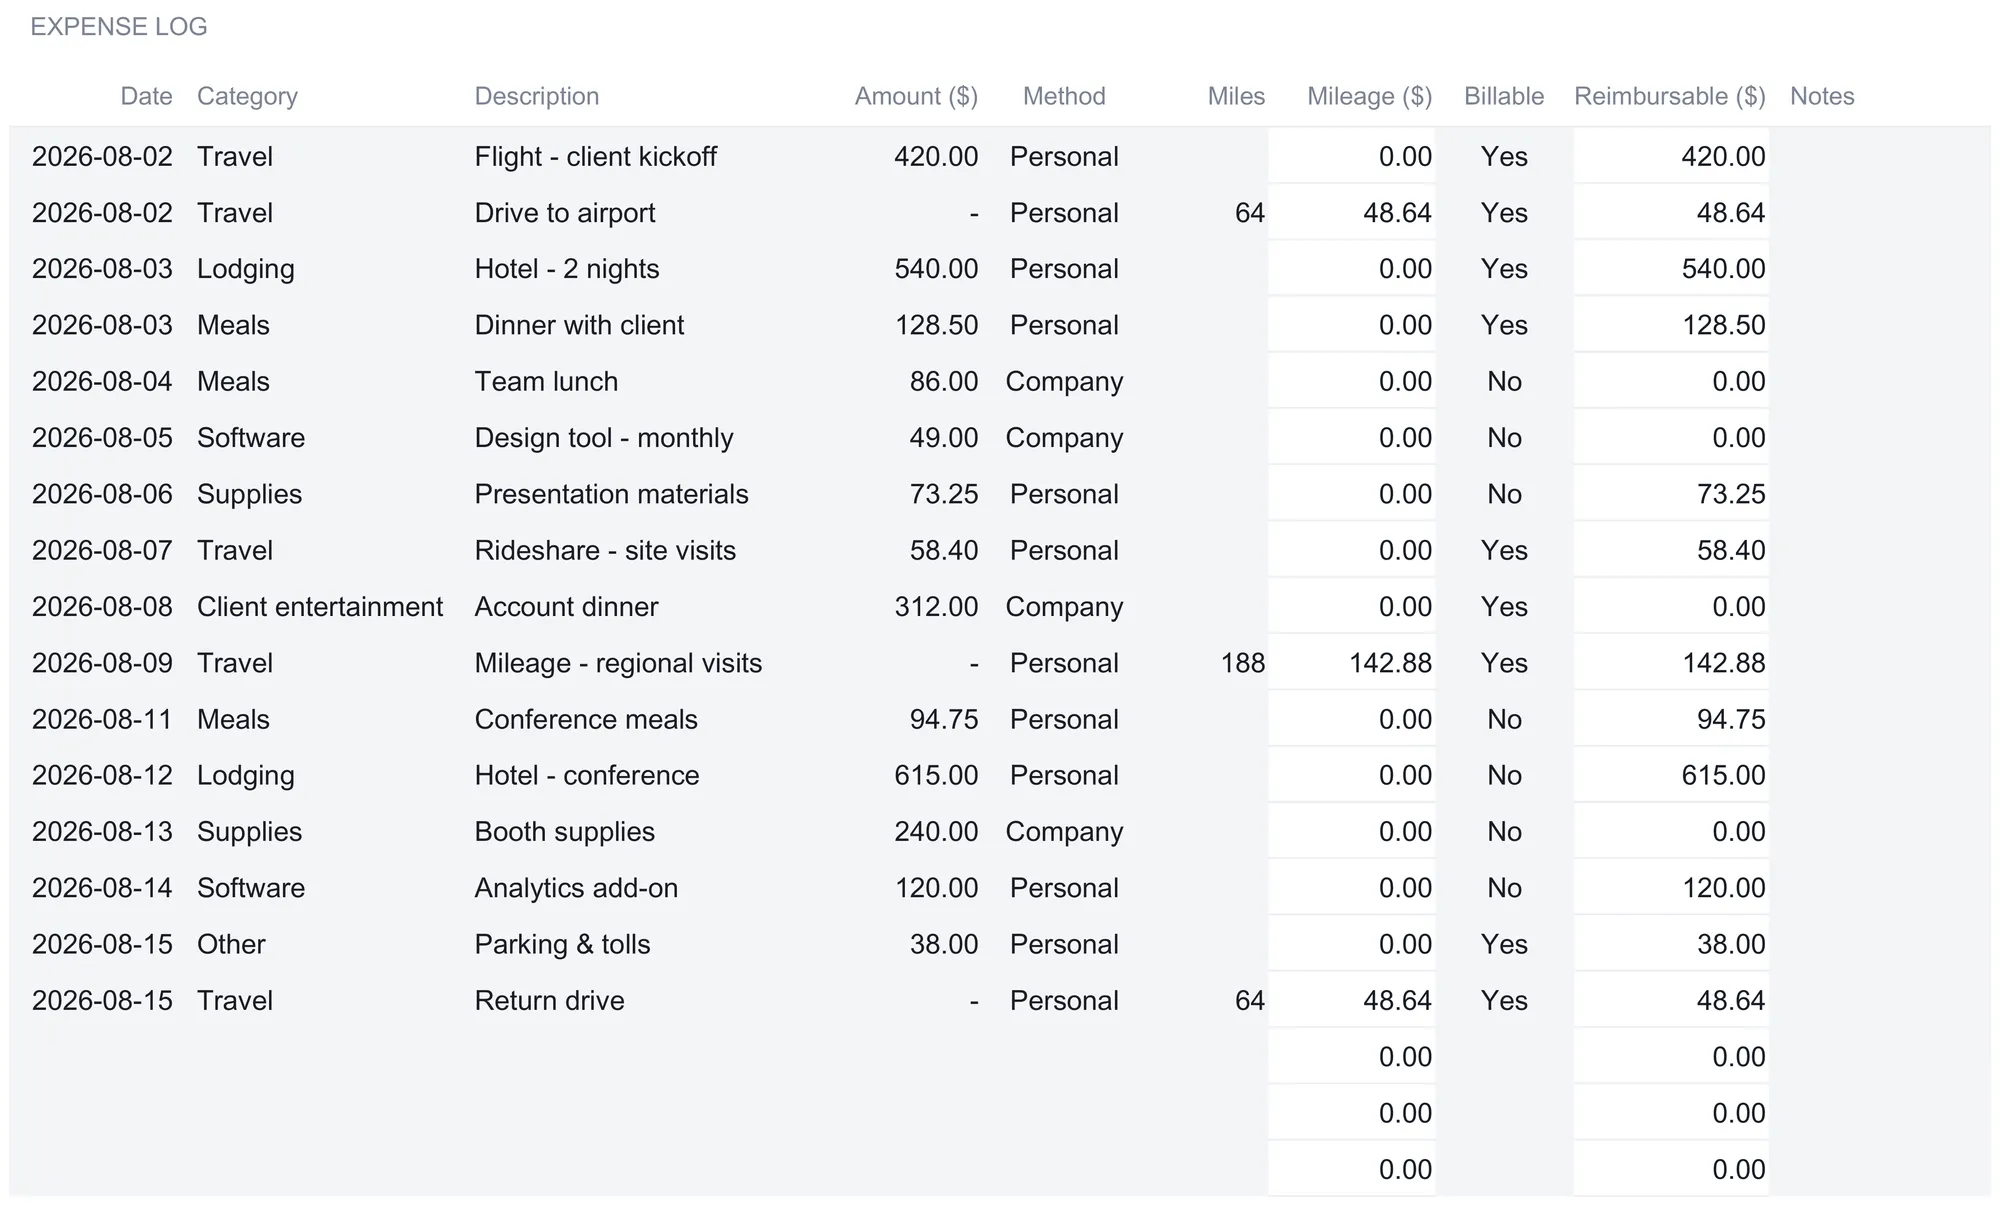
A few sample lines make the logic concrete. A flight for a client kickoff, logged at $420 with the method set to Personal, reimburses the full $420. A team lunch of $86 put on the company card reimburses nothing, because Company spend is removed, though its cost still counts toward the Meals category and its cap. A drive to the airport is entered with a zero amount and 64 miles; because the trip falls in August, it prices at the 76-cent rate for $48.64 of mileage, all of it reimbursable. An account dinner of $312 on the company card reimburses nothing yet is marked billable, so it will show up in the billable total without ever being owed back to the employee.
Walking one category through the two formulas shows how the columns fit together. Travel carries five lines in the sample: the $420 flight, a $58.40 rideshare, and three mileage entries where the amount is zero but the miles are not. The amounts add to $478.40, the mileage adds $240.16, and the two together make the $718.56 that shows up as Travel’s cost on the Summary. Because none of the five went on a company card, all $718.56 is reimbursable too, which is why Travel’s cost and reimbursable figures match exactly. Meals tells the opposite story: its $309.25 of cost includes the $86 company-card team lunch, so only $223.25 comes back to the employee. The formulas never treat the two questions, what did it cost and what is owed, as the same number.
The mileage rate switch is easy to underrate until a report straddles the changeover. Every line prices itself from its own date, so a report covering late June and early July would apply 72.5 cents to the June trips and 76 cents to the July ones automatically, with no sorting and no second table. In the sample, all sixteen lines fall in August, so all three mileage lines (64 miles, 188 miles, and 64 miles) use the 76-cent rate and add up to $240.16 across 316 total miles.
Two structural habits are worth carrying into a hand-built version. The log ships with its blank rows already wired: they carry the mileage and reimbursable formulas and already sit inside every total, so the next expense goes on the first free row and the whole workbook updates without dragging a formula down. And a small Totals row at the foot adds the Amount column on its own, $2,774.90 in the sample; the Summary is what adds mileage on top to reach the full cost of the claim. Keeping those two figures distinct is deliberate, because the raw amount total and the mileage-inclusive cost answer different questions.
Read it by category: the Summary sheet
The Summary rolls the log up by category, and every cell on it is computed. For each of the policy categories it shows four numbers and a flag.
| Category | Cost ($) | Reimbursable ($) | Items | Cap ($) | Status |
|---|---|---|---|---|---|
| Travel | 718.56 | 718.56 | 5 | 3,000 | OK |
| Lodging | 1,155.00 | 1,155.00 | 2 | 4,000 | OK |
| Meals | 309.25 | 223.25 | 3 | 1,500 | OK |
| Supplies | 313.25 | 73.25 | 2 | 1,000 | OK |
| Software | 169.00 | 120.00 | 2 | 1,200 | OK |
| Client entertainment | 312.00 | 0.00 | 1 | 2,000 | OK |
| Other | 38.00 | 38.00 | 1 | 800 | OK |
| Total | 3,015.06 | 2,328.06 | 16 |
Cost here is the amount logged plus that line’s mileage, which is why Cost minus Reimbursable for any category equals its company-card share. Meals is the clearest example: $309.25 of cost against $223.25 reimbursable leaves $86, the team lunch that went on the company card. Client entertainment shows the split at its starkest, $312 of cost and nothing reimbursable, because the one line in it was a company-card charge.
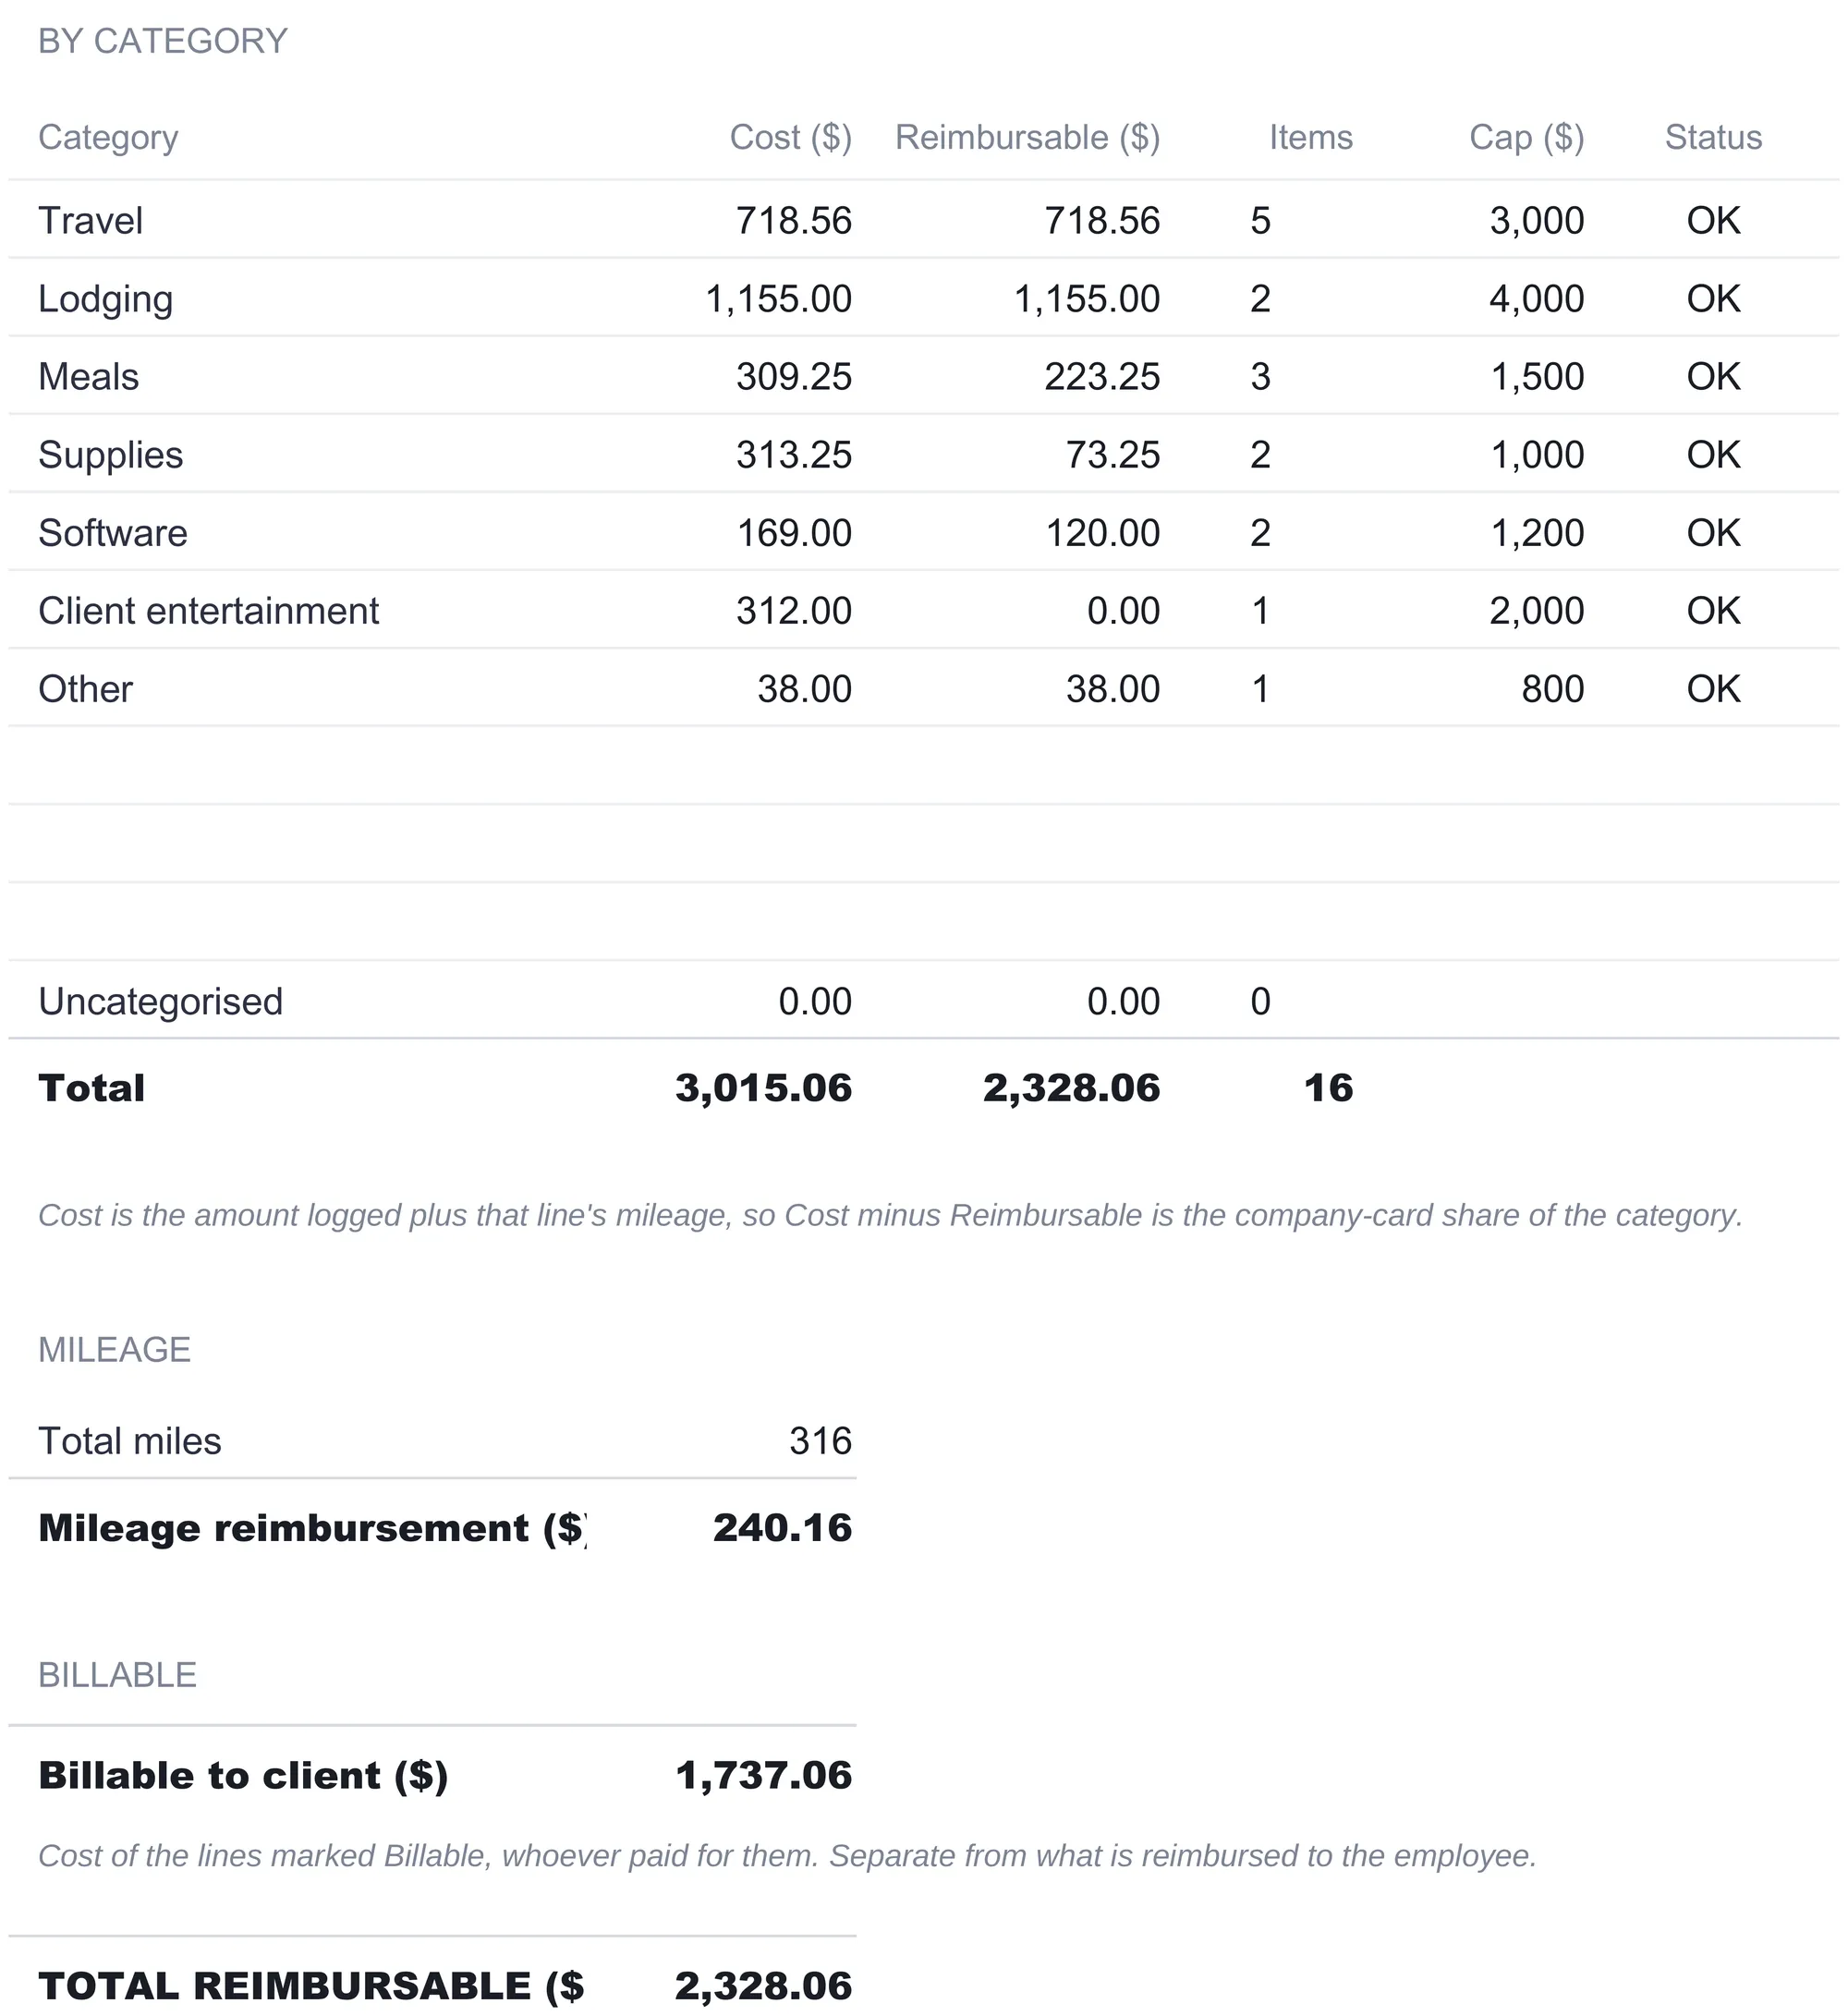
The Status column is where the policy earns its place. Each category’s cost is compared with its cap: within the cap reads OK, over it reads Over cap. In the worked example every category clears its cap comfortably, with Lodging the closest at $1,155 against a $4,000 ceiling, so every row reads OK. A category with no cap set reads No cap rather than flagging. An Uncategorised row sits below the named categories to catch any line logged under a name that is not in the policy, which is the safety net that keeps a mistyped category from quietly vanishing from the totals; in the sample it holds nothing.
Below the category table, the Summary adds three roll-ups that the report and dashboard draw on. Mileage totals 316 miles and $240.16 of reimbursement. A billable line totals $1,737.06, the cost of every line marked billable whoever paid for it, held deliberately apart from what the employee is owed. And a single total-reimbursable figure, $2,328.06, restates the amount owed back.
The submittable claim: the Report sheet
The Report sheet is the part that leaves the building. It reprints the claim header (employee, approving manager, and period) and lays out the totals in the order an approver reads them.
| Line | Sample value ($) |
|---|---|
| Total cost | 3,015.06 |
| Company-card spend | 687.00 |
| Mileage reimbursement | 240.16 |
| Out-of-pocket spend | 2,087.90 |
| Total reimbursable to employee | 2,328.06 |
The arithmetic ties out in two directions, which is what makes the sheet trustworthy at a glance. Company-card spend plus mileage plus out-of-pocket equals the total cost ($687 + $240.16 + $2,087.90 = $3,015.06). Mileage plus out-of-pocket equals the amount reimbursed ($240.16 + $2,087.90 = $2,328.06). The $687 of company-card spend is the sum of every line whose method was set to Company, money the business already paid, which is why it drops out of the reimbursement.
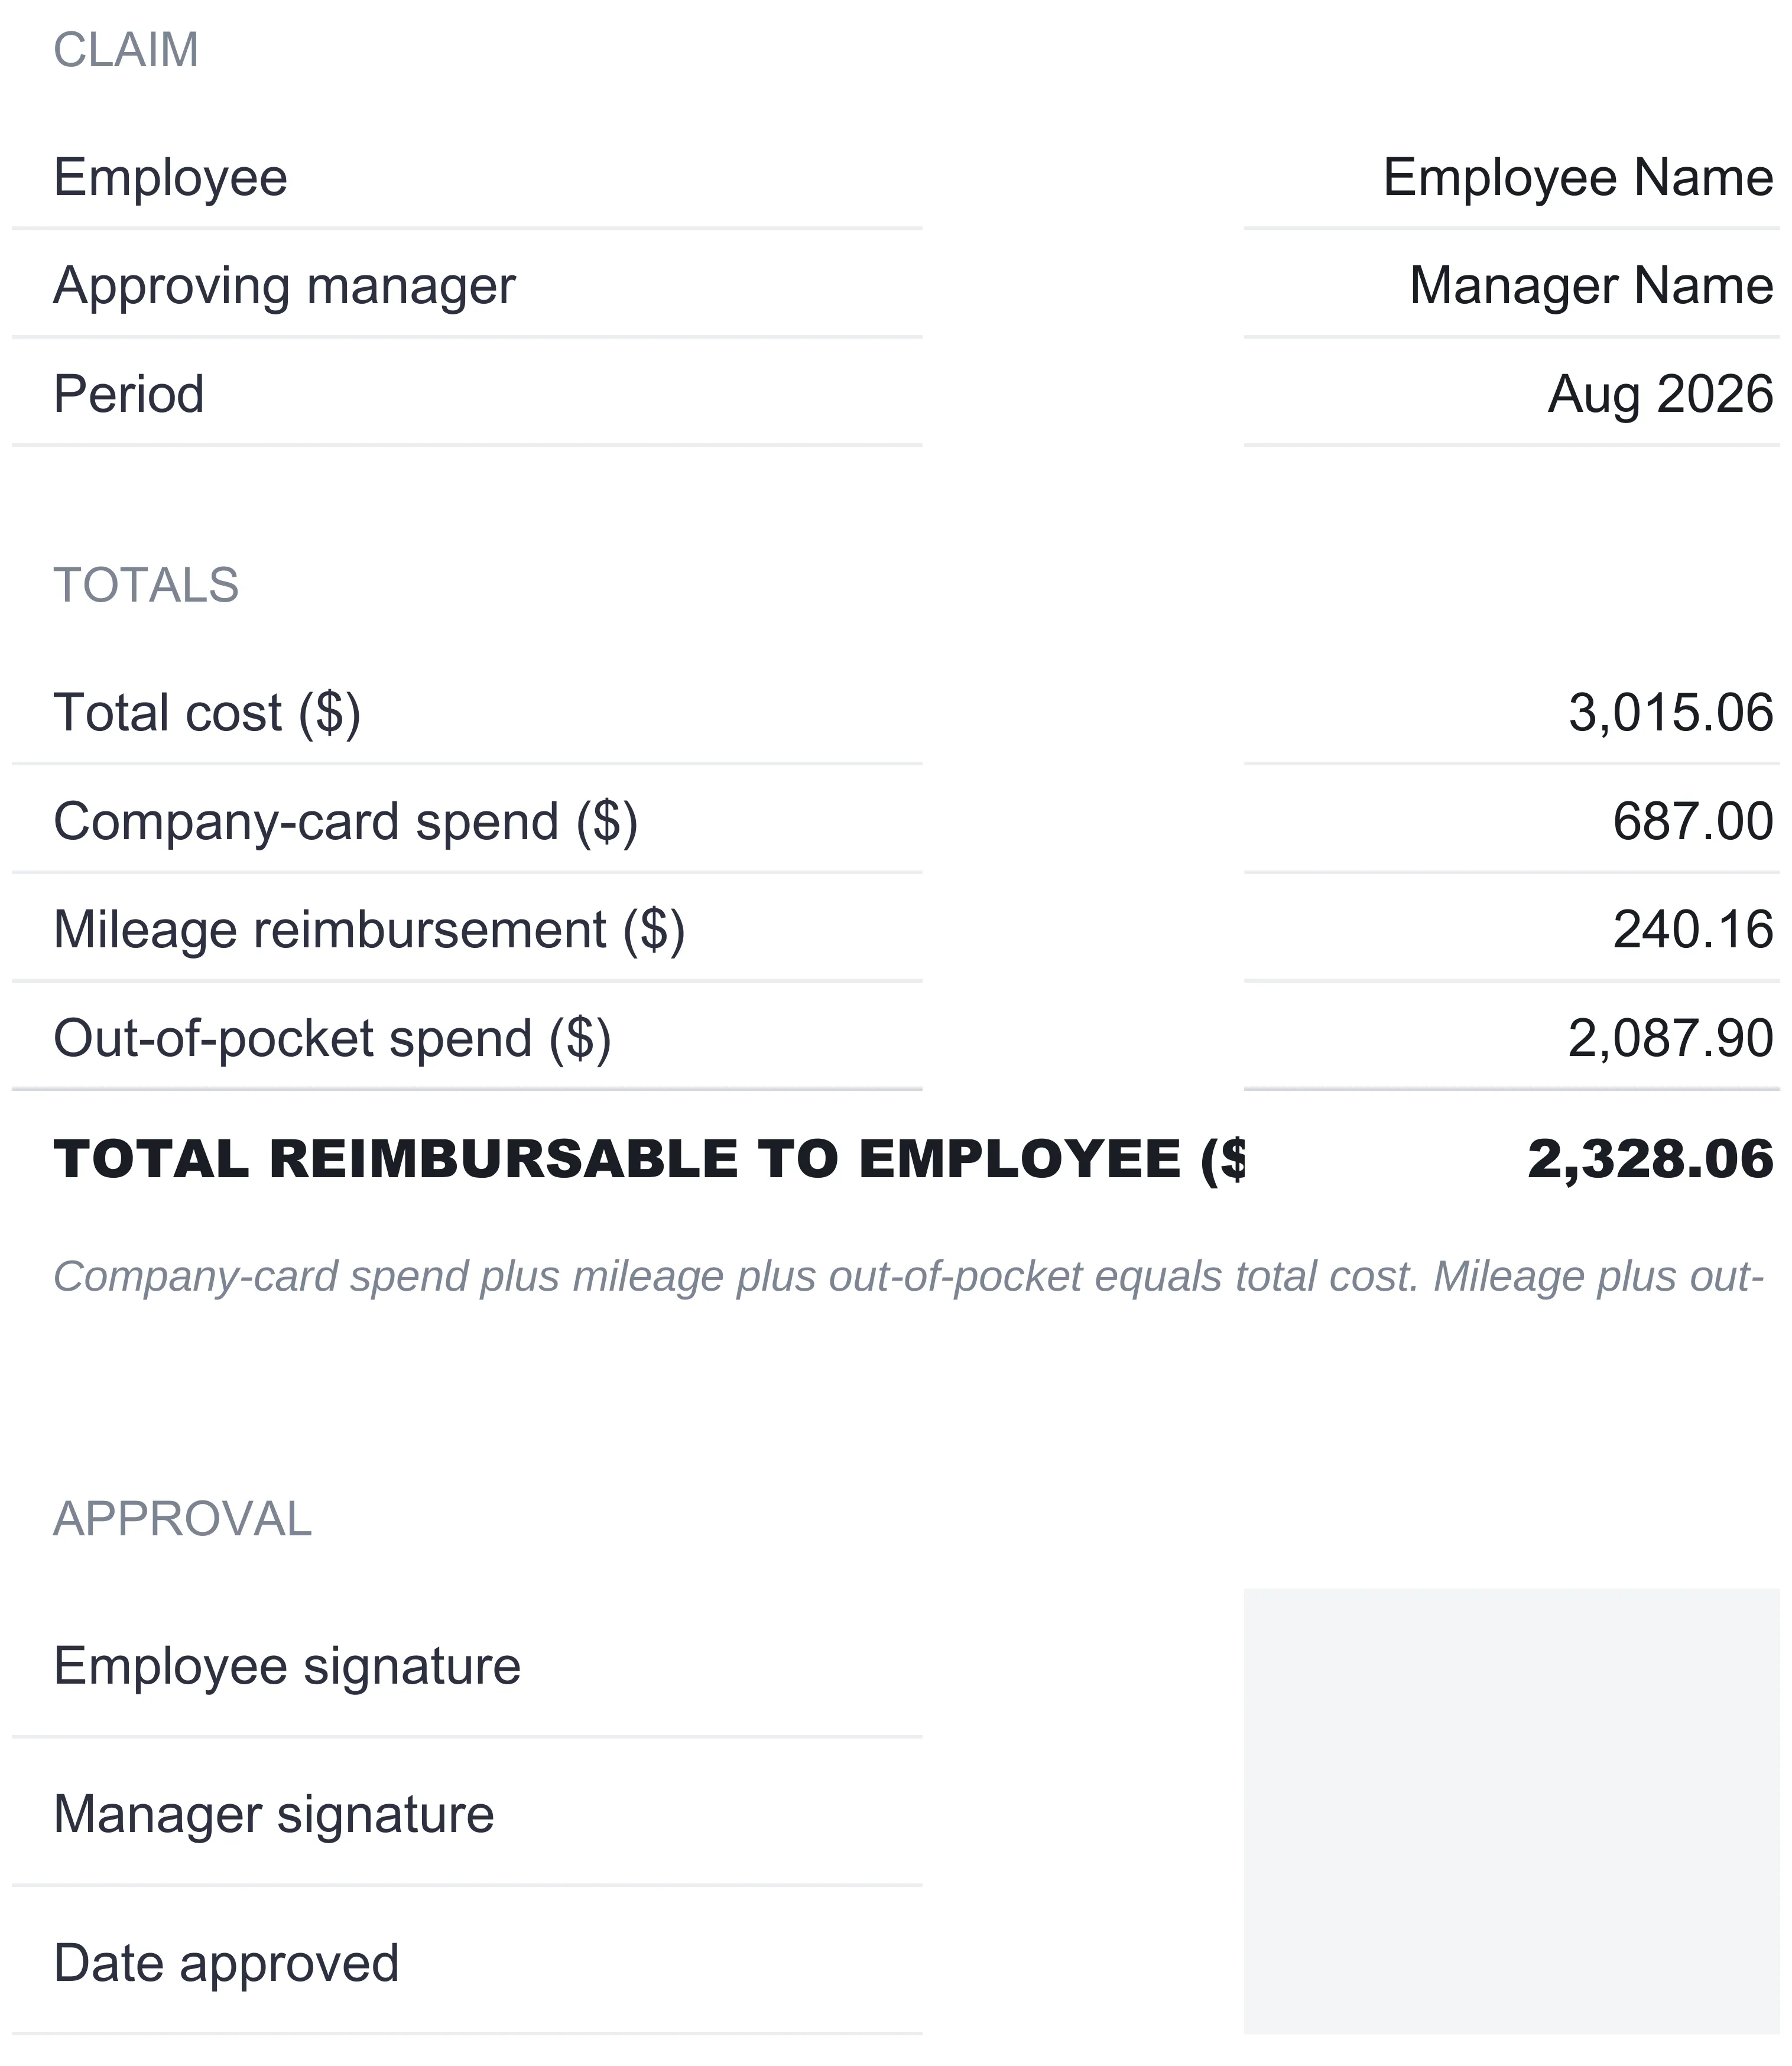
Below the totals is an approval block with lines for an employee signature, a manager signature, and the date approved. That is the whole point of the sheet: it is designed to be printed or exported as the single page that gets submitted and signed, with the working detail left behind on the other sheets.
The dashboard: the claim at a glance
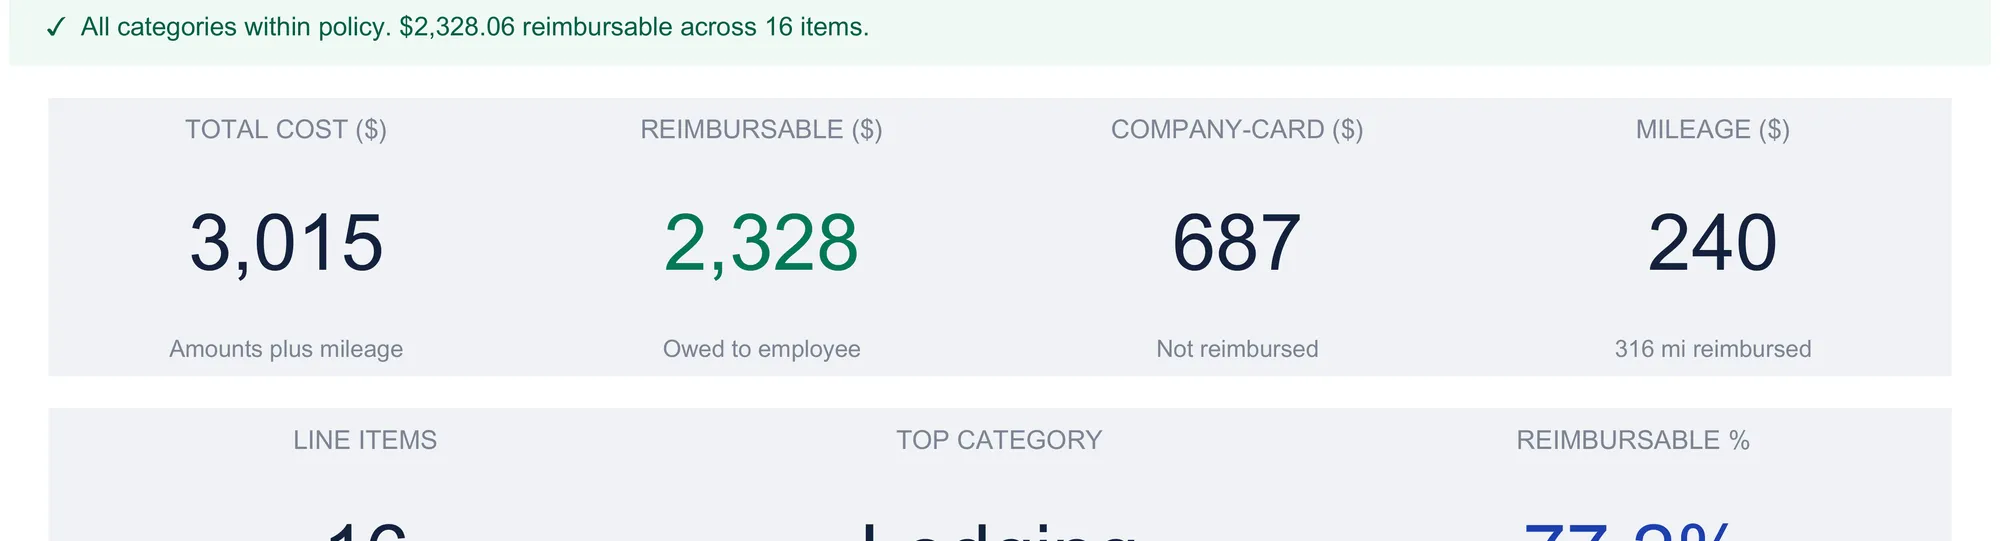
With Settings, Policy, and the log filled in, the Dashboard computes the report and states it in one screen. A status line across the top reads the whole claim in a sentence. When every category is within policy it shows a green all-clear with the reimbursable total and item count, which in the sample reads that $2,328.06 is reimbursable across 16 items. The moment any category runs over its cap, that line switches to a warning naming how many categories are over and pointing to the Summary.
Seven tiles sit below it:
| Tile | Sample value | What it means |
|---|---|---|
| Total cost | $3,015 | Amounts plus mileage |
| Reimbursable | $2,328 | Owed to the employee |
| Company-card | $687 | Already paid, not reimbursed |
| Mileage | $240 | 316 miles reimbursed |
| Line items | 16 | Expenses logged |
| Top category | Lodging | Highest cost |
| Reimbursable % | 77.2% | Share of total cost owed back |
The reimbursable percentage is the one summary number the other sheets do not spell out: $2,328.06 of reimbursable against $3,015.06 of cost is 77.2 percent, a quick read on how much of the report the business will be writing a check for versus how much it already covered on cards. Below the tiles, two charts plot cost by category and reimbursable against company-card by category, which is where the mix behind the totals becomes visible at a glance.
Reimbursable, company-card, and billable in plain terms
Three words on this report look similar and mean different things, and getting them apart is most of what an expense report is for.
Reimbursable is money owed back to the person who submitted the claim. It is out-of-pocket spend plus mileage, with company-card charges removed. In the sample it is $2,328.06.
Company-card spend is money the business already paid directly, captured on the log by setting a line’s method to Company. It is real cost, so it counts toward category totals and caps, but it is not owed to anyone. In the sample it is $687.
Billable is money that can be rebilled to a client, flagged per line and totaled on its own. It cuts across the other two: a billable expense might have been paid out of pocket or on a company card, and marking it billable changes what a client can be charged, not what the employee is owed. In the sample the billable total is $1,737.06, and it includes that company-card account dinner which reimburses the employee nothing.
The reason to separate them rather than track one running total is that each answers a question a different person asks. The employee wants the reimbursable figure. The bookkeeper wants total cost split by how it was paid. The account manager wants the billable figure. One log, typed once, produces all three.
Where an expense report meets tax time
For US businesses, how a reimbursement is taxed turns on whether it runs through what the IRS calls an accountable plan. IRS Publication 463 sets out the three tests: the expense has a business connection, the employee adequately accounts for it, and any excess is returned. Reimbursements that meet those tests are generally kept out of the employee’s income, while a plan that fails them is treated differently. The standard mileage rate the template uses for the mileage column is the federal figure described under IRS Topic 510, which a business can adopt or replace with its own rate.
What the template does here is record the raw material those rules need. The “adequate accounting” test is really a documentation test, and the log holds exactly the fields it asks for: a date, a category, a description, an amount, and a substantiated mileage figure for every line, totaled and ready to hand off. The billable and method columns add the extra context a reviewer often wants, showing which costs the business paid directly and which can be passed to a client. What the template does not do is make the call: it does not decide whether a given plan is accountable, whether a particular expense is deductible, or how the meal lines are treated. Those are judgments for a tax professional who knows the specific arrangement. Arriving at the end of a period with each expense already dated, categorized, and totaled turns that conversation into a review rather than a reconstruction.
Excel or Google Sheets for an expense report
The template is an .xlsx file built on plain formulas, with no macros and no add-ons, so it behaves the same in Microsoft Excel and in Google Sheets after an upload. The mileage lookup, the reimbursable logic, the cap flags, and the currency relabeling are all ordinary spreadsheet formulas. Google Sheets suits someone logging expenses from a phone on the road and sharing the file with an approver for sign-off; Excel suits someone who prefers a local file and a printed report. The structure described here builds the same way in either.
Which expense template fits
- Expense Report Spreadsheet Template ($19) is the workbook this walkthrough follows: the claim header and rates, the category caps, a single expense log with per-line mileage and reimbursable math, a policy-checked summary, a submittable report, and the seven-tile dashboard, ready for one claim.
- Business Bookkeeping Spreadsheet Template ($29) is where the approved numbers land next. Once a report is signed off, its categorized totals become entries in a ledger, and the bookkeeping workbook keeps a chart of accounts, a monthly rollup, and a profit-and-loss summary that builds from those transactions. The expense report is the claim; the bookkeeping file is the record it feeds.
An expense report is a job with a beginning and an end, so the value is in how little you touch it: fill the log once, and the summary, the report, and the dashboard are already written.
Related
- How to Do Bookkeeping in a Spreadsheet - where categorized expense totals become ledger entries
- How to Run Payroll Records in a Spreadsheet - the same per-person, per-period structure applied to pay
- How to Create and Track Invoices in a Spreadsheet - the client-billing side of the same small-business workflow
VERIFIED FACTS
- The workbook has seven sheets: Dashboard, Expenses, Summary, Report, Policy, Settings, and How to Use.
- It is a single-claim tool: Settings holds one employee name, one approving manager, and one report period (sample placeholders “Employee Name”, “Manager Name”, period “Aug 2026”).
- Settings holds two mileage rates and a changeover date: 0.725 (72.5 cents) per mile before 1 Jul 2026, 0.760 (76 cents) from 1 Jul 2026, changeover date 2026-07-01; a note cites these as the 2026 IRS standard business figures and says they can be overwritten.
- Settings has a currency symbol dropdown with 35 options (default ”$”); changing it relabels money columns and dashboard tiles across the workbook for display only, with no number conversion.
- Policy lists 7 named categories with caps per report: Travel 3,000; Lodging 4,000; Meals 1,500; Supplies 1,000; Software 1,200; Client entertainment 2,000; Other 800. Three blank category rows exist (ten slots total). Caps are per report and cover full category cost including mileage.
- Renaming a Policy category moves already-logged lines under the old name to an Uncategorised row until re-picked; the names drive the Expenses Category dropdown and the Summary rows.
- Expenses log has 10 columns: Date, Category, Description, Amount, Method, Miles, Mileage ($), Billable, Reimbursable ($), Notes. It has 40 data rows (rows 7-46); 16 are logged in the sample.
- Mileage formula (in words): miles × (rate-before if trip date is before the changeover date, else rate-from), rounded to 2 decimals. Reimbursable formula: (0 if method = Company, else amount) + that line’s mileage, rounded to 2 decimals.
- Category and Method and Billable are dropdowns; tinted cells are inputs, formulas fill the rest; blank rows are pre-wired into totals.
- Sample expense lines include: Flight - client kickoff, Travel, $420, Personal, reimbursable $420; Drive to airport, Travel, 64 miles, mileage $48.64; Team lunch, Meals, $86, Company, reimbursable $0; Account dinner, Client entertainment, $312, Company, reimbursable $0, billable Yes; Mileage - regional visits, 188 miles, mileage $142.88; Return drive, 64 miles, mileage $48.64.
- Expenses Totals row: Amount sum $2,774.90; Miles sum 316; Mileage sum $240.16; Reimbursable sum $2,328.06.
- Summary by category (cost / reimbursable / items): Travel 718.56 / 718.56 / 5; Lodging 1,155.00 / 1,155.00 / 2; Meals 309.25 / 223.25 / 3; Supplies 313.25 / 73.25 / 2; Software 169.00 / 120.00 / 2; Client entertainment 312.00 / 0.00 / 1; Other 38.00 / 38.00 / 1. Total cost 3,015.06, reimbursable 2,328.06, 16 items.
- Summary Cost = amount + that line’s mileage, so Cost minus Reimbursable = the category’s company-card share; every category reads OK in the sample (none Over cap), Lodging closest at 1,155 vs 4,000 cap.
- Summary also shows: Total miles 316; Mileage reimbursement $240.16; Billable to client $1,737.06 (cost of lines marked Billable, whoever paid, separate from reimbursement); Total reimbursable $2,328.06.
- Report sheet totals: Total cost 3,015.06; Company-card spend 687.00; Mileage reimbursement 240.16; Out-of-pocket spend 2,087.90; Total reimbursable to employee 2,328.06. Identities hold: company-card + mileage + out-of-pocket = total cost; mileage + out-of-pocket = reimbursed.
- Company-card spend $687 = sum of Amount where Method = Company (team lunch 86 + design tool 49 + account dinner 312 + booth supplies 240 = 687).
- Report sheet has an approval block: employee signature, manager signature, date approved lines.
- Dashboard status line: green all-clear when no category is over cap (“All categories within policy. $2,328.06 reimbursable across 16 items.”); switches to a warning counting categories over cap otherwise.
- Dashboard tiles: Total cost $3,015 (amounts plus mileage); Reimbursable $2,328 (owed to employee); Company-card $687 (not reimbursed); Mileage $240 (316 mi reimbursed); Line items 16; Top category Lodging (highest cost); Reimbursable % 77.2% (2,328.06 / 3,015.06 of total cost).
- Dashboard has two charts: Cost by Category, and Reimbursable vs Company-card by Category.
- No macros or add-ons; plain-formula .xlsx that runs in both Microsoft Excel and Google Sheets. Product is the Expense Report Spreadsheet Template, $19.
Frequently asked questions
How does the template calculate mileage reimbursement?
Each expense line multiplies its miles by a per-mile rate, and it picks the rate from the trip date. The Settings sheet holds two rates and the date they change over, so a trip before the changeover uses one rate and a trip after it uses the other. The sample ships with the 2026 IRS standard business figures, 72.5 cents per mile through 30 June and 76 cents from 1 July, and those cells can be overwritten with a company's own rate. Mileage is added back whatever the payment method.
Can one file cover a whole team's expenses?
The workbook is built around a single claim: Settings holds one employee name, one approving manager, and one report period, and the Report sheet prints that one person's totals with sign-off lines. A second person, or a second month, is a fresh copy of the file. Businesses that need every claim in one place tend to keep the reports as the submission layer and post the approved totals into a bookkeeping ledger.
What happens when a category goes over its policy cap?
The Policy sheet sets a cap per report for each category, and the Summary compares each category's cost against its cap. A category within its cap reads OK; one above it reads Over cap, and the Dashboard status line switches from a green all-clear to a count of how many categories are over. The cap covers the full cost of the category, mileage included. In the worked example every category is within its cap, so the status line shows the all-clear.
Does marking an expense billable change what gets reimbursed?
No. Billable and reimbursable are tracked separately. Billable marks a line that can be rebilled to a client, and the Summary totals those lines whoever paid for them. Reimbursable is what the employee is owed back. A dinner charged to a company card can be billable to a client while reimbursing the employee nothing, which is exactly what happens with the sample account dinner: it counts toward the $1,737.06 billable total but adds nothing to the reimbursement.
Are reimbursed business expenses taxable to the employee?
In the US it depends on whether the reimbursement runs through an accountable plan, which requires a business connection, adequate substantiation of each expense, and the return of any excess. Reimbursements that meet those rules are generally excluded from the employee's income. IRS Publication 463 covers accountable plans in detail, and a tax professional can confirm how a specific arrangement is treated. The template records the substantiation, the dates, the amounts, and the categories, but it does not decide the tax treatment.
Sources
- Publication 463 (2025), Travel, Gift, and Car Expenses - Internal Revenue Service
- Topic no. 510, Business use of car - Internal Revenue Service
About this article
Every figure, column name, formula, and feature description checked on 2026-09-10 against the shipped Expense Report Premium workbook (Dashboard, Expenses, Summary, Report, Policy, Settings and How to Use sheets) and the screenshots in this article. Publication 463 and Topic 510 references checked against the live IRS pages at writing time. Last reviewed September 2026.