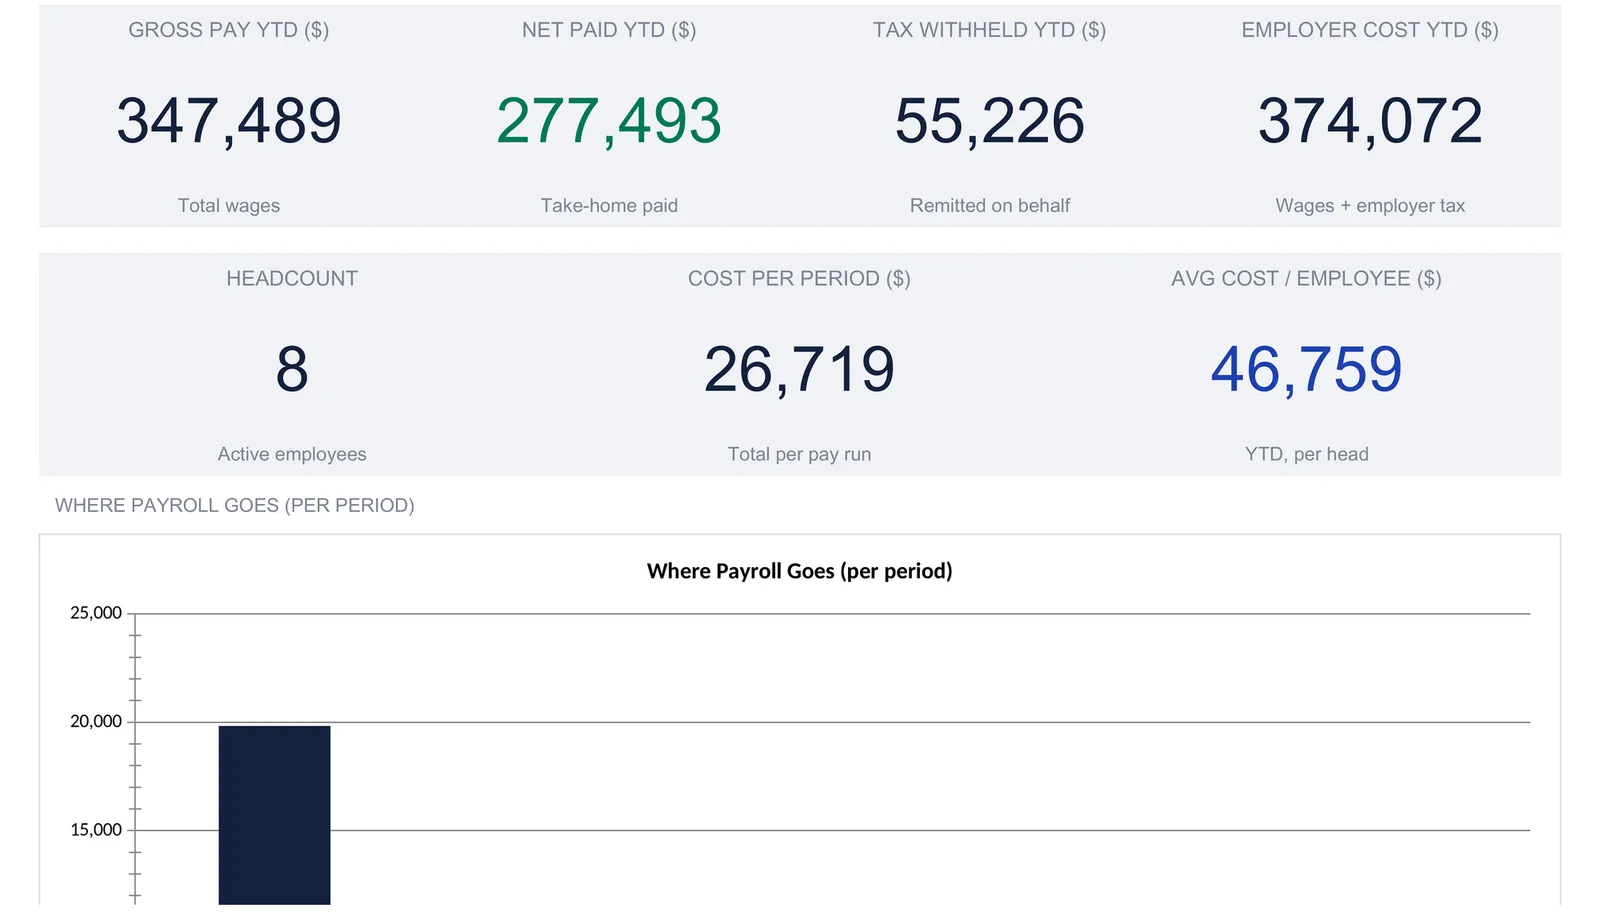
A payroll spreadsheet keeps a roster of employees, runs a single pay period from gross to net pay, and derives everything else from it: employer cost, year-to-date totals, and a printable pay stub. This walkthrough follows the full structure with a worked example, a team of 8 with $26,719 in total cost per pay run and $374,072 in employer cost year-to-date. Our Payroll Tracker Spreadsheet Template ($29) ships the same structure ready-made for Excel and Google Sheets.
Payroll is the bill a small business pays most often and understands least well. The number that lands in each person’s bank account is only a fraction of what the pay run costs, because withholding comes out of one side and employer taxes go on the other. Most owners can say what they paid out last period. Far fewer can say, without digging, what the same period cost the business once the employer’s share is counted, or what the whole team has cost so far this year. The gap between those questions is structure, and a spreadsheet closes it neatly.
That structure is four pieces: a short list of payroll constants, a roster of who is on the payroll, one pay period worked from gross down to net, and the totals that fall out of it. The examples below come from our Payroll Tracker Spreadsheet Template ($29), which ships the whole thing ready-made for Excel and Google Sheets. Everything it does is reproducible by hand if you would rather build your own payroll spreadsheet from scratch.
What a payroll spreadsheet has to hold
Strip away the software and payroll records come down to four kinds of data:
- Payroll constants. The handful of settings that apply to every person and every run: how many pay periods the year has, how many have already happened, and the employer’s payroll-tax rate.
- A roster. One row per employee with the facts that rarely change: role, whether they are salaried or hourly, the pay rate, the standard hours in a period, and a withholding percentage.
- A single pay period. The current run, where gross, deductions, tax withheld, net pay, and the employer’s cost are computed for each person.
- Derived totals. Year-to-date figures per employee, a printable pay stub, and the dashboard. These are calculations, not entries; in a well-built sheet, nothing here is ever typed.
The tracker gives each of these its own sheet. Settings holds the constants, Employees holds the roster, Payroll runs the period, and YTD, Pay stub, and Dashboard read back from those. A How to Use sheet carries the instructions. Seven tabs in total, and the walkthrough below follows them in the order the work happens.
Start with the constants: the Settings sheet
Three payroll numbers on the Settings sheet drive every calculation downstream, so they come first.
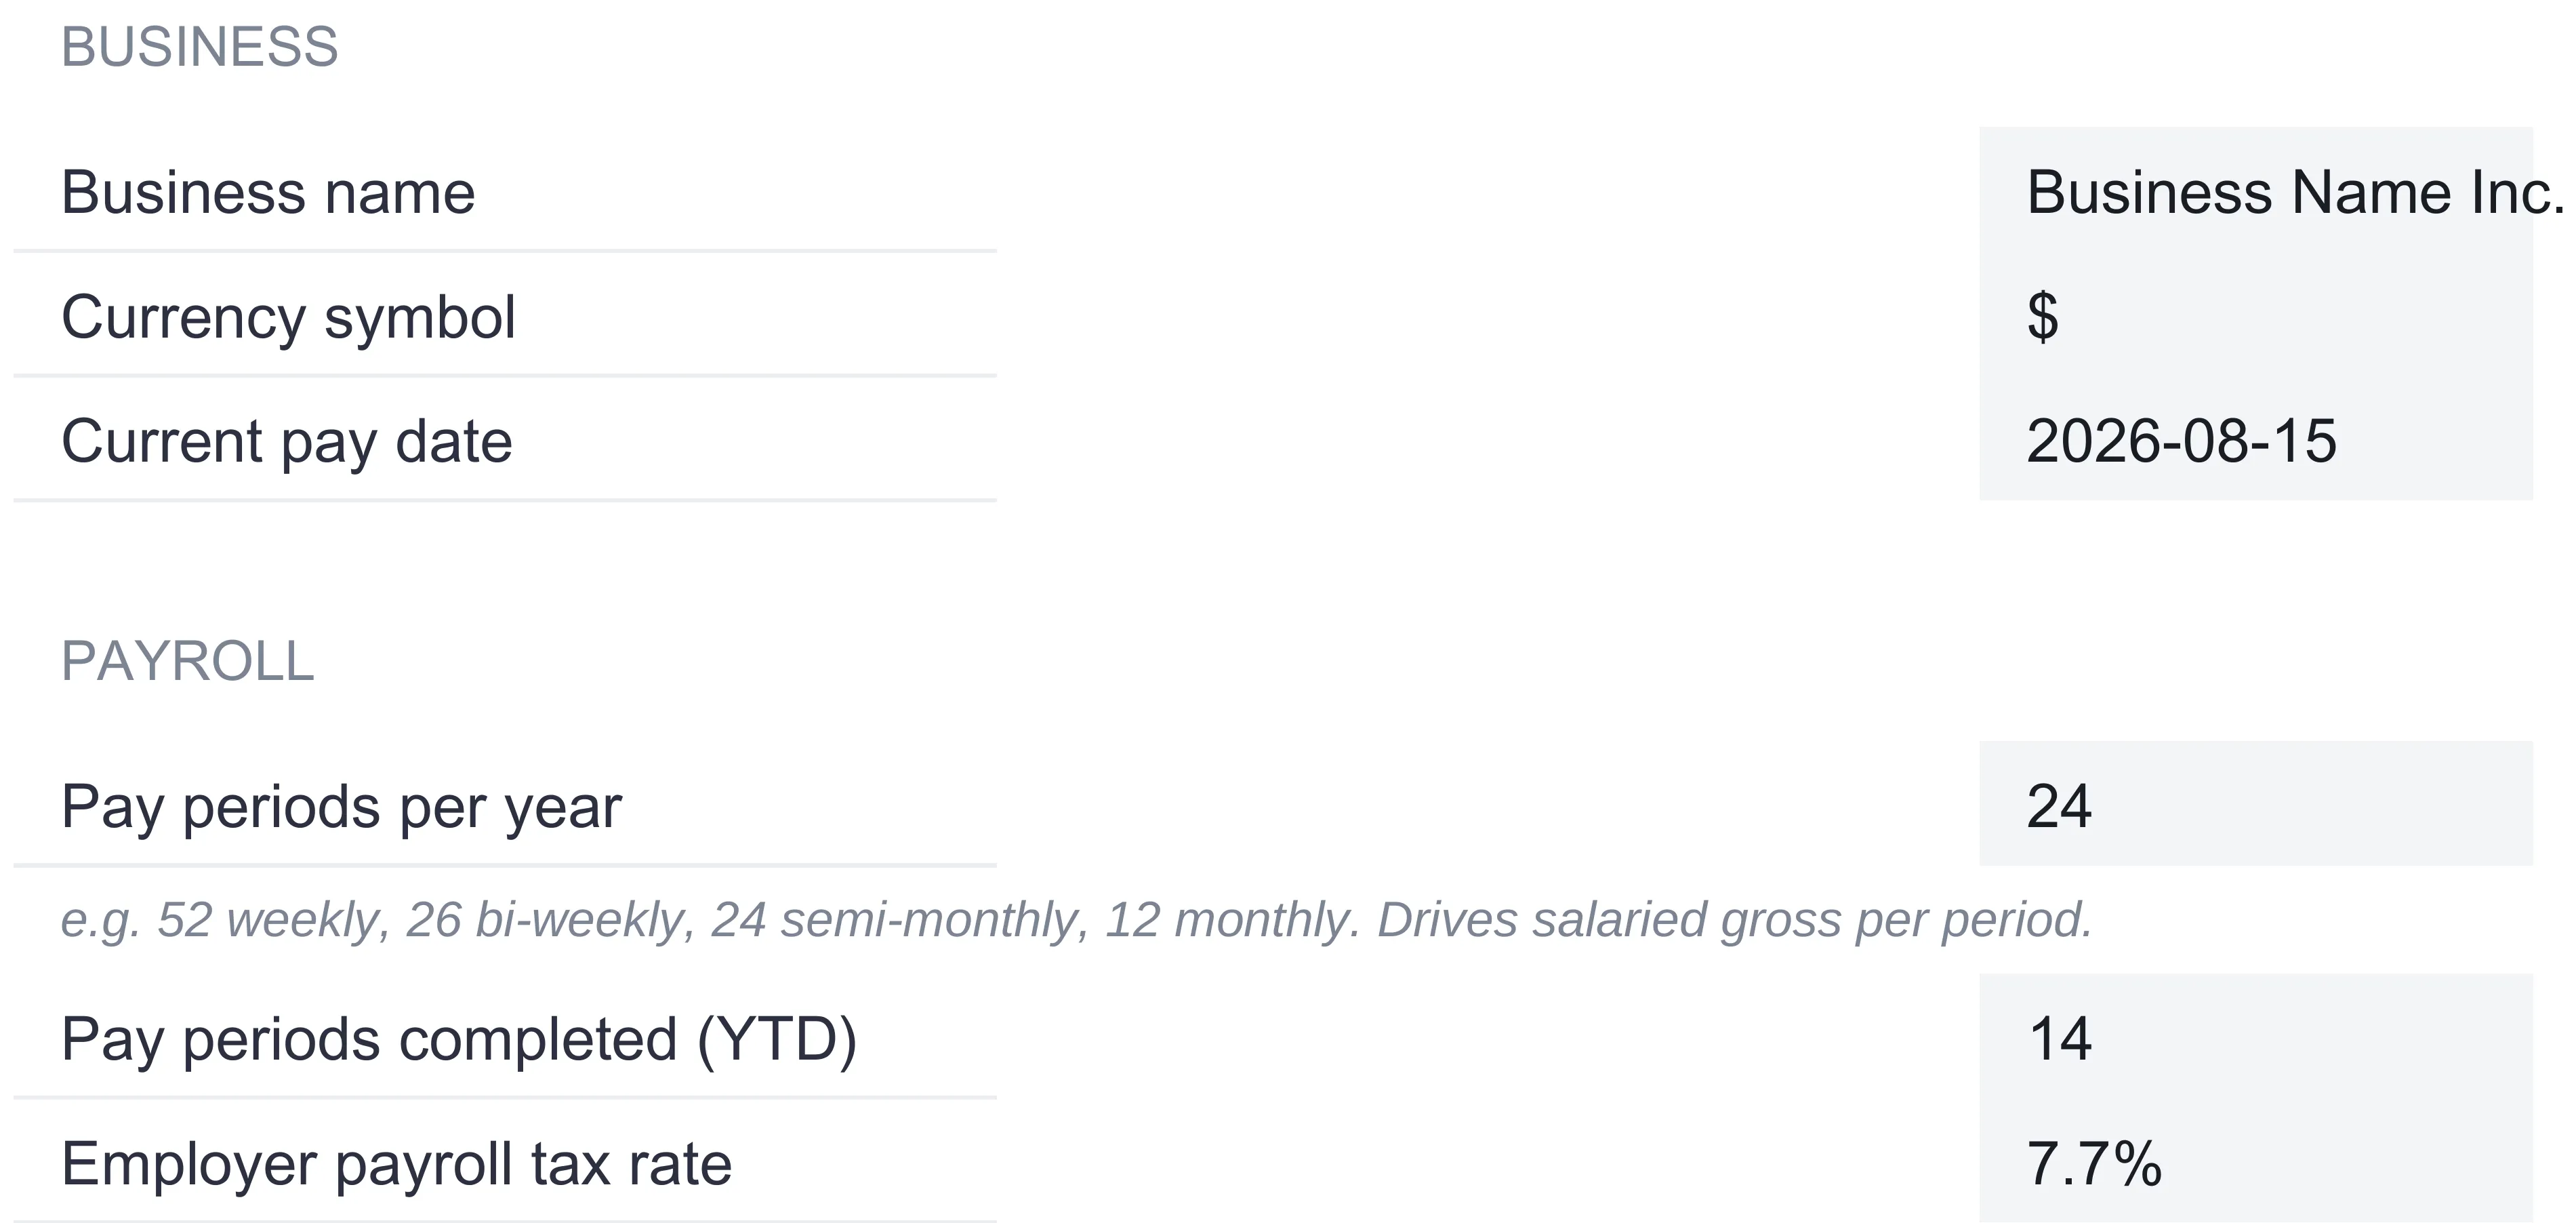
Pay periods per year. This sets the salaried rhythm. The sample uses 24, a semi-monthly schedule, and the sheet notes the common alternatives right beside the cell: 52 weekly, 26 bi-weekly, 24 semi-monthly, 12 monthly. This one number divides every annual salary into a per-period figure, so changing it re-bases the whole payroll at once.
Pay periods completed year-to-date. The sample sits at 14, meaning 14 runs have happened so far this year. This is the multiplier the YTD sheet uses, and it is the one figure that changes on a schedule: raise it by one after each run.
Employer payroll tax rate. One flat rate applied to gross pay, on top of wages, 7.65 percent in the sample (the sheet displays it rounded to 7.7 percent). The tracker states plainly what it does not do here: no wage-base cap and no threshold band are applied, so the rate stays flat on every dollar of gross. That keeps the model simple and transparent, and it is also why the employer figure is a planning number rather than a filing number.
The sheet also holds the business name, the current pay date that prints on the stub, and a currency selector offering 35 symbols. Changing the symbol relabels every money column and KPI across the workbook. It relabels only, with no conversion of the underlying numbers.
Build the roster: the Employees sheet
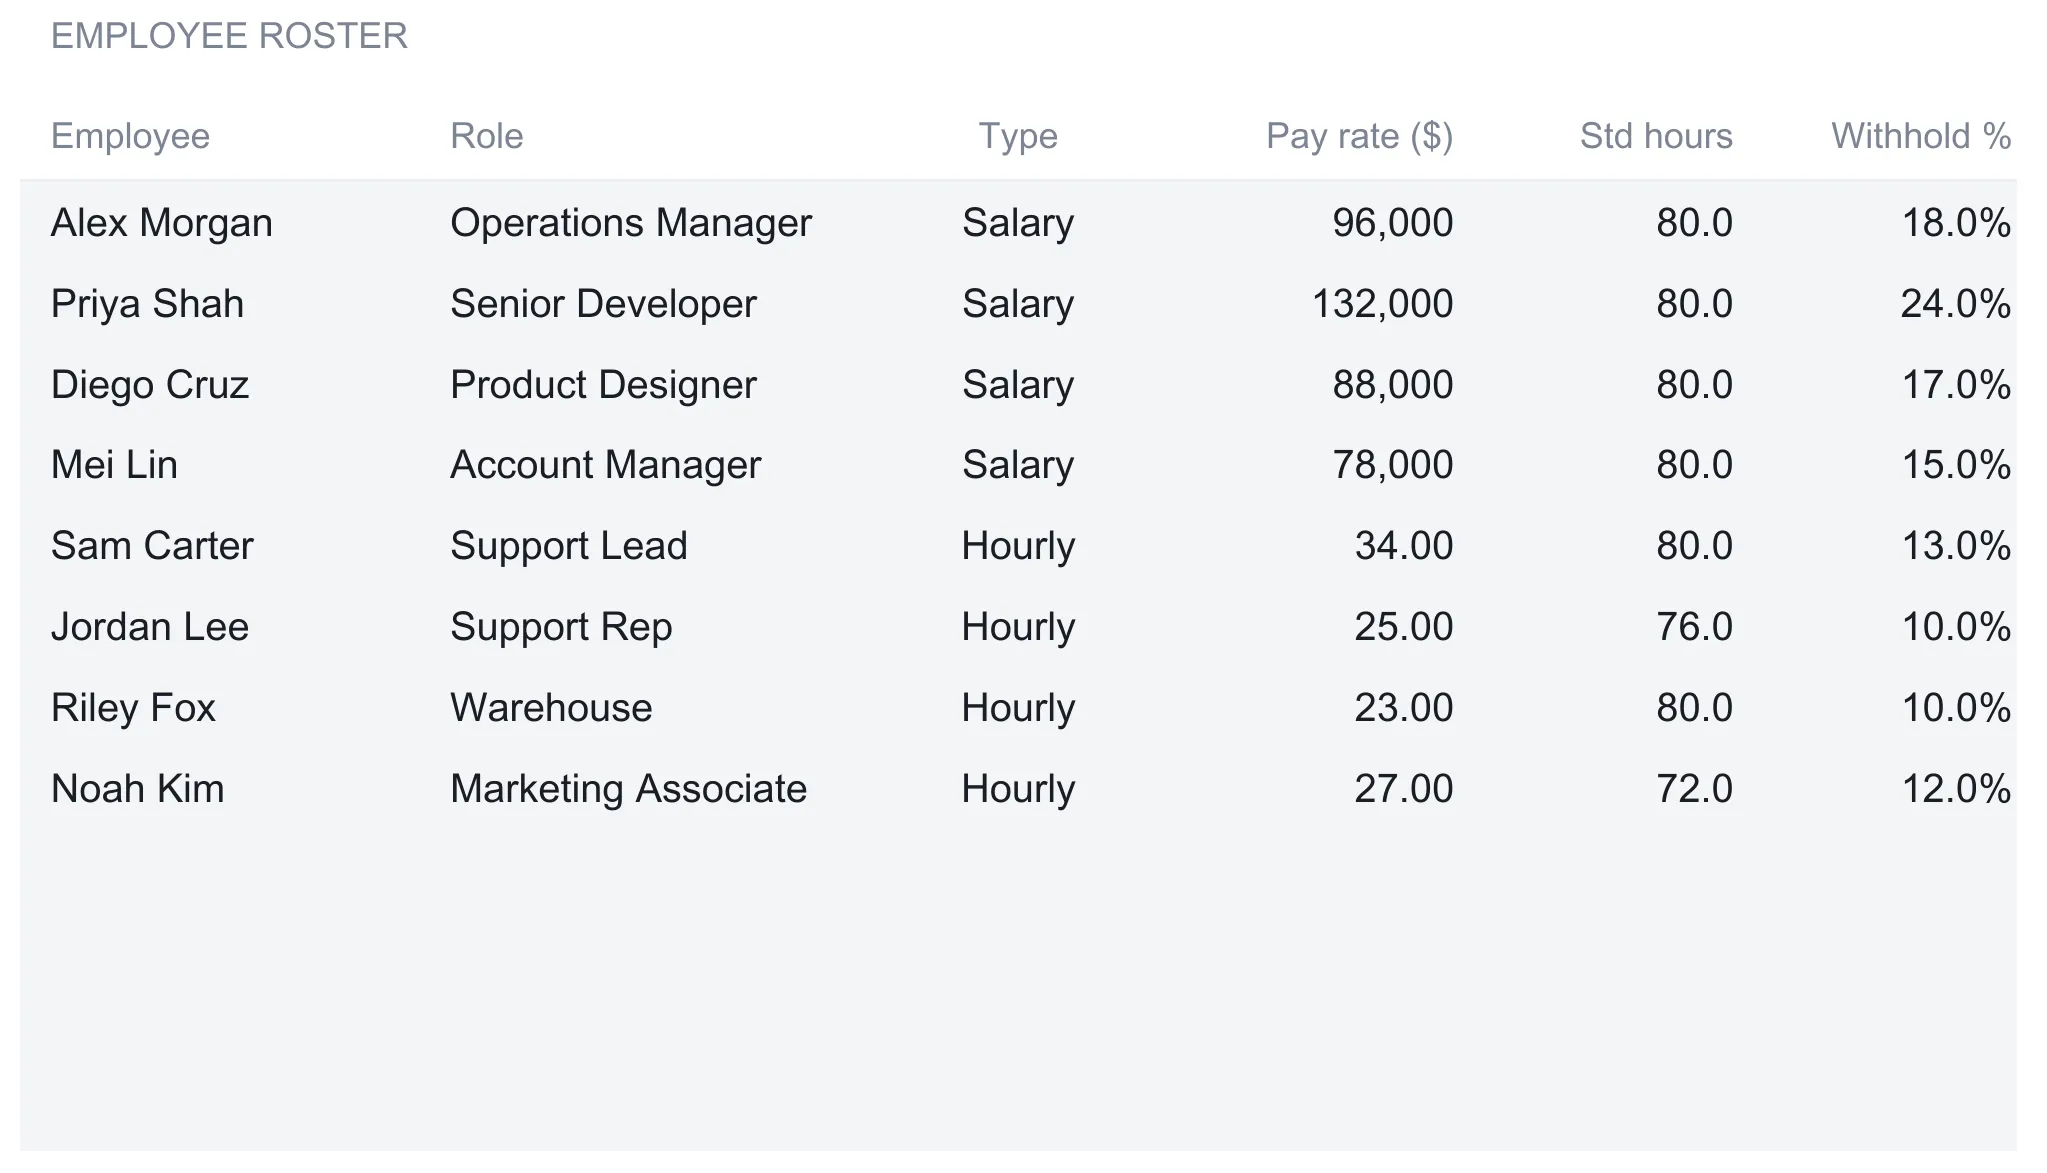
The roster is where each person is described once. Six columns hold the facts that stay put between runs: name, role, type, pay rate, standard hours, and a withholding percentage. The sample carries eight people, a mix of salaried staff and hourly workers:
| Employee | Role | Type | Pay rate ($) | Std hours | Withhold % |
|---|---|---|---|---|---|
| Alex Morgan | Operations Manager | Salary | 96,000 | 80 | 18% |
| Priya Shah | Senior Developer | Salary | 132,000 | 80 | 24% |
| Diego Cruz | Product Designer | Salary | 88,000 | 80 | 17% |
| Mei Lin | Account Manager | Salary | 78,000 | 80 | 15% |
| Sam Carter | Support Lead | Hourly | 34.00 | 80 | 13% |
| Jordan Lee | Support Rep | Hourly | 25.00 | 76 | 10% |
| Riley Fox | Warehouse | Hourly | 23.00 | 80 | 10% |
| Noah Kim | Marketing Associate | Hourly | 27.00 | 72 | 12% |
The type tag does real work. For a salaried row the pay rate is an annual figure, and for an hourly row it is a rate per hour, so the same column means two different things depending on the tag beside it. Standard hours is the baseline week the pay run starts from. Withholding is a single flat percentage per person, and the sheet is careful to label it as exactly that: one flat rate on taxable pay, not a bracket table.
Below the eight filled rows sit four blank ones. They are not decorative. Each spare row is already wired into Payroll, YTD, the totals, and both dashboard charts, so a new hire typed into one of them flows through the entire workbook with no formula to edit. That is the design detail worth copying into any payroll spreadsheet you build by hand, because the place these files usually break is a name added to the roster but missed by a total somewhere downstream.
Those four spares also set the workbook’s built-in size: eight filled rows plus four blank ones is a roster of up to twelve people before any formula has to be stretched. A larger team is still possible, but it means copying the pattern down into fresh rows and widening the total ranges to match, which is exactly the kind of manual surgery the spare rows exist to avoid for a small team. For a business hovering around a dozen employees the tracker fits as delivered; for one growing well past that, the arithmetic stays the same but the file starts asking for maintenance.
Run the period: the Payroll sheet
The Payroll sheet is where a single pay run comes together. It reads the roster and lays out eleven columns per person, most of them computed. Three matter before any others.
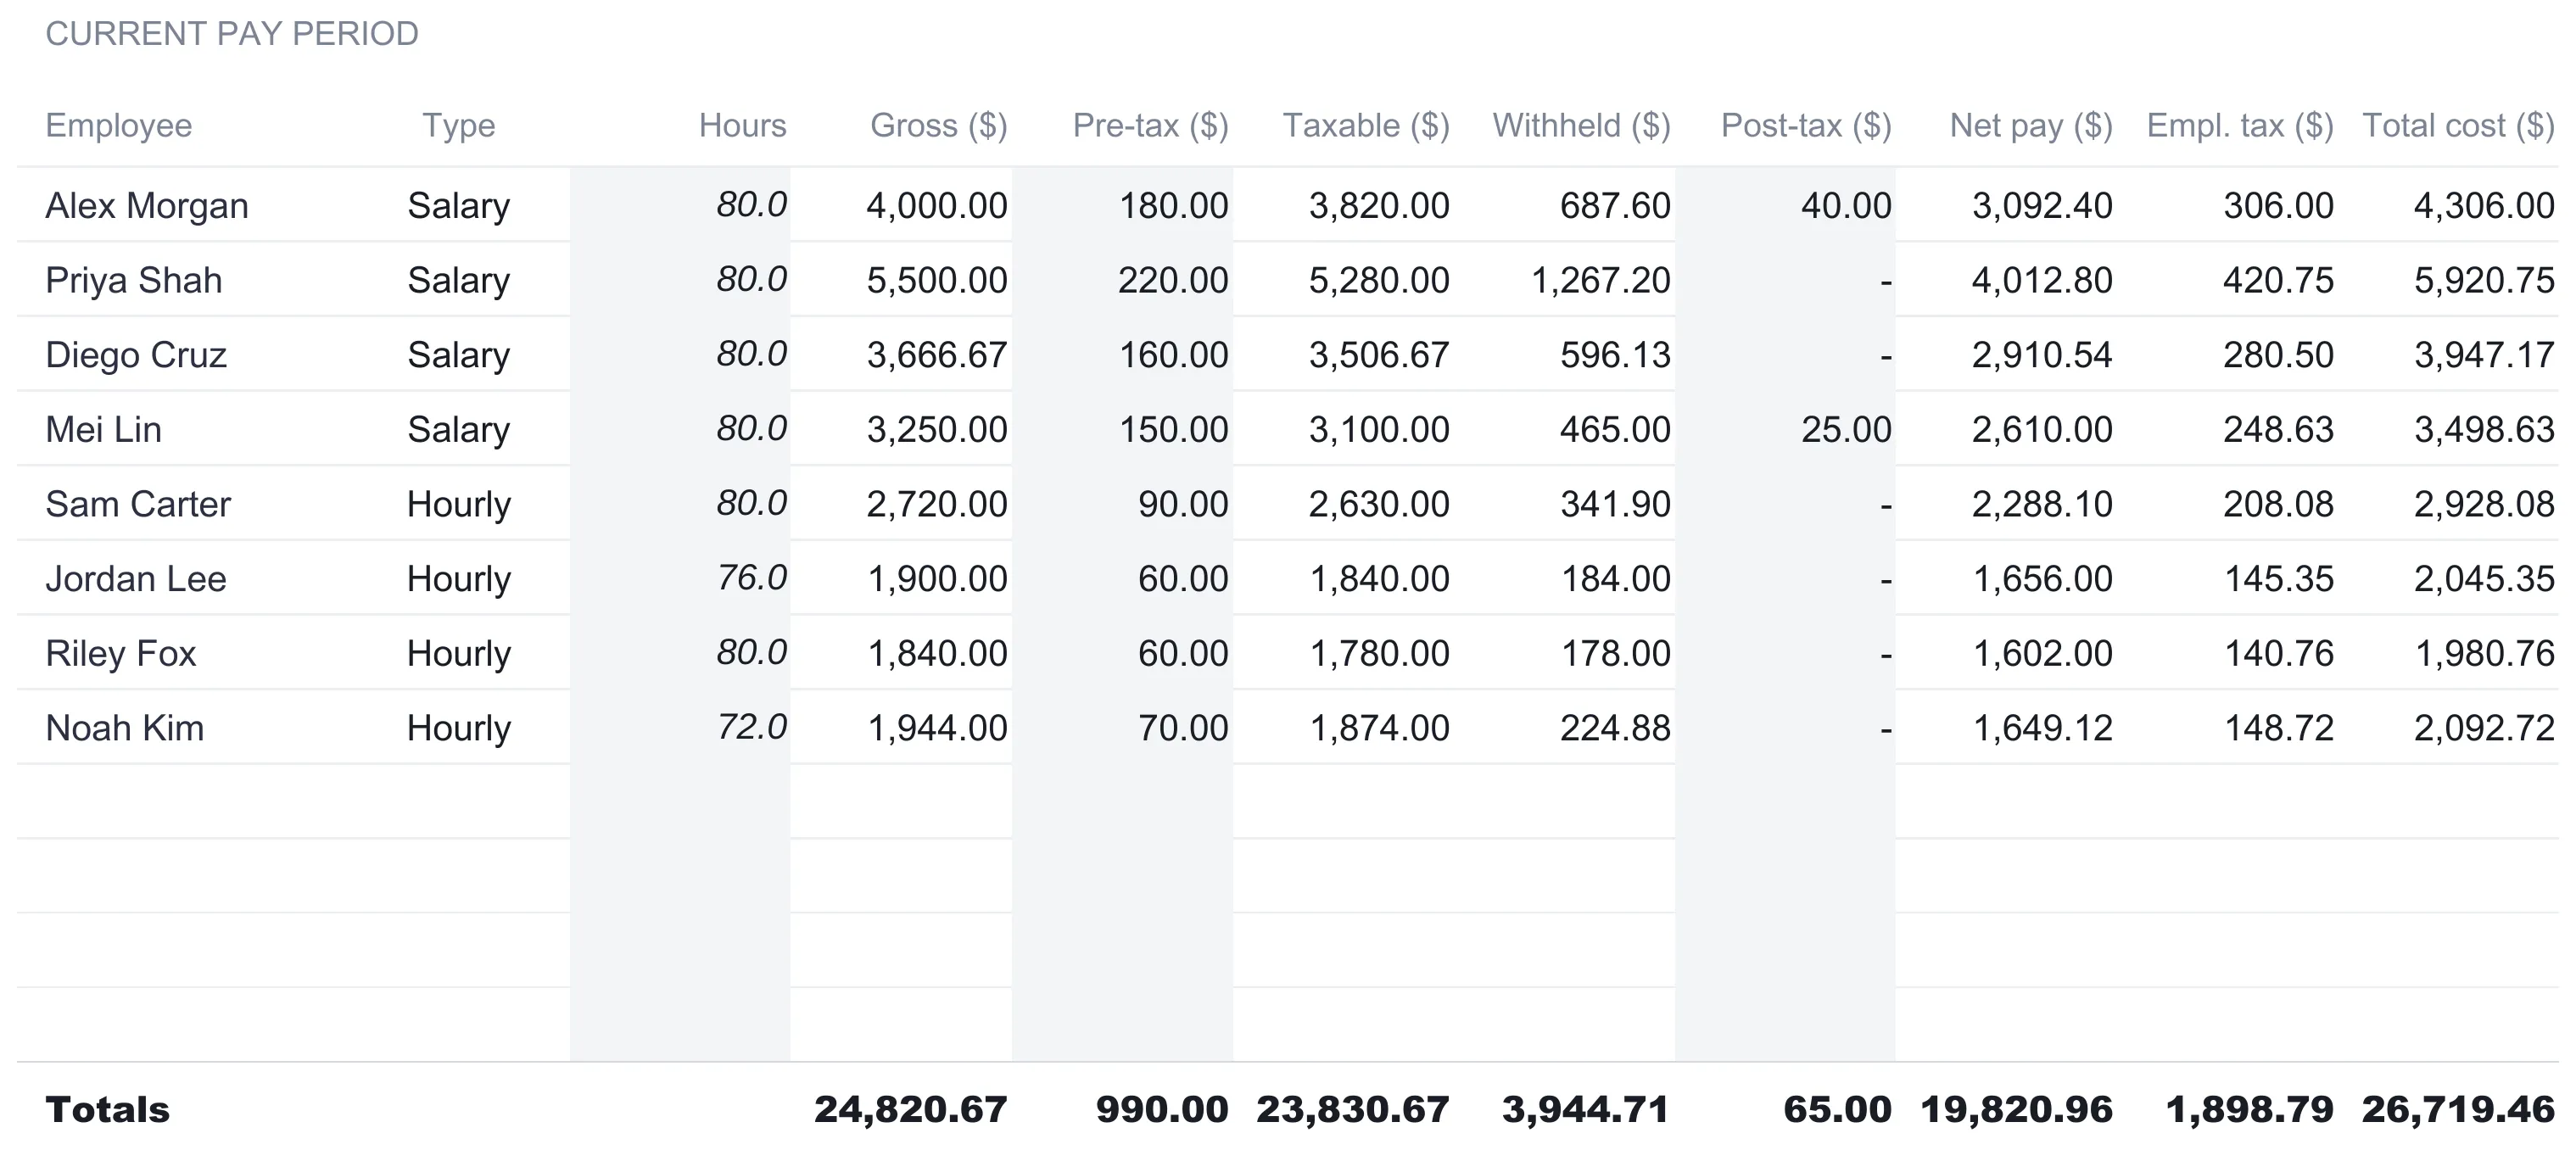
Gross pulls straight from the roster. For a salaried person it is the annual pay rate divided by the pay periods per year, so Alex Morgan’s $96,000 at 24 periods is exactly $4,000 of gross. For an hourly person it is the pay rate times the hours in the period, so Sam Carter’s 80 hours at $34 is $2,720. The hours cell is seeded from standard hours on the roster and shown in italic, which is the sheet’s signal that the value is prefilled and still yours to type over for a period with overtime or a short week.
Taxable is gross minus any pre-tax deductions. Pre-tax items, a retirement contribution or a pre-tax benefit, come out before withholding is figured, so they shrink the base the withholding percentage applies to. Alex’s $4,000 gross less $180 in pre-tax deductions leaves $3,820 of taxable pay.
Withheld is taxable times that person’s withholding percentage. Alex’s $3,820 at 18 percent is $687.60. This is money taken out of the employee’s own pay, not an added cost to the business.
From there the row finishes in two directions. Net pay is what the person actually receives: gross minus pre-tax deductions, minus tax withheld, minus any post-tax deductions. For Alex that is $4,000 less $180, less $687.60, less $40, which lands at $3,092.40. Employer tax runs the other way, computed on gross at the Settings rate: $4,000 × 7.65 percent is $306. Total cost is gross plus that employer tax, so Alex costs the business $4,306 for the period even though the paycheck reads $3,092.40. The two numbers differ by roughly $1,200, and that spread is the whole reason to separate them.
One row across, from the sample run:
| Column | Alex Morgan | In words |
|---|---|---|
| Gross | $4,000.00 | Salary ÷ 24 pay periods |
| Pre-tax | $180.00 | Typed, comes out before tax |
| Taxable | $3,820.00 | Gross - pre-tax |
| Withheld | $687.60 | Taxable × 18% |
| Post-tax | $40.00 | Typed, comes out after tax |
| Net pay | $3,092.40 | Gross - pre-tax - withheld - post-tax |
| Empl. tax | $306.00 | Gross × 7.65% |
| Total cost | $4,306.00 | Gross + employer tax |
Run that logic down all eight people and the totals read $24,820.67 in gross, $3,944.71 in tax withheld, $990 in pre-tax and $65 in post-tax deductions, $19,820.96 paid out as net, and $1,898.79 in employer tax, for a total cost of $26,719.46 for the period. Every figure is rounded to the cent, so each column adds up to the total printed under it rather than drifting by a penny.
The eleven columns are arranged so the story reads left to right. Employee and type come from the roster, hours and gross open the money, the three deduction and tax columns work the middle, and net pay, employer tax, and total cost close it out. The pre-tax and post-tax columns are the only two that are purely typed each period; everything to their right recalculates the moment a figure changes. That layout also makes an error easy to spot, because a number that looks wrong can be traced one column at a time back to the roster figure it came from, rather than hidden inside a single combined formula.
What the Payroll sheet does not do is fill itself. There is no bank feed and no time-clock import, so hours for an hourly week are typed in, and the deductions are entered per person. For a team of eight on a steady schedule that is a few minutes a period, since the standard hours prefill and only the exceptions need touching. For a larger or more variable payroll it is real work, which is what dedicated payroll software exists to remove. The trade is the familiar one: a connected service suits a business that wants filings and deposits handled for it, while a spreadsheet suits one that wants to see every formula, change any of them, and keep the file on its own machine.
One employee’s slip: the Pay stub
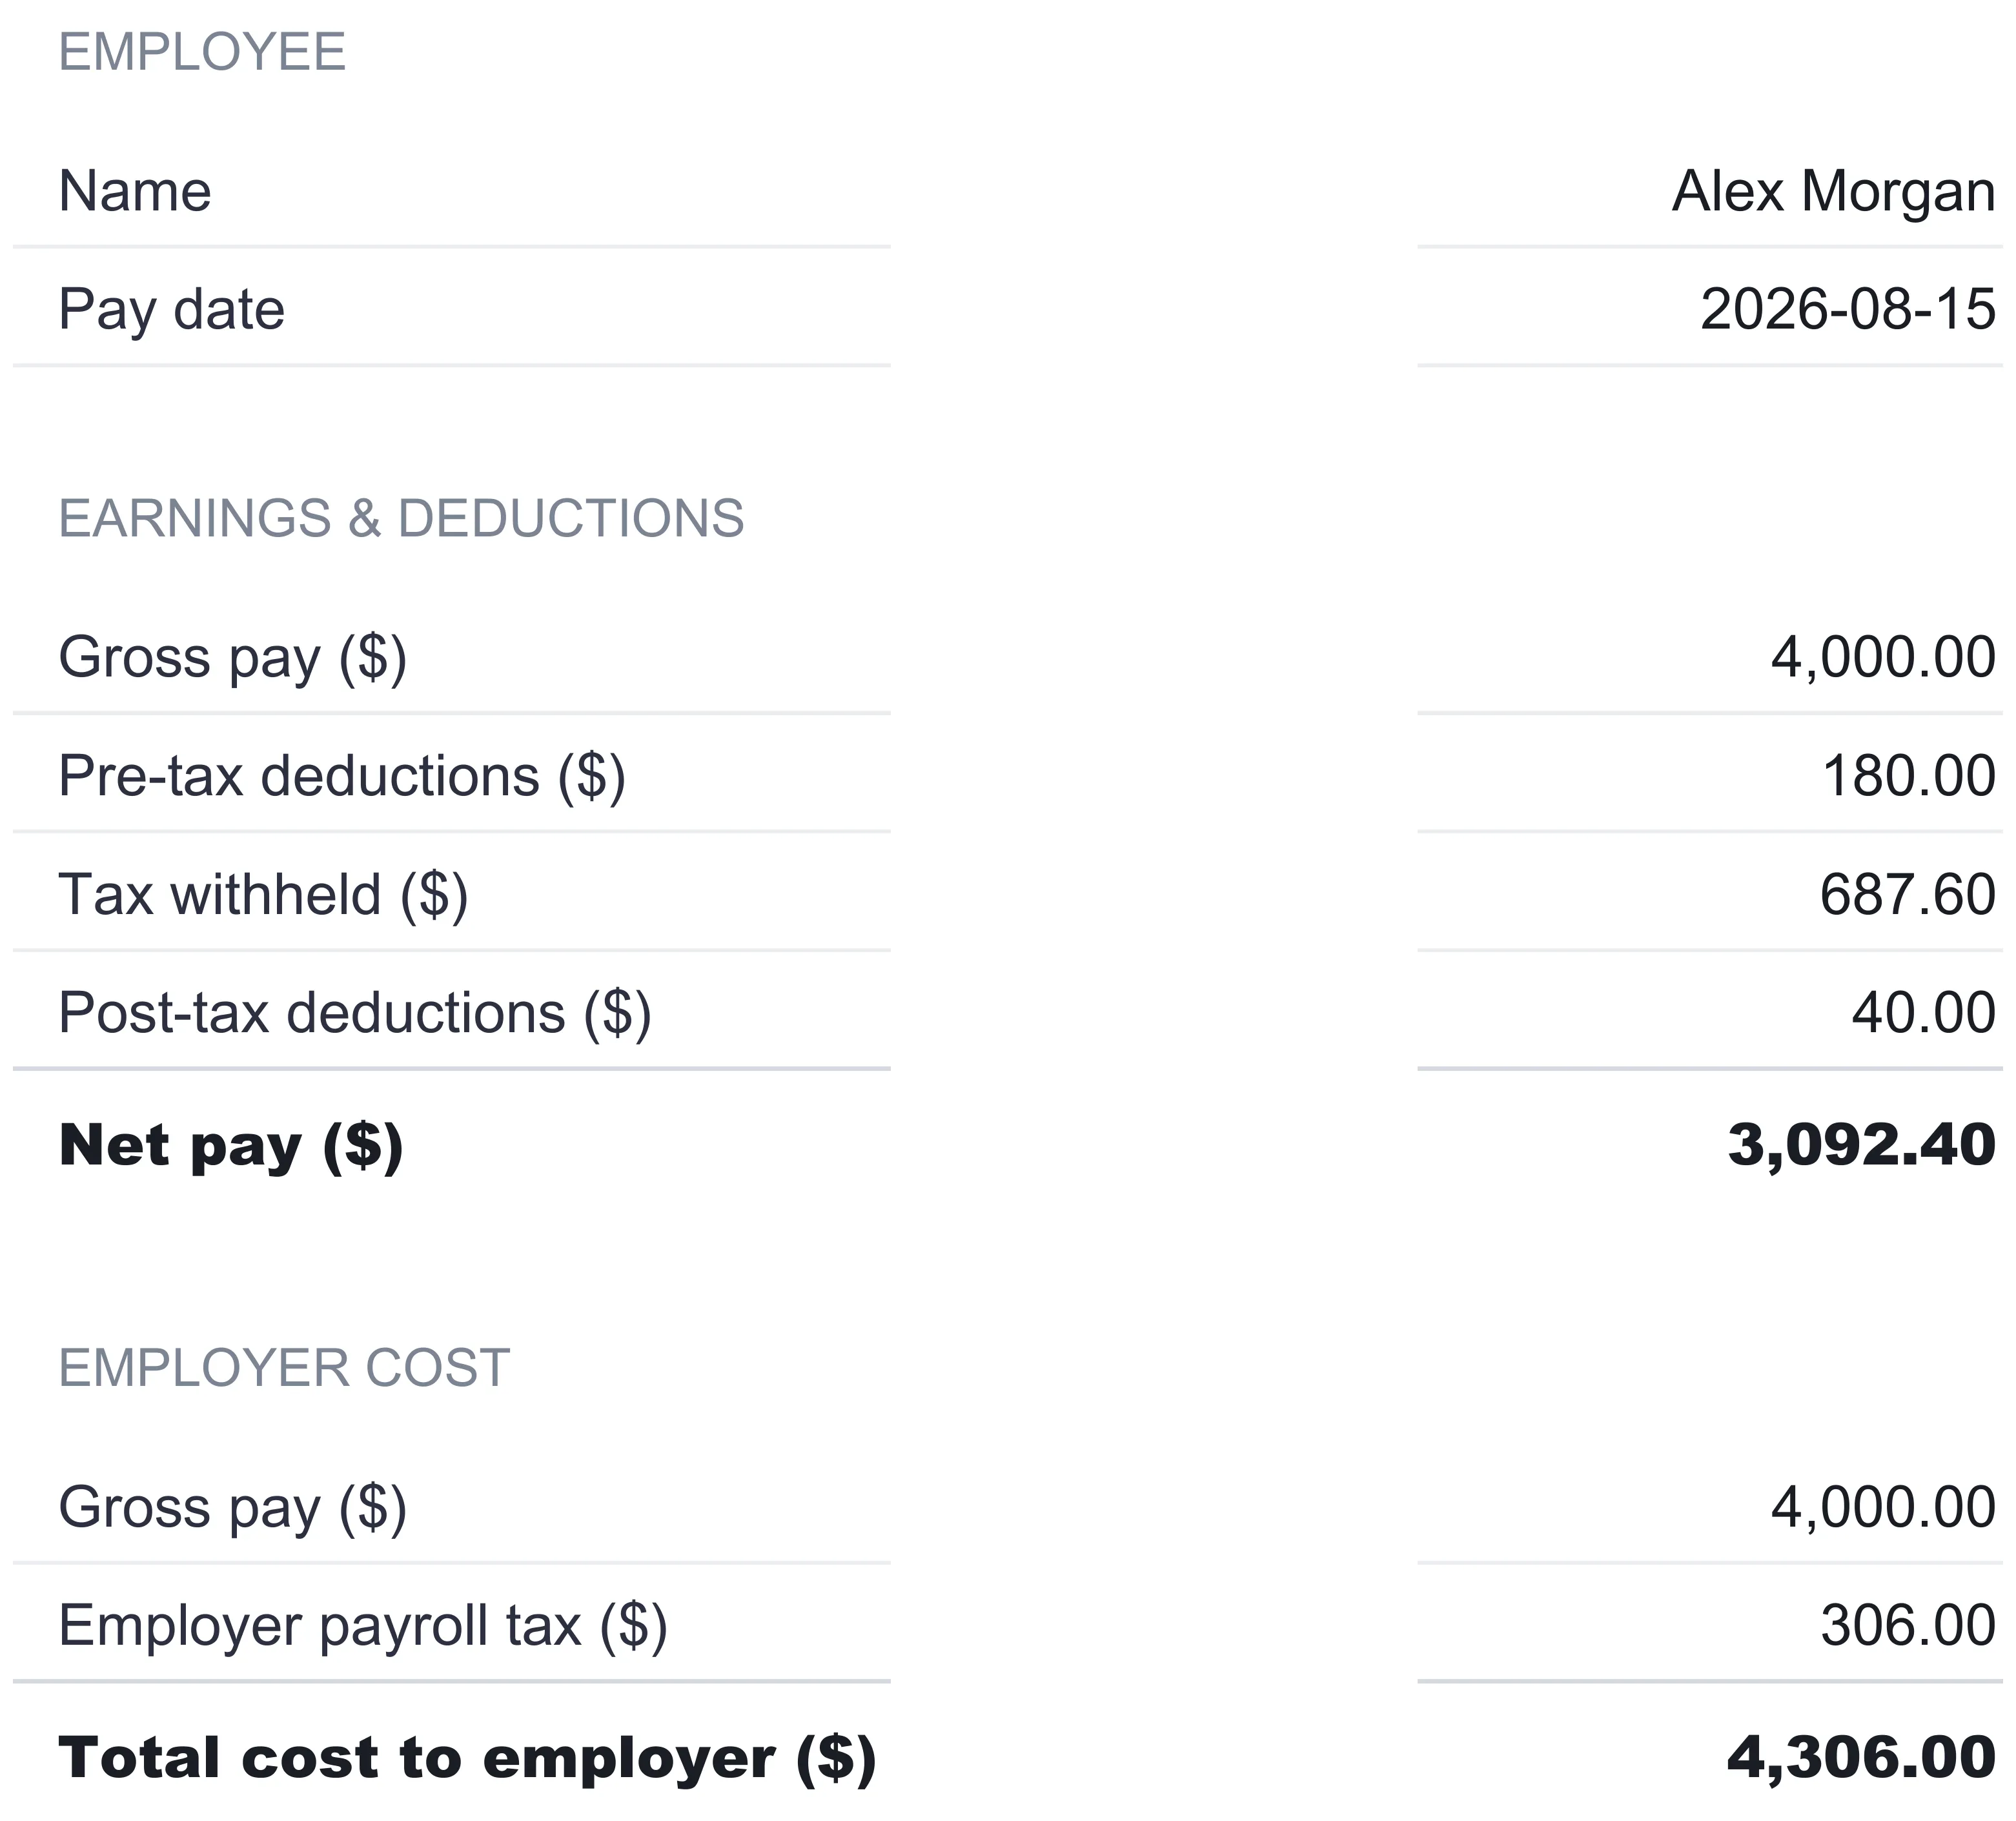
The Pay stub sheet reformats a single person’s row into something you can hand over or print. It reads the first employee on the Payroll sheet, so in the sample it shows Alex Morgan, dated with the current pay date from Settings. The top block lists the employee’s side of the run, from gross pay down to net pay, with pre-tax deductions, tax withheld, and post-tax deductions between them, ending on the $3,092.40 that Alex takes home.
The lower block is the part most stubs leave out: the employer’s side. It repeats the $4,000 gross, adds the $306 of employer payroll tax, and totals the $4,306 the business spends to employ Alex for the period. Putting the take-home figure and the true cost figure on the same slip is a quiet but useful piece of design, because it makes the wedge between what a person is paid and what the payroll costs impossible to overlook.
The year so far: the YTD sheet
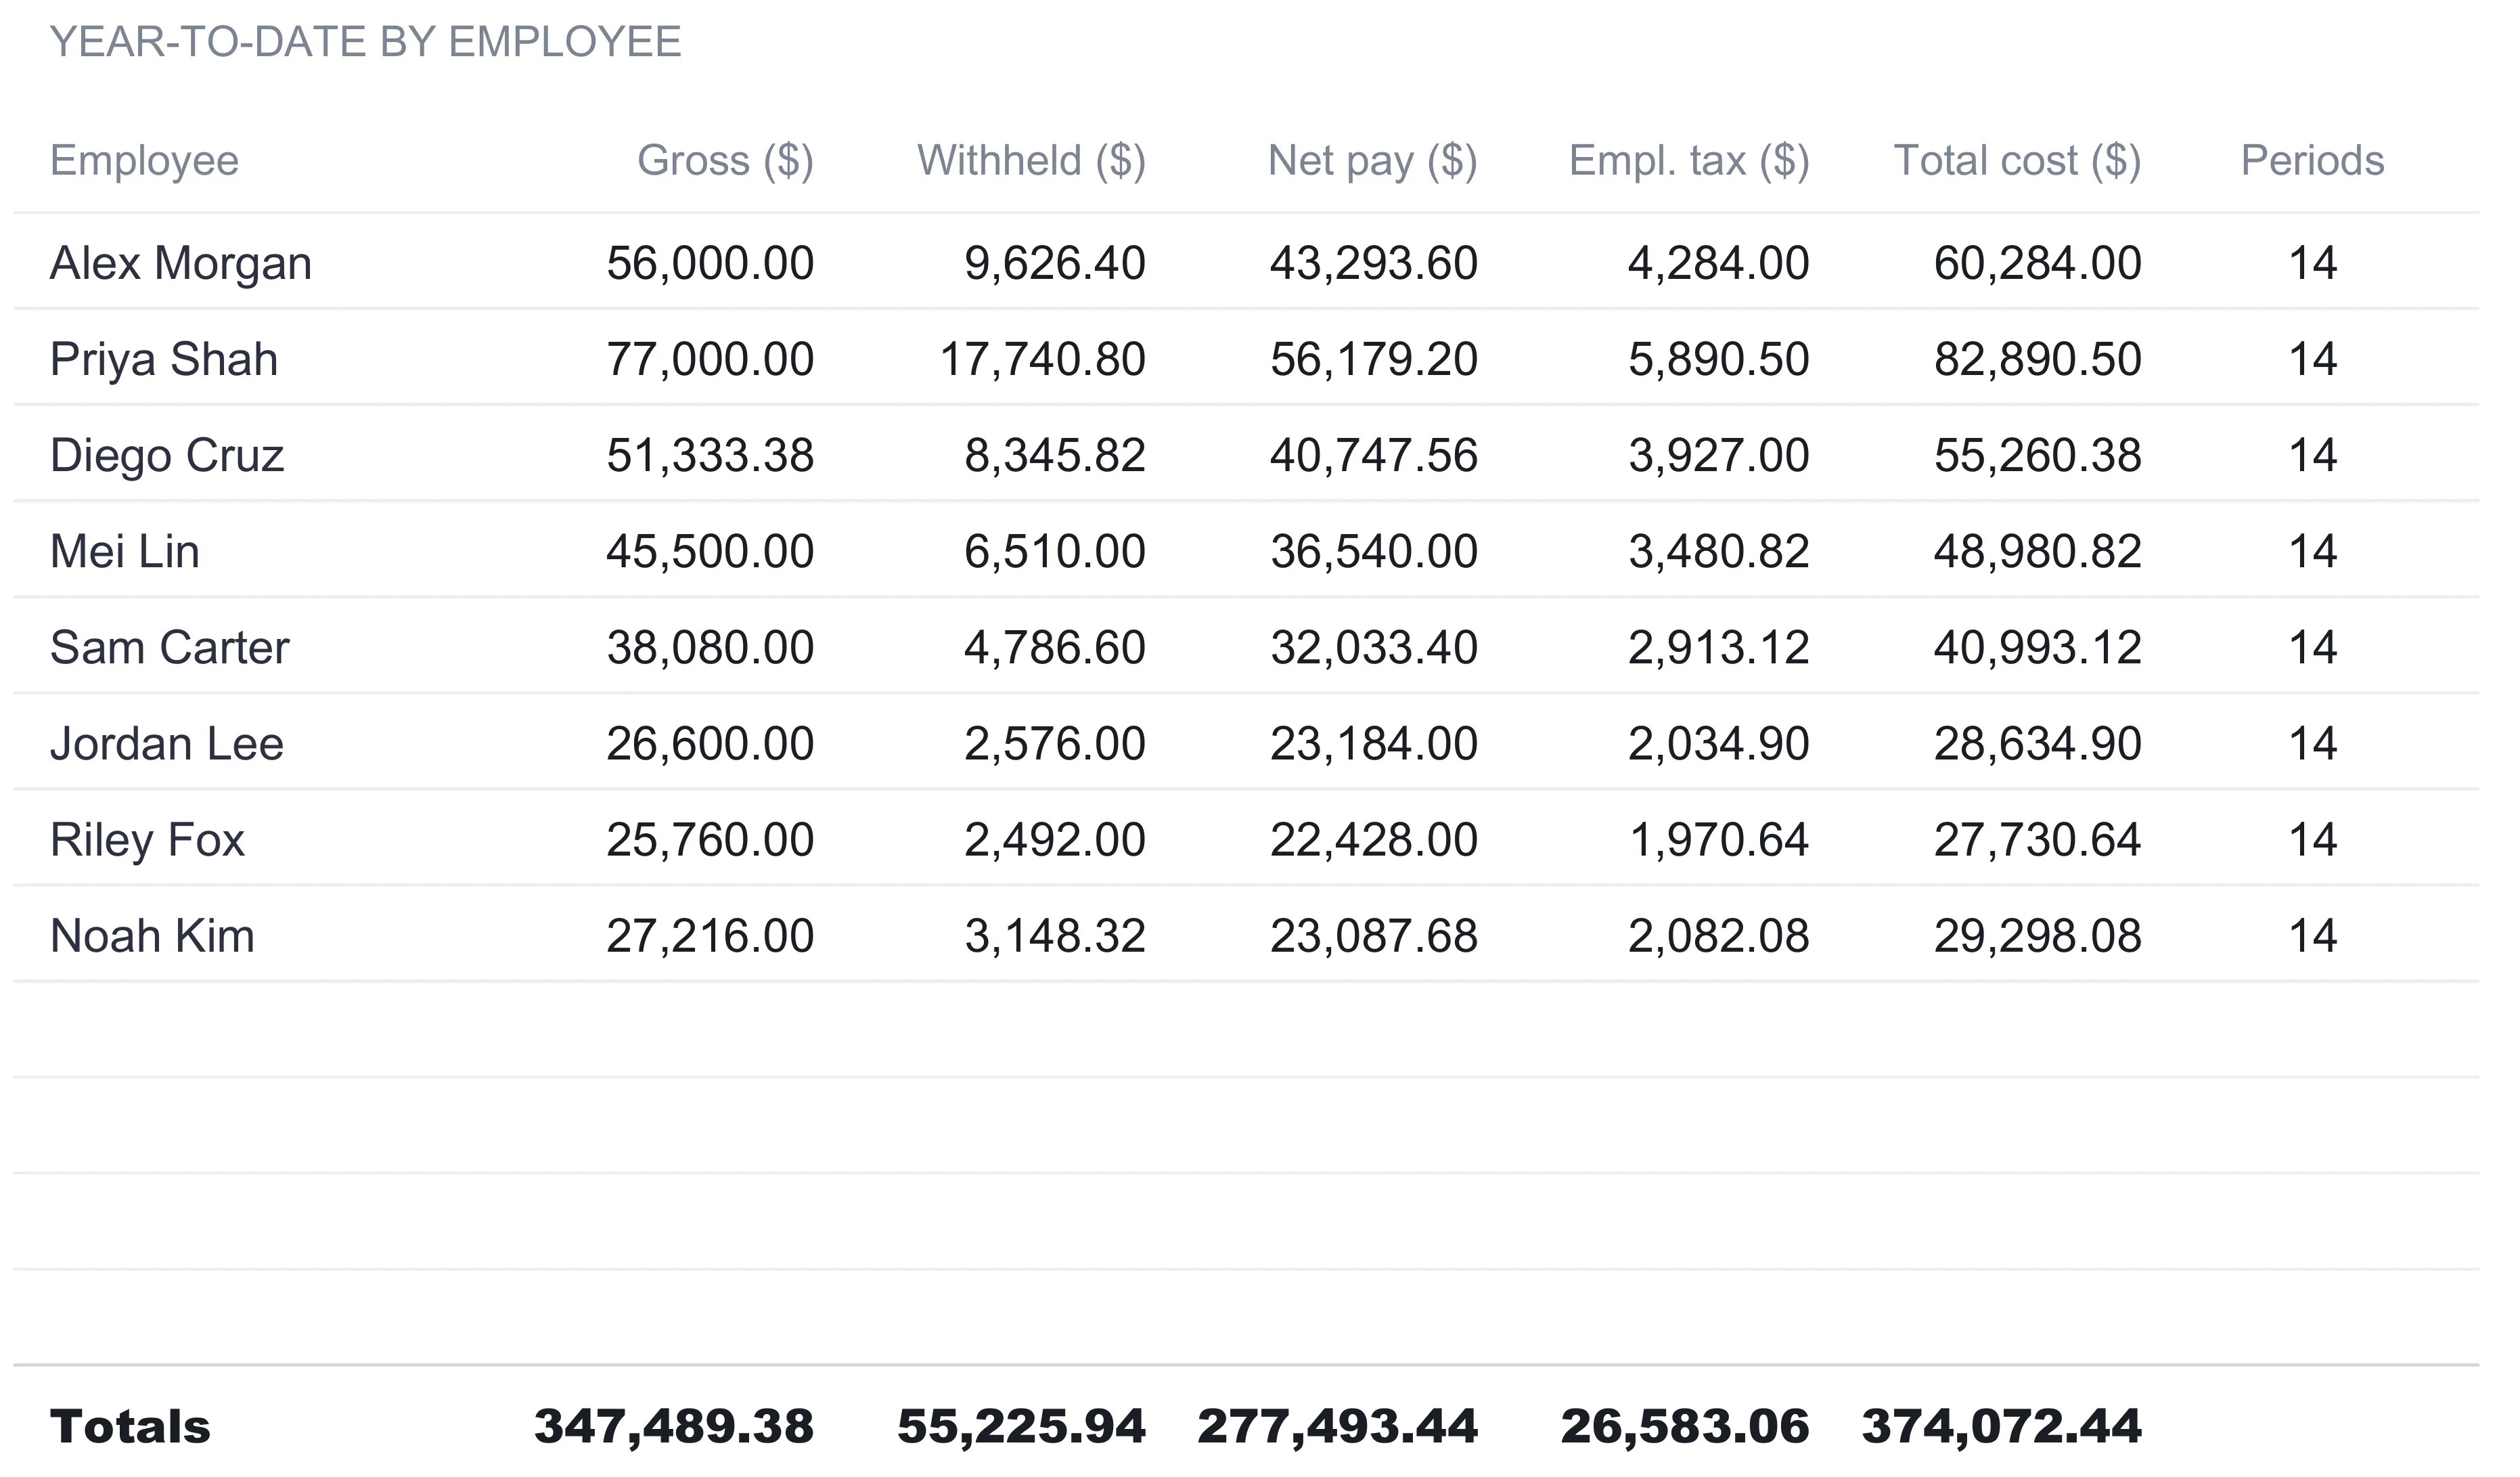
The YTD sheet answers the year-to-date question with one deliberate shortcut. For each person it takes the current pay-period figure and multiplies it by the Pay periods completed number on Settings, which is 14 in the sample. Alex’s $4,000 of gross becomes $56,000 year-to-date, the $687.60 withheld becomes $9,626.40, and the $4,306 total cost becomes $60,284. A Periods column repeats the 14 so the basis is visible on every row.
Across the team the sheet totals $347,489.38 in gross, $55,225.94 withheld, $277,493.44 paid out as net, $26,583.06 in employer tax, and $374,072.44 in total employer cost for the year so far. Priya Shah, the highest-paid person on the roster, alone accounts for $82,890.50 of that, while the two lowest-cost hourly roles come in near $28,000 each. Seeing the team ranked by annual cost is often the first time the shape of a payroll becomes obvious.
The shortcut is worth understanding for what it assumes. Multiplying one period by a count treats pay as if it held steady all year, so it will not capture a mid-year raise, a bonus period, or someone who started in week six. It is an accurate running total for a stable payroll and a close estimate for a changing one, and the sheet is honest about the mechanism right on the tab: update the completed-periods number as the year progresses, and the totals move with it.
The dashboard: the numbers and where payroll goes
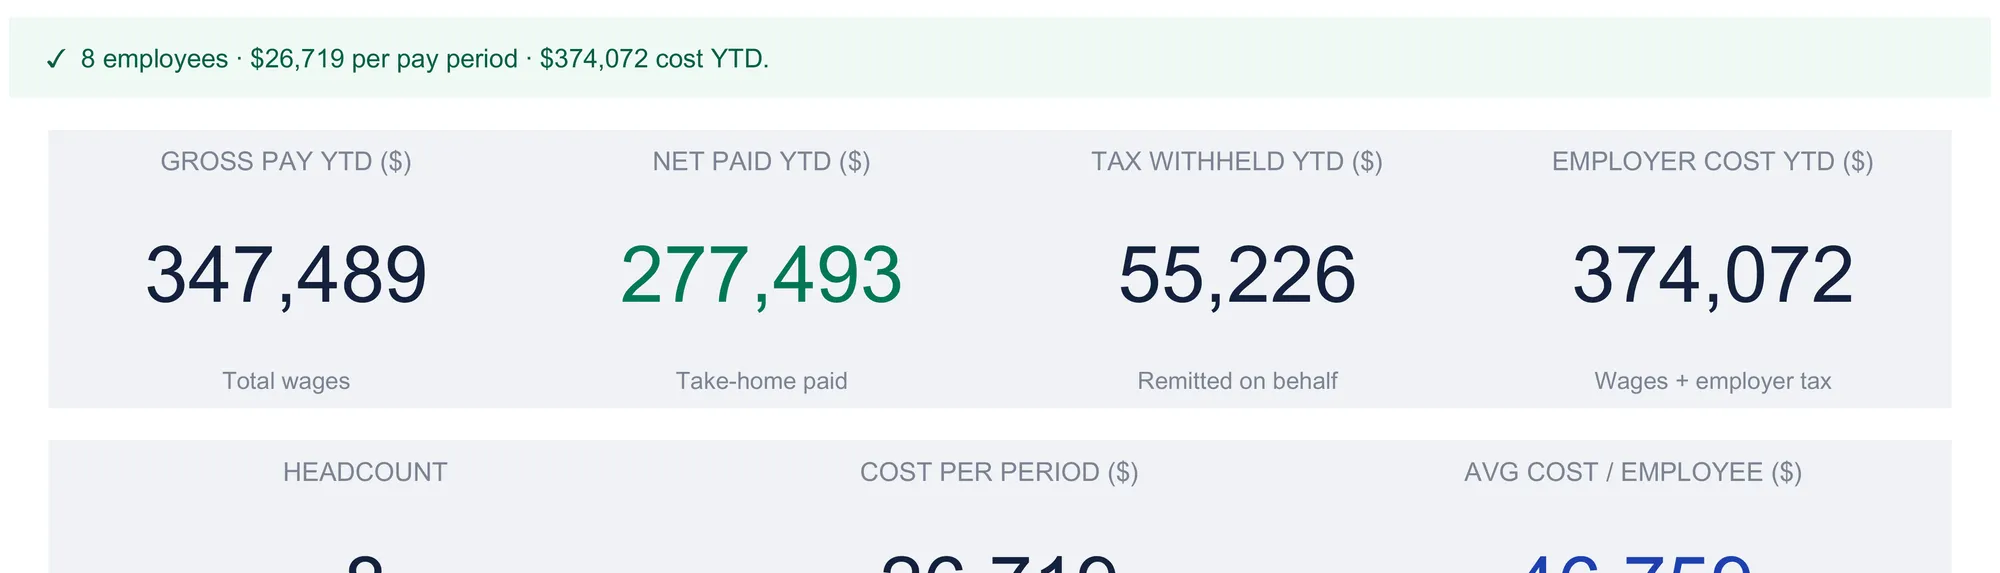
With the roster built and the period run, the Dashboard reads it all back. A status line across the top states the payroll in one sentence, and in the sample it reads “8 employees · $26,719 per pay period · $374,072 cost YTD.” Below it sit seven tiles:
| Tile | Sample value | What it reads |
|---|---|---|
| Gross pay YTD | $347,489 | Total wages before anything is taken out |
| Net paid YTD | $277,493 | What employees have actually received |
| Tax withheld YTD | $55,226 | Held from pay to remit on their behalf |
| Employer cost YTD | $374,072 | Wages plus the employer’s payroll tax |
| Headcount | 8 | Active employees on the roster |
| Cost per period | $26,719 | The full cost of one pay run |
| Avg cost / employee | $46,759 | Year-to-date employer cost per head |
Two of these are the numbers no paycheck shows. Employer cost year-to-date, at $374,072, is what the payroll has genuinely cost the business, and it runs well above both the $347,489 in gross wages and the $277,493 employees have pocketed. Average cost per employee simply divides that employer cost by headcount, turning the whole payroll into a single per-person figure of $46,759 that is easy to carry into a hiring conversation.
Below the tiles, the dashboard breaks a single pay run into where the money goes: $19,820.96 to net pay, $3,944.71 to tax withheld, $990 to pre-tax deductions, $65 to post-tax deductions, and $1,898.79 to employer tax, which together rebuild the $26,719.46 total. Read as a split, it shows that a little under three-quarters of the run reaches employees as take-home, while the remainder divides between the tax withheld from their pay and the employer’s own tax on top. A second chart plots each employee’s total cost year-to-date, the same figures from the YTD sheet laid out as bars in roster order, so the heaviest and lightest roles on the payroll separate at a glance. Together the two charts turn a screen of totals into a picture of who and what the payroll is made of.
Gross, taxable, net, and employer cost in plain terms
Four numbers carry most of payroll’s confusion, and each is a plain step away from the one before it.
Gross is the wage before anything is removed: a salaried person’s slice of their annual pay, or an hourly person’s rate times hours. Alex’s is $4,000 for the period.
Taxable is gross after pre-tax deductions, since those come out before tax is figured. Alex’s $4,000 less $180 leaves $3,820.
Net pay is what reaches the employee, taxable less the tax withheld, less any post-tax deductions. Alex’s works out to $3,092.40.
Total cost to employer goes the other way entirely. It starts from the same gross and adds the employer’s payroll tax on top, so Alex’s $4,000 becomes $4,306. Withholding lowers what the employee takes home but does not change the cost; employer tax raises the cost but never touches the paycheck. Those two facts are why net pay and employer cost sit at opposite ends of the same row, and why a payroll tracker that shows only take-home is telling half the story.
Where payroll records end and payroll filing begins
Recording payroll and remitting payroll taxes are two different jobs, and the tracker does only the first. It computes what was withheld and what the employer owes, which is exactly the raw material a filing needs, but it does not deposit anything, generate any form, or connect to any agency. The withholding percentages in it are flat planning figures rather than the graduated calculation in IRS Publication 15-T, and the flat employer rate carries none of the wage-base caps that real employment taxes involve.
For US employers, the IRS overview of employment taxes sets out the pieces the tracker deliberately leaves to others: withholding federal income tax, the Social Security and Medicare shares split between employee and employer, and the separate federal unemployment tax. Publication 15, the Employer’s Tax Guide, covers how and when those amounts are deposited and reported. Which rates and deadlines apply to a specific business is a question for a payroll or tax professional, and the value of keeping tidy records is that the answer becomes a lookup rather than a reconstruction when they ask.
Excel or Google Sheets for payroll records
The tracker is an .xlsx file built on plain formulas, with no macros and no add-ons, so it behaves the same in Microsoft Excel and in Google Sheets after upload. Google Sheets suits a business whose bookkeeper and owner want to open the same live payroll file from different places; Excel suits one that prefers a local file it controls. The structure described here, a roster feeding one pay period that feeds the totals, is equally buildable in either, and nothing in this walkthrough depends on a feature only one of them has.
Which template fits the job
- Payroll Tracker Spreadsheet Template ($29) is the workbook this walkthrough follows: the roster, one pay period run from gross to net and employer cost, the year-to-date rollup, a printable pay stub, and the dashboard, ready to use for a team of up to twelve.
- Business Bookkeeping Spreadsheet Template ($29) picks up where payroll leaves off. Each pay run is one of the larger expenses a small business books, and the bookkeeping workbook records transactions into a chart of accounts and builds a monthly rollup and profit-and-loss summary from them, so the payroll cost the tracker computes has somewhere to land in the books.
Related
- How to Do Bookkeeping in a Spreadsheet - the single-entry ledger and P&L that payroll costs feed into
- How to Create and Track Invoices in a Spreadsheet - the money-in side of the same small-business toolkit
Frequently asked questions
What is the difference between tax withheld and employer payroll tax?
They point in opposite directions. Tax withheld comes out of the employee's own pay, so it lowers take-home without changing what the wage costs. Employer payroll tax sits on top of the wage as a separate employer expense. In the tracker, withholding is a flat percentage of taxable pay set per employee, while the employer rate is one flat percentage of gross set once on Settings, 7.65 percent in the sample. That is why an employee's gross and the employer's total cost for that employee are two different numbers.
How does the spreadsheet handle salaried and hourly pay?
Each roster row is tagged Salary or Hourly, and the Payroll sheet reads that tag. For a Salary row it divides the annual pay rate by the pay periods per year from Settings, so a $96,000 salary at 24 periods is $4,000 of gross a period. For an Hourly row it multiplies the pay rate by the hours in the period. Hours start from the standard week on the roster and can be typed over for a period with overtime or a short week.
Does the withholding percentage replace the IRS tax tables?
No. The tracker applies one flat percentage of taxable pay per employee, which is a planning approximation rather than a bracket calculation. It is not the graduated withholding that IRS Publication 15-T describes, and it does not account for filing status, allowances, or wage thresholds. A payroll or tax professional can confirm the figure that belongs on an actual paycheck.
How does the year-to-date total stay current?
The YTD sheet multiplies the current pay-period figure by the Pay periods completed number on Settings, so after 14 periods a $4,000 gross reads $56,000 year-to-date. Raising that count by one after each run keeps the totals moving. Because it scales one period, the shortcut assumes pay stayed steady across the year rather than summing period-by-period history.
Does the tracker file or pay payroll taxes?
No. It records what each pay run costs and computes gross, withholding, net pay, and employer cost, but it does not deposit taxes, produce filings, or connect to any agency. Depositing and reporting withheld amounts and employer taxes is separate work, and IRS guidance on employment taxes plus a payroll professional cover how and when that happens.
Sources
- Understanding employment taxes - Internal Revenue Service
- About Publication 15 (Circular E), Employer's Tax Guide - Internal Revenue Service
About this article
Template sheets, inputs, formulas and sample figures checked on 2026-09-10 against the shipped Payroll Tracker workbook (Dashboard, Employees, Payroll, YTD, Pay stub, Settings and How to Use tabs). IRS employment-taxes, Publication 15 and Publication 15-T references checked against the live IRS pages on 2026-09-10. Last reviewed September 2026.