A consulting rate is not a number you pick, it is a number you work back to from a revenue goal and the hours you can actually bill. This walkthrough builds the calculation the way the template does it: a capacity model that turns 52 weeks into 1,260 billable hours, a rate calculator that divides a 180,000 goal by those hours for a 142.86 required hourly, a service-mix planner, and a Lean/Base/Stretch scenario compare. Our Solo Consultant Rate & Capacity Spreadsheet Template ($29) ships the whole thing ready for Excel and Google Sheets.
Ask a solo consultant what they charge and you usually get a round number with a shrug behind it. Ask how they arrived at it and the answer thins out. The rate was matched to a former salary, or copied from a peer, or set at whatever the first client agreed to. None of those methods knows how many hours the year actually holds, and that is the number a rate has to survive. A rate that looks healthy on paper can still miss an income goal by a wide margin once vacations, holidays, and the unbillable hours of running a one-person business are subtracted from the calendar.
Calculating a consulting rate is really a division problem in disguise: a revenue goal on top, the hours you can genuinely bill on the bottom. The hard part is the bottom. A spreadsheet is well suited to it because the billable-hours figure is itself a small model, and once that model is built, the rate, the day rate, and the monthly retainer all fall out of it. The examples below come from our Solo Consultant Rate & Capacity Spreadsheet Template ($29), which ships the whole calculation ready-made for Excel and Google Sheets. The structure is reproducible by hand if you would rather build your own.
What a consulting rate spreadsheet has to work out
Strip the problem to its parts and there are five, each with its own sheet in the template:
- The goal and the givens. The annual revenue you are aiming for, and two constants that shape everything else: the currency and how many hours a normal week holds.
- Capacity. How the 52 weeks of a year become the hours you can actually bill, once time off and non-billable work are removed. This is the model that produces the denominator.
- The rate. The revenue goal divided by billable hours, expressed three ways: an hourly rate, a day rate, and a monthly retainer.
- The service mix. A plan for how that revenue is actually earned across different services at different rates, and the blended rate that results.
- Scenarios. The same calculation run at three levels of ambition, so a lean year and a stretch year sit next to the base plan.
The workbook gives each of these its own sheet (Settings, Capacity, Rate Calculator, Service Mix, and Scenarios), with a Dashboard on top that reads all five and a How to Use sheet carrying the instructions. Seven sheets in total. The order below follows the order the numbers flow: set the constants, build capacity, read the rate, plan the mix, then compare scenarios.
Start with the goal: the Settings sheet
Two inputs on the Settings sheet drive the entire calculation, so they come first.
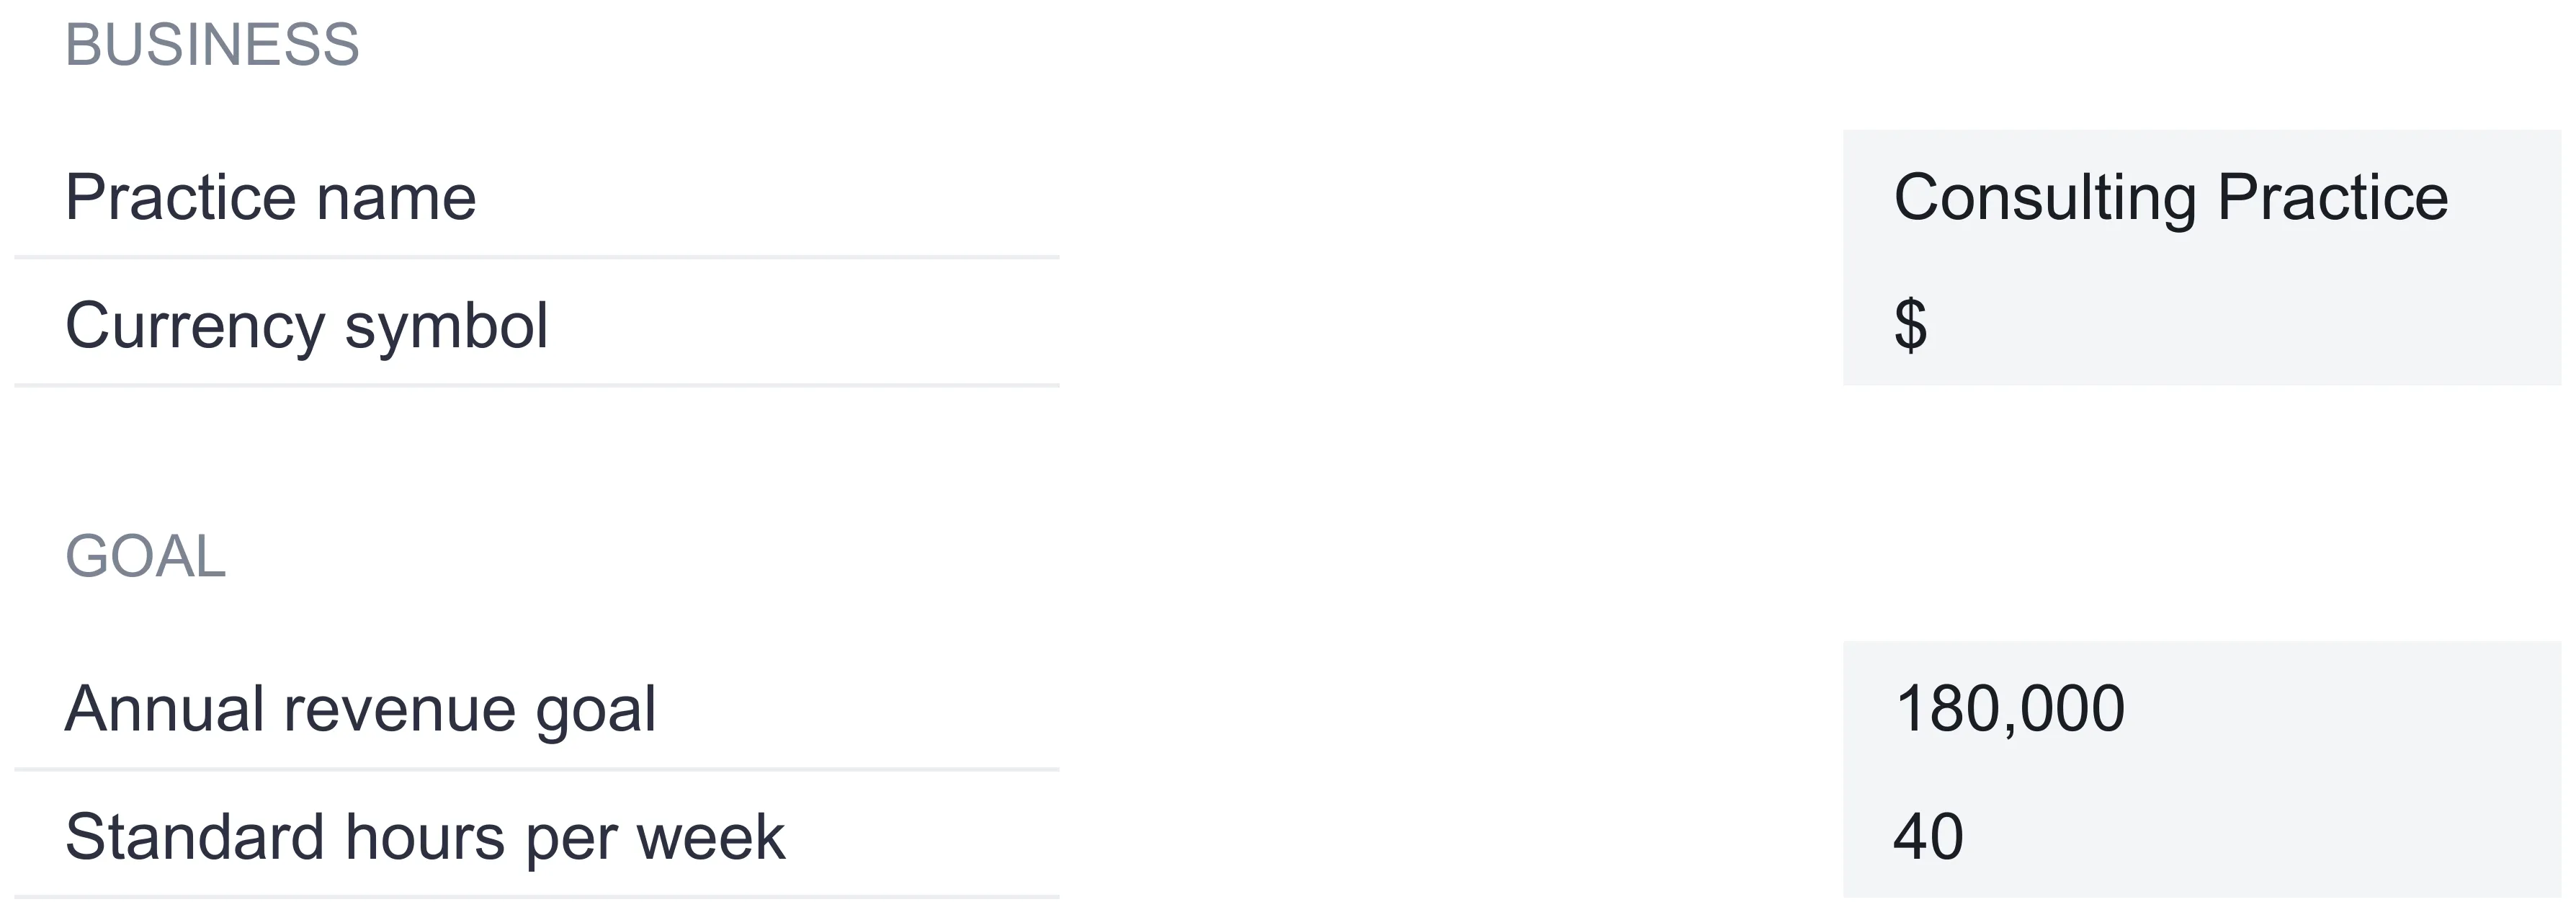
Annual revenue goal. The sample uses 180,000. This is the number the rate has to reach, and it feeds the Rate Calculator directly. It is a goal, not a forecast, and the whole point of the workbook is to test whether it is reachable inside the hours available.
Standard hours per week. The sample uses 40. This is the raw material for the capacity model. It is deliberately kept separate from the goal, because changing how long a week is has nothing to do with changing how much you want to earn, and the two levers behave differently.
The sheet also holds the practice name, labeled “Consulting Practice” in the sample, which appears as a heading on every sheet except How to Use. Alongside it sits a currency selector offering 35 symbols, from the dollar and euro through to the rupee, real, and dirham. Choosing a symbol relabels every money column and KPI header across the workbook. It relabels only, with no conversion of the underlying numbers, so switching from the dollar to the euro leaves 180,000 reading as 180,000 with a new symbol in front of it.
Build the denominator: the Capacity sheet
This is the sheet that separates an honest rate from a wishful one. A year has 52 weeks, but almost none of them are 40 fully billable hours, and the Capacity sheet works the calendar down to what is left in two stages.
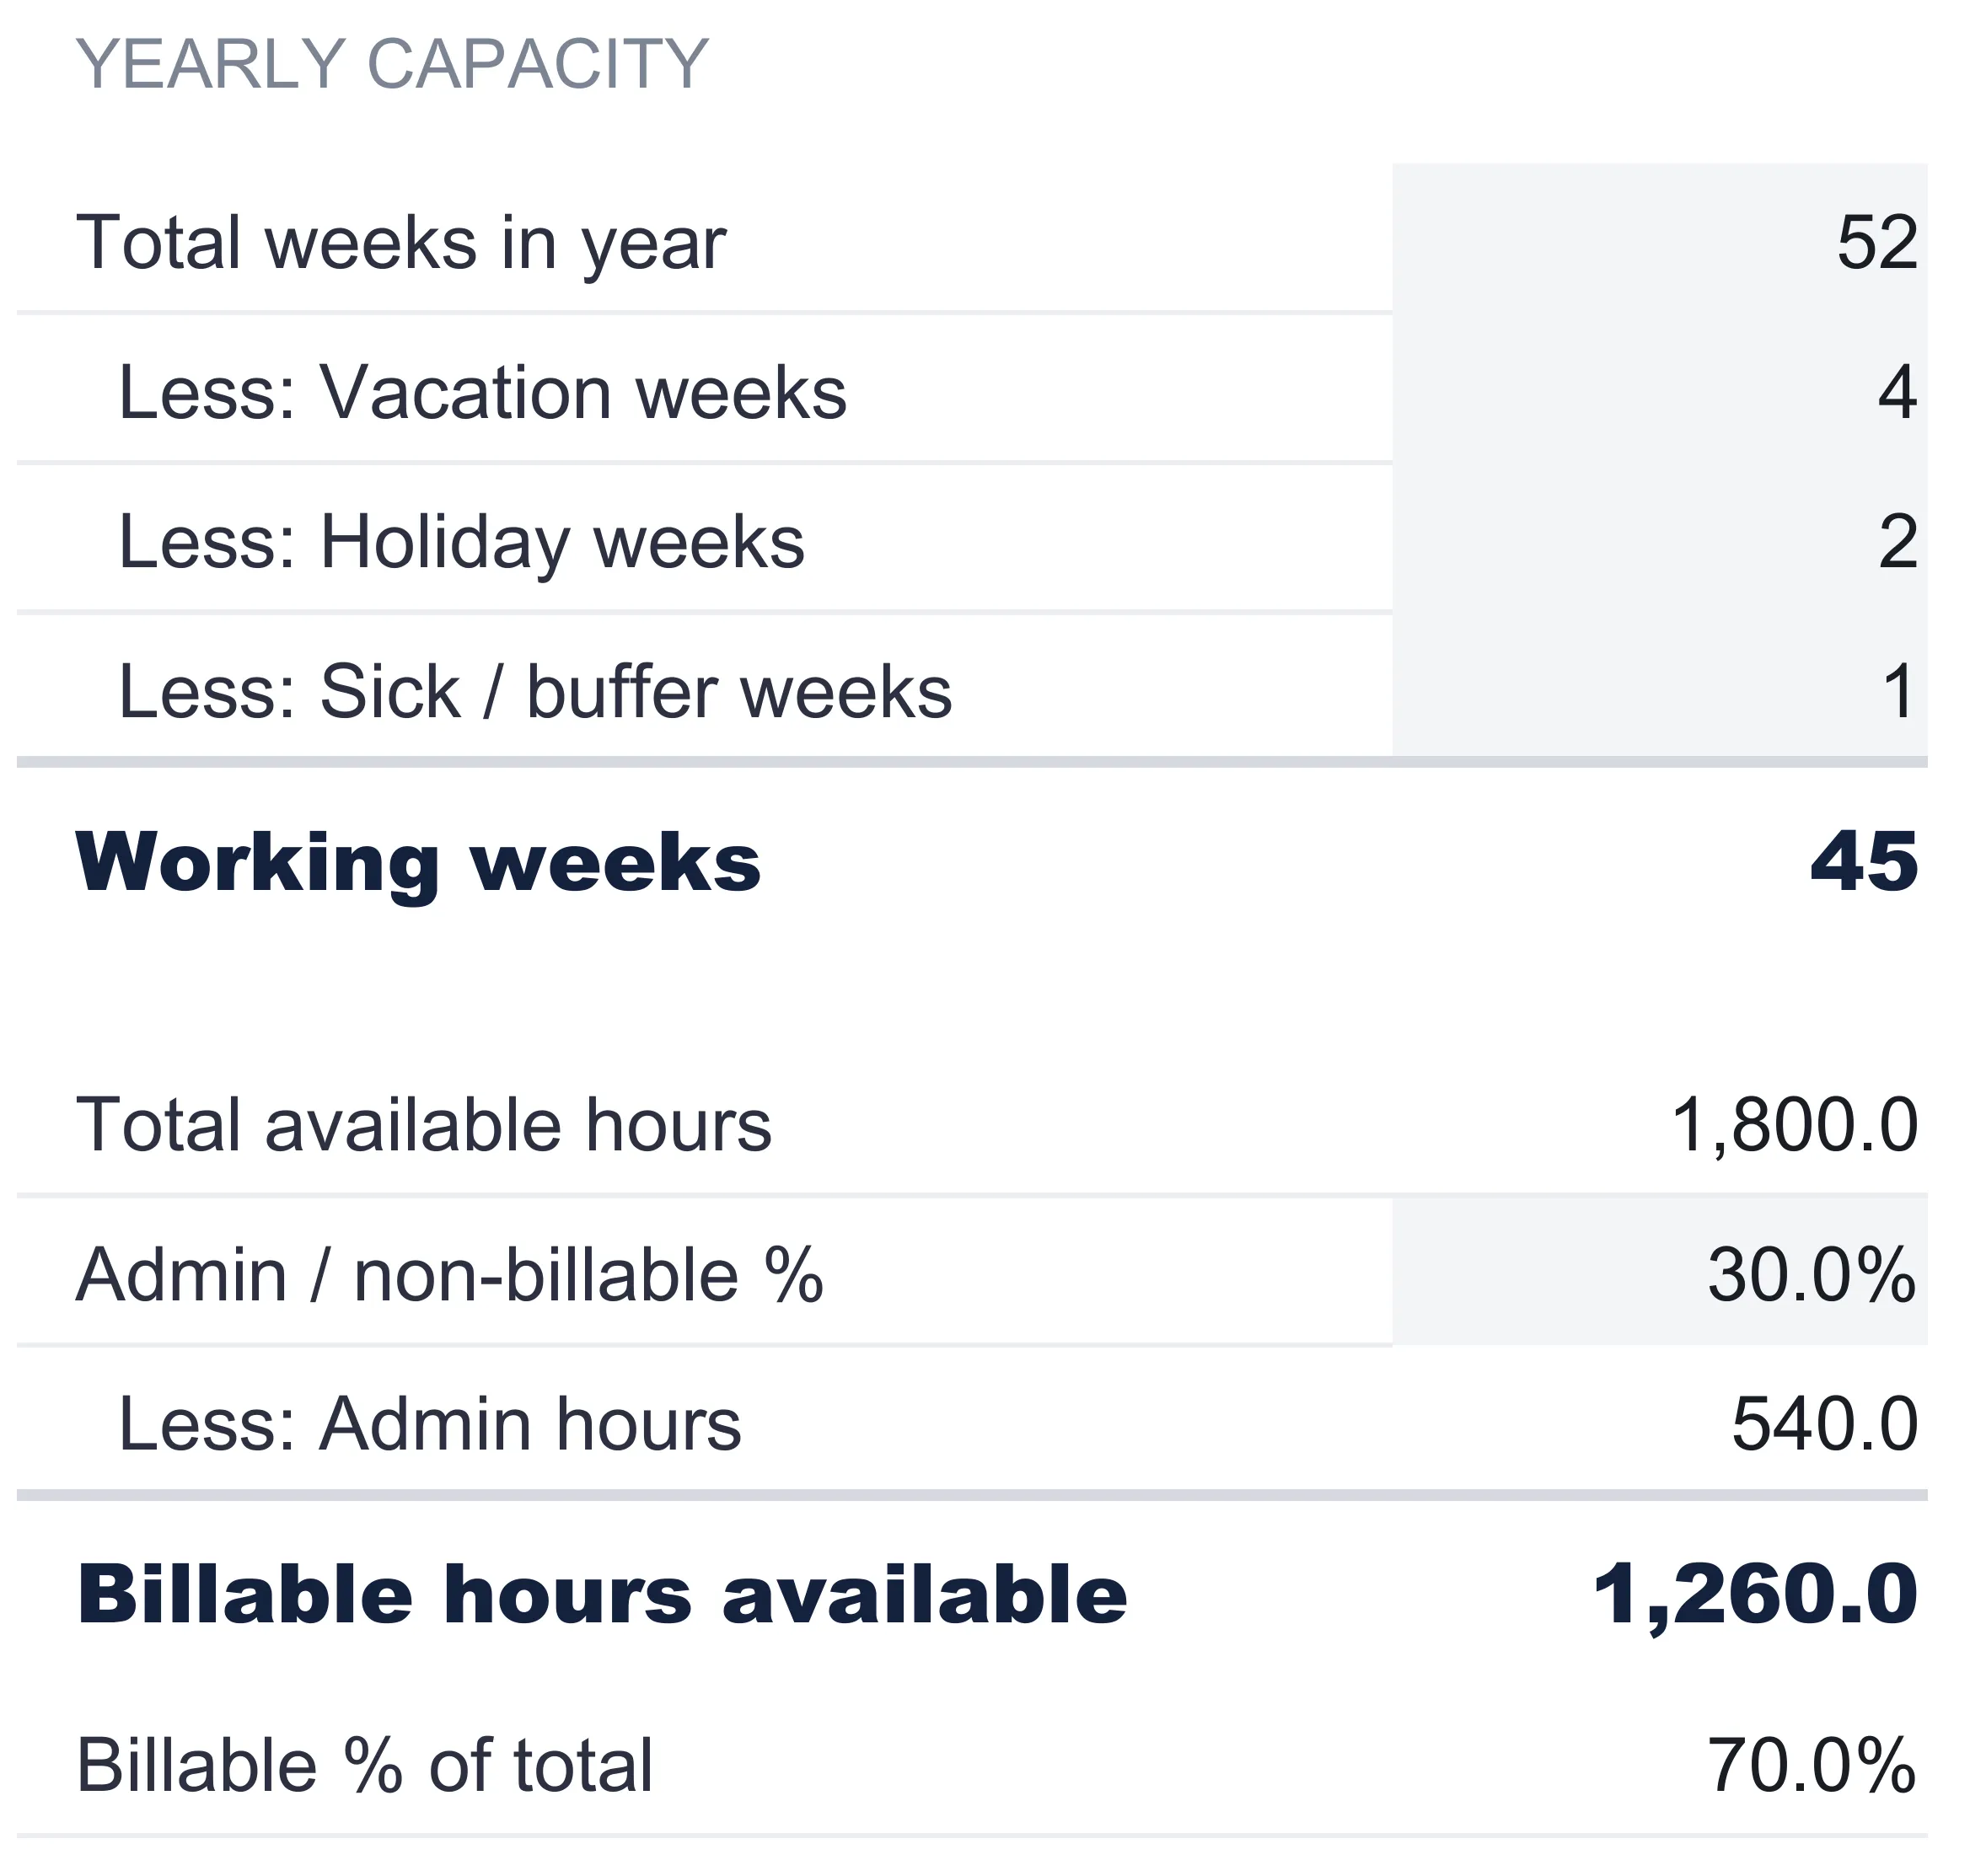
The first stage handles time away from the desk. Starting from 52 weeks, it subtracts 4 vacation weeks, 2 holiday weeks, and 1 sick or buffer week, leaving 45 working weeks. Multiplied by the 40 standard hours per week from Settings, that gives 1,800 total available hours in the year. This is already well below the 2,080 hours a naive full-time count would assume, and the gap is entirely time no one bills for.
The second stage handles the hours that are at the desk but still cannot be invoiced. The sheet applies an admin or non-billable percentage, set to 30 percent in the sample, and the on-sheet note is explicit about what that covers: sales, marketing, ops, and learning, everything you cannot bill for. Thirty percent of 1,800 is 540 admin hours, which leaves 1,260 billable hours available for the year. The sheet also reports the billable percentage of total, 1,260 divided by 1,800, which comes to 70 percent. That figure is the consultant’s utilization, and it becomes a headline number on the dashboard.
The reason to build capacity as its own model, rather than typing a billable-hours figure straight into the rate calculation, is that every assumption is now visible and adjustable. A consultant who takes six weeks off instead of four, or whose admin load runs closer to 40 percent, changes one cell and watches the billable-hours total move. Because the rate downstream divides by that total, the rate moves with it. Nothing has to be recalculated by hand.
Read the rate: the Rate Calculator sheet
With a goal and a billable-hours figure in hand, the rate is a single division. The Rate Calculator pulls the 180,000 goal from Settings and the 1,260 billable hours from Capacity, and computes:
Required hourly rate = revenue goal ÷ billable hours = 180,000 ÷ 1,260 = 142.86.
That is the floor. It is the average rate every billable hour has to earn for the year to reach the goal, assuming all 1,260 hours actually sell. The dashboard tile that carries it is subtitled “required minimum” precisely because it is the break-even against the goal, not a recommendation. From that one figure it derives two more shapes of the same rate, for consultants who quote in days or on retainer:
- Equivalent day rate (×8) = 142.86 × 8 = 1,142.86. This assumes an eight-hour day billed at the same effective rate.
- Equivalent monthly retainer (÷12) = 180,000 ÷ 12 = 15,000. This one divides the annual goal by twelve directly rather than working through the hourly, so it answers “what would twelve equal monthly payments have to be?” independently of how the hours fall.
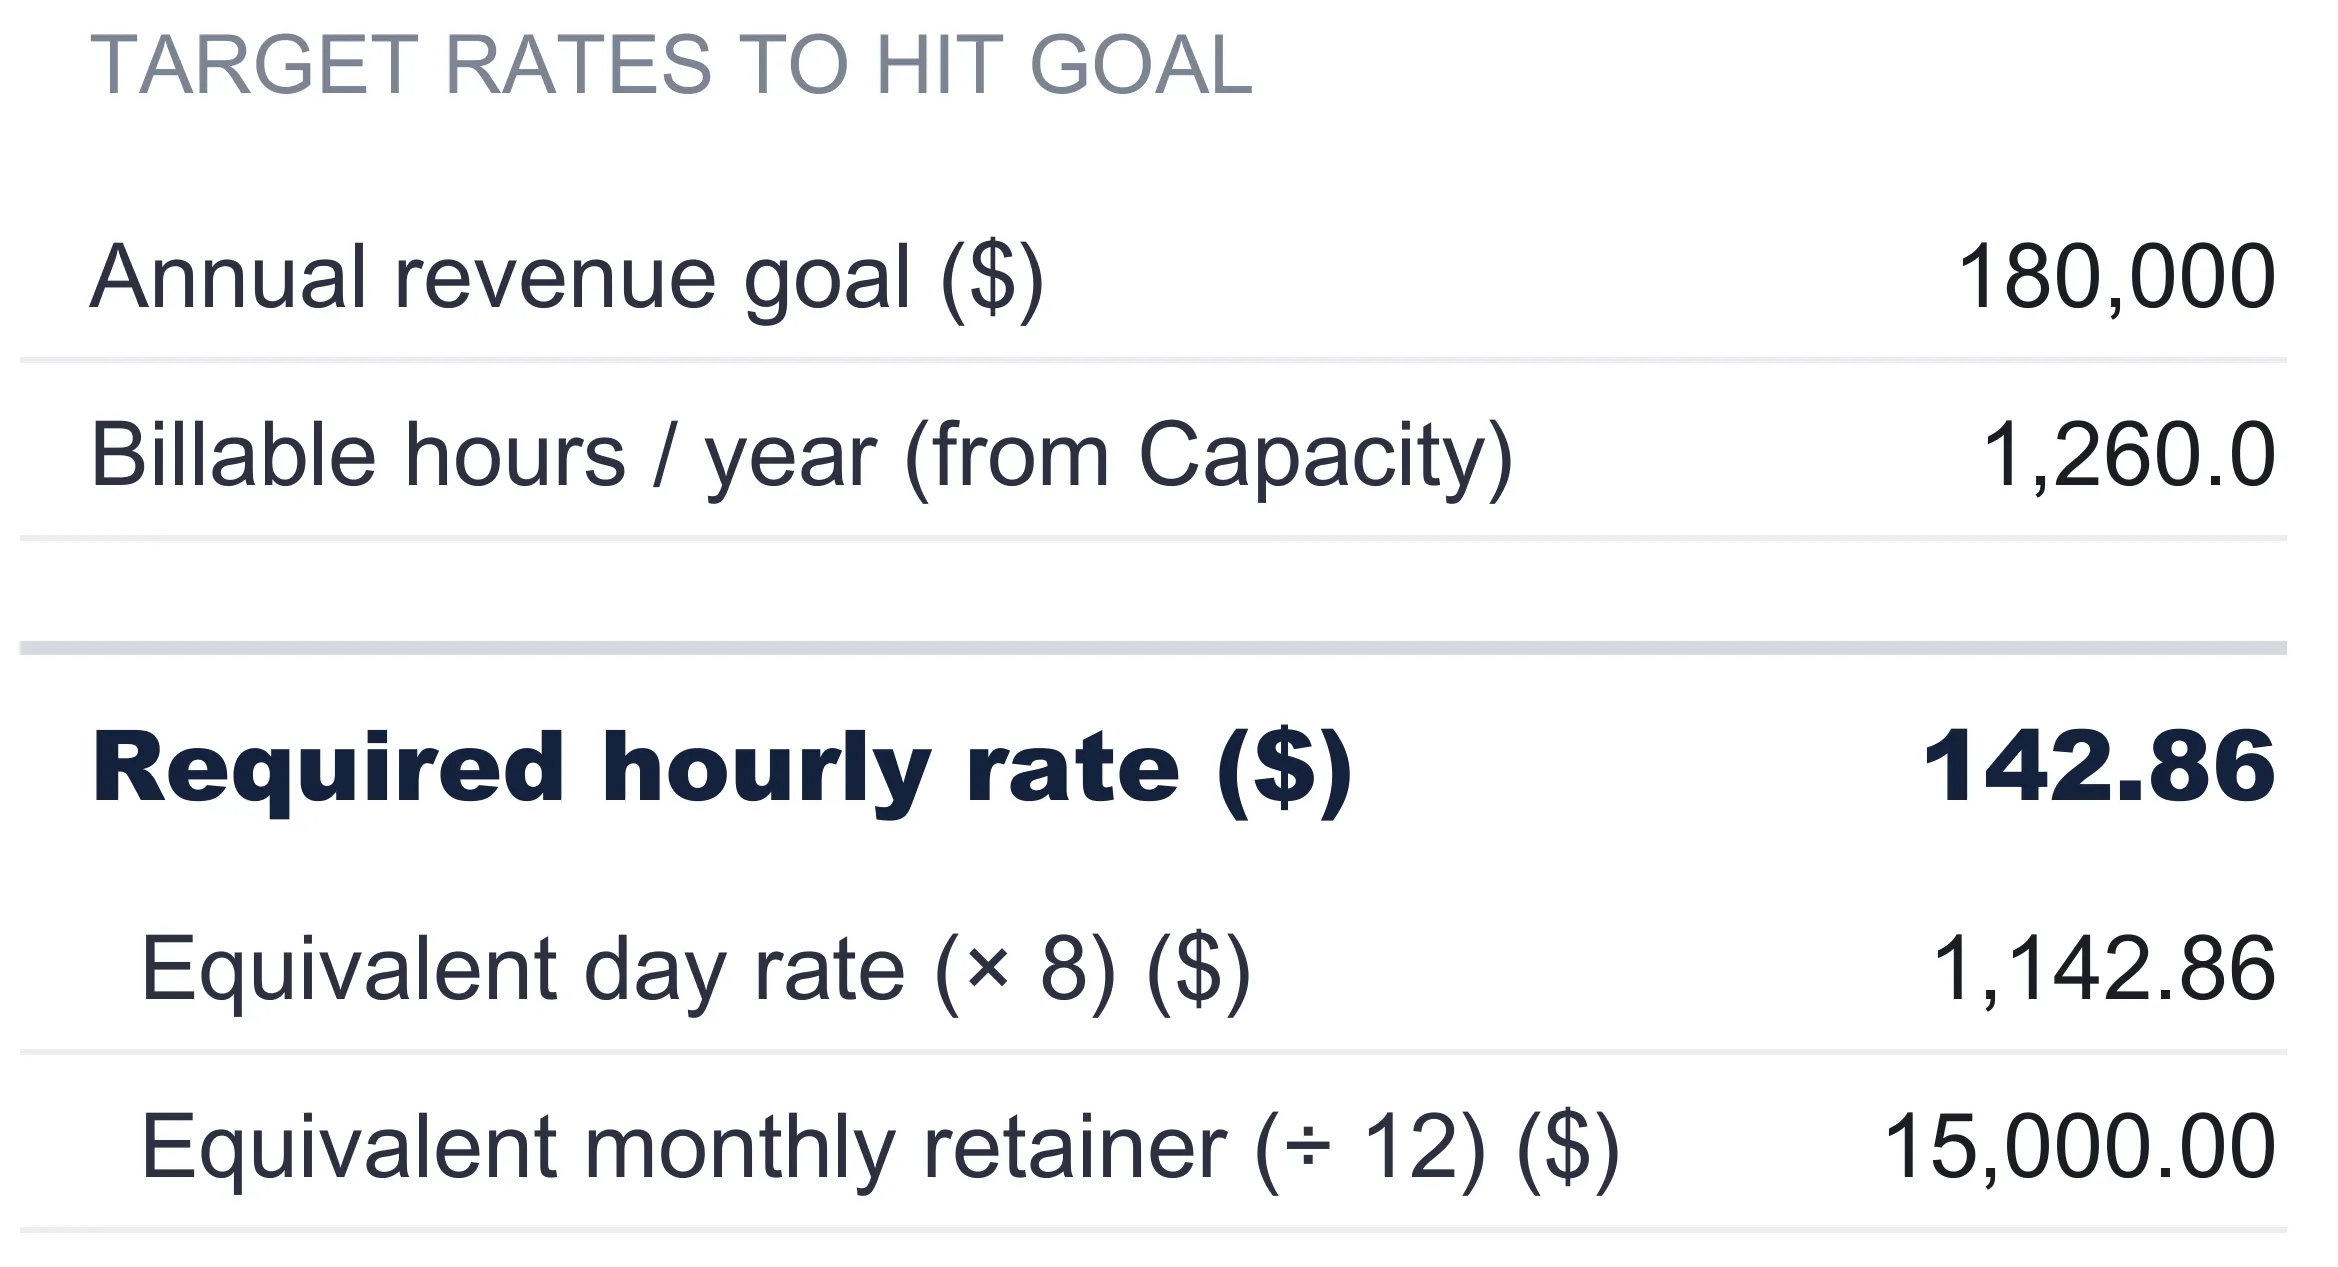
The on-sheet note states the logic plainly: required hourly is revenue goal divided by billable hours, and the day rate assumes an eight-hour day at the same effective rate. What makes this useful is that all three numbers are tied to the same goal and the same capacity model, so they can never quietly disagree. Change the goal and all three move together. Change the admin percentage on Capacity and the hourly and day rate move while the retainer, which does not depend on hours, holds steady. Seeing that difference is part of the point, because it shows which pricing shapes are sensitive to how the week is spent and which are not.
If any input leaves nothing to divide by, the sheet returns “N/A” rather than a misleading zero. A capacity model that somehow produced zero billable hours would make the rate undefined, and the workbook says so instead of printing a false number.
Plan how the revenue is earned: the Service Mix sheet
The Rate Calculator answers “what does one flat rate have to be?” Real consulting practices rarely charge one flat rate. They run a mix: some deep one-to-one work, some high-value workshops, some steady retainer income, maybe a group program. The Service Mix sheet plans that mix and checks it against both the goal and the capacity.
Each row is a service line with three inputs, the line name, hours per year, and a rate per hour, and one computed column, revenue, which is simply hours times rate. The sheet holds seven rows, four filled in the sample and three left blank. The sample plan:
| Service line | Hours / year | Rate / hr ($) | Revenue ($) |
|---|---|---|---|
| 1:1 consulting | 500 | 200 | 100,000 |
| Workshops | 80 | 350 | 28,000 |
| Retainer clients | 300 | 175 | 52,500 |
| Group coaching | 70 | 250 | 17,500 |
| Total mix | 950 | 208.42 | 198,000 |
The total row does three jobs. It sums the hours (950), sums the revenue (198,000), and computes a blended rate of total revenue divided by total hours, 198,000 ÷ 950 = 208.42. That blended figure is the honest average price of an hour across the whole practice, and it comes out well above the 142.86 the flat calculation demanded, because the mix leans on higher-priced workshops and coaching alongside the core consulting work.
Two variance lines sit below the total and are the sharp end of the sheet. Revenue vs goal subtracts the 180,000 goal from the 198,000 planned mix, showing a surplus of 18,000. Hours vs capacity subtracts the 1,260 billable hours available from the 950 hours the mix consumes, showing -310, meaning the plan uses 310 fewer hours than the year allows. Read together, they say something specific: this mix clears the revenue goal with room to spare and does it without running out of billable time. That combination is exactly what the dashboard’s status banner is watching for.
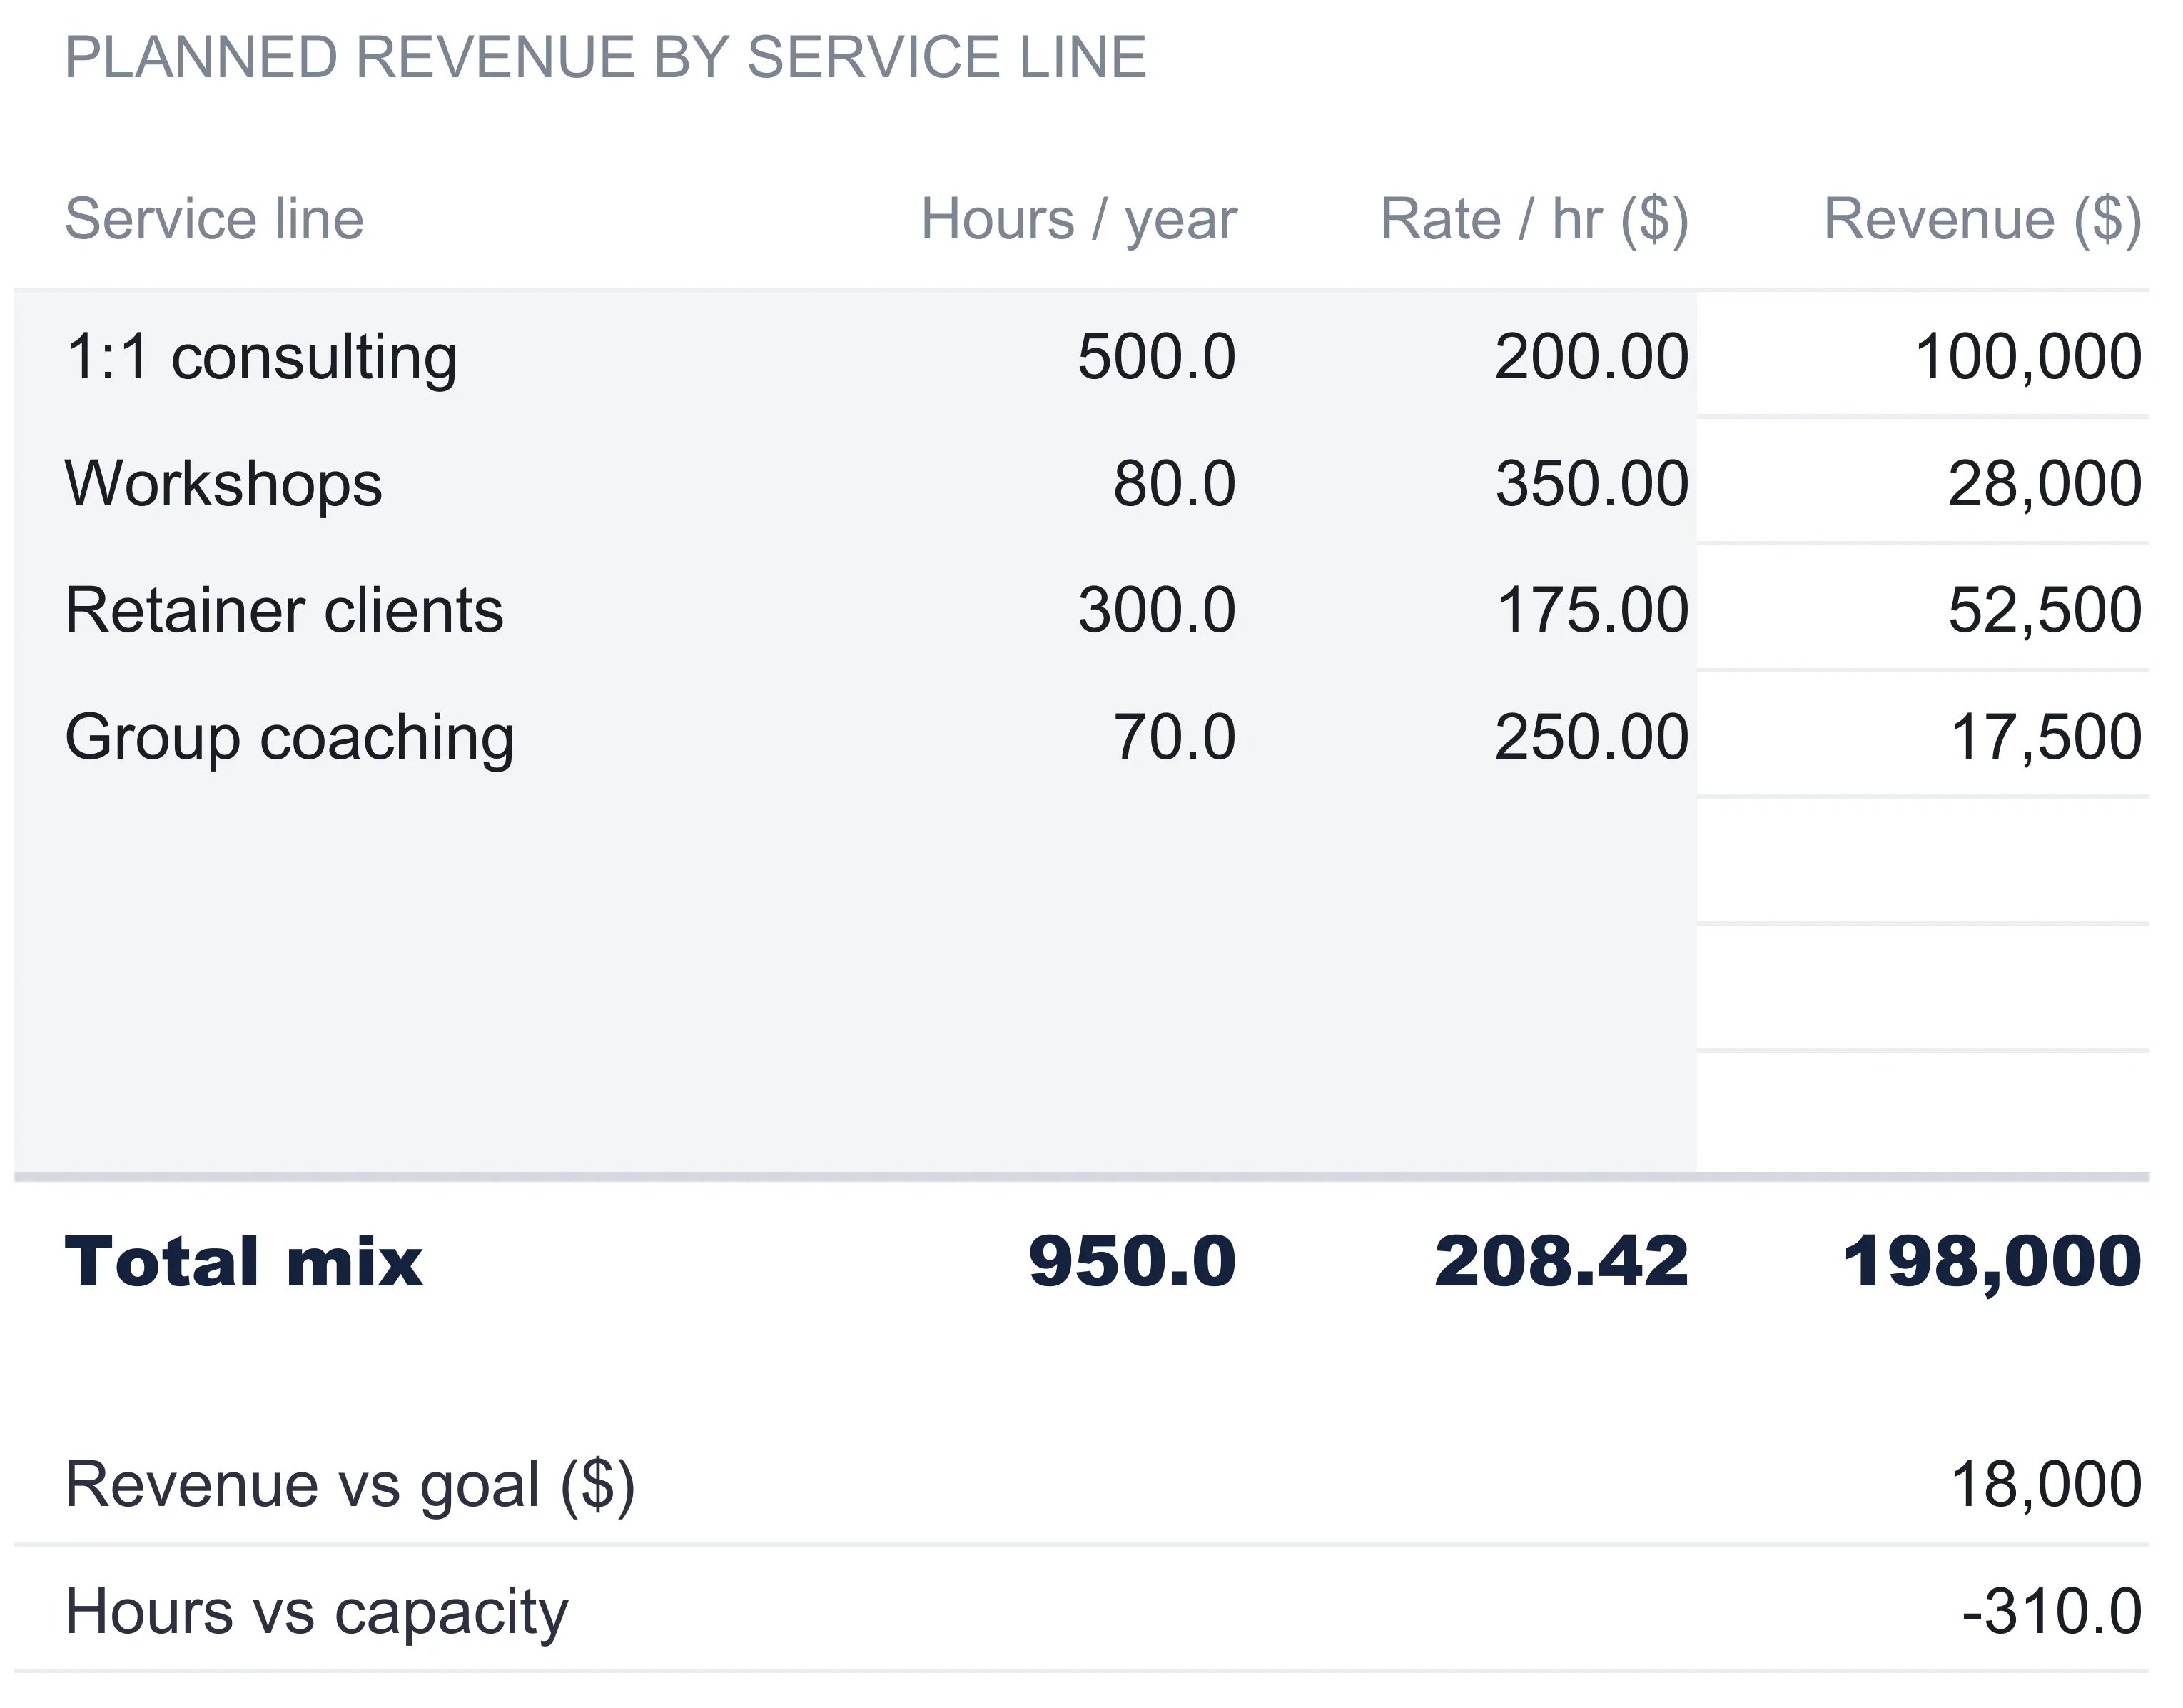
The three blank rows are pre-wired the same way the filled ones are. Their revenue formula and their place inside every total and the chart already exist, so naming a fifth service line on the first empty row folds it into the blended rate and the variance lines with no formula to drag or range to extend. A consultant adding a productized audit or a speaking line just types it in and the sheet absorbs it.
Compare the levels of ambition: the Scenarios sheet
A single rate calculation answers one question at one goal. The Scenarios sheet answers three at once, because the two levers that matter most, the revenue goal and the billable percentage, tend to move together in practice. A leaner year usually means both a lower target and a looser calendar; a stretch year means a higher target and a tighter one.
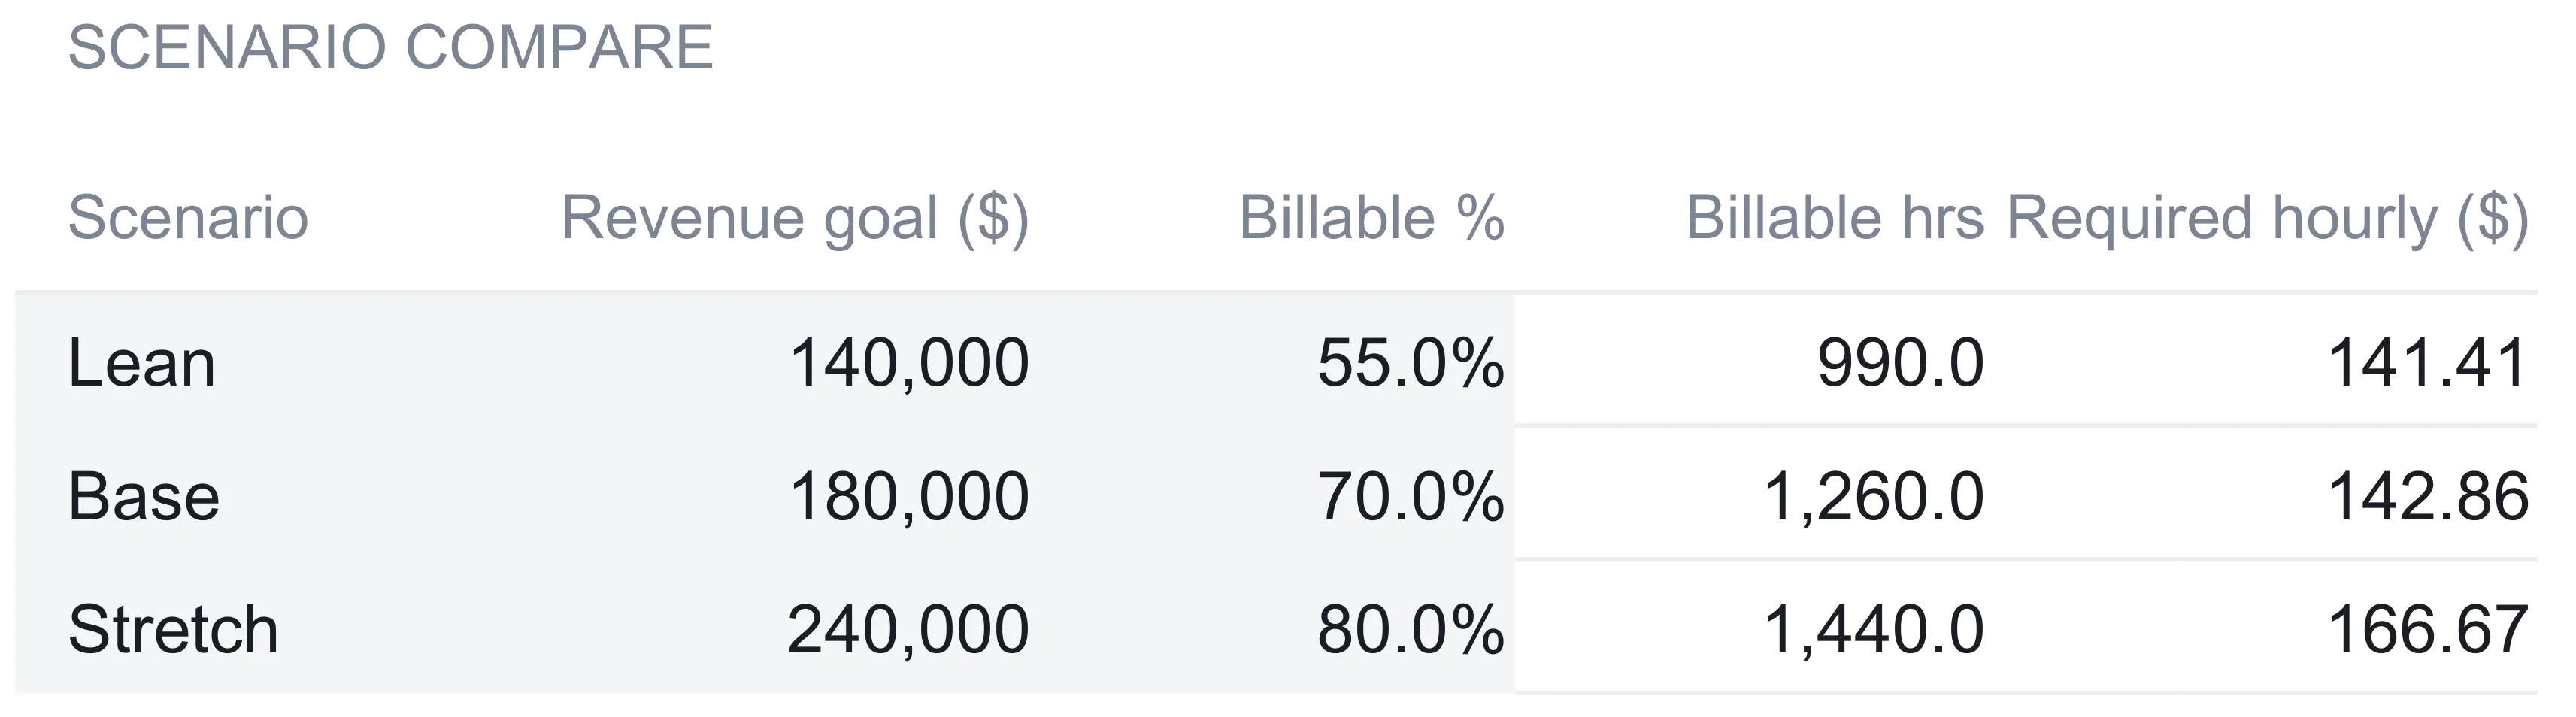
The sheet holds three named scenarios, each with its own revenue goal and its own billable percentage. It applies that percentage to the 1,800 total available hours from Capacity to get a scenario-specific billable-hours figure, then divides the scenario’s goal by those hours for a required hourly:
| Scenario | Revenue goal ($) | Billable % | Billable hrs | Required hourly ($) |
|---|---|---|---|---|
| Lean | 140,000 | 55% | 990 | 141.41 |
| Base | 180,000 | 70% | 1,260 | 142.86 |
| Stretch | 240,000 | 80% | 1,440 | 166.67 |
The Base row is not a fourth set of assumptions. The on-sheet note confirms it ships with the same revenue goal and billable percentage as the Capacity plan, so it reproduces the 1,260 billable hours and 142.86 rate from the main calculation exactly, giving the other two scenarios a fixed anchor to read against.
The comparison it enables is subtle and worth sitting with. The Lean scenario aims lower, 140,000, but at only 55 percent utilization it has just 990 billable hours to hit it, so the required rate barely drops, to 141.41. The Stretch scenario aims much higher, 240,000, and even at a demanding 80 percent utilization it needs 166.67 an hour. The template’s own note captures the trade in one line: a lower billable percentage means a harder rate target, and a higher billable percentage means a longer week. In plain terms, you can chase a number by raising your rate or by billing more of your hours, and neither is free. The sheet does not tell you which lever to pull. It shows what each one costs.
The dashboard: eight numbers and a verdict
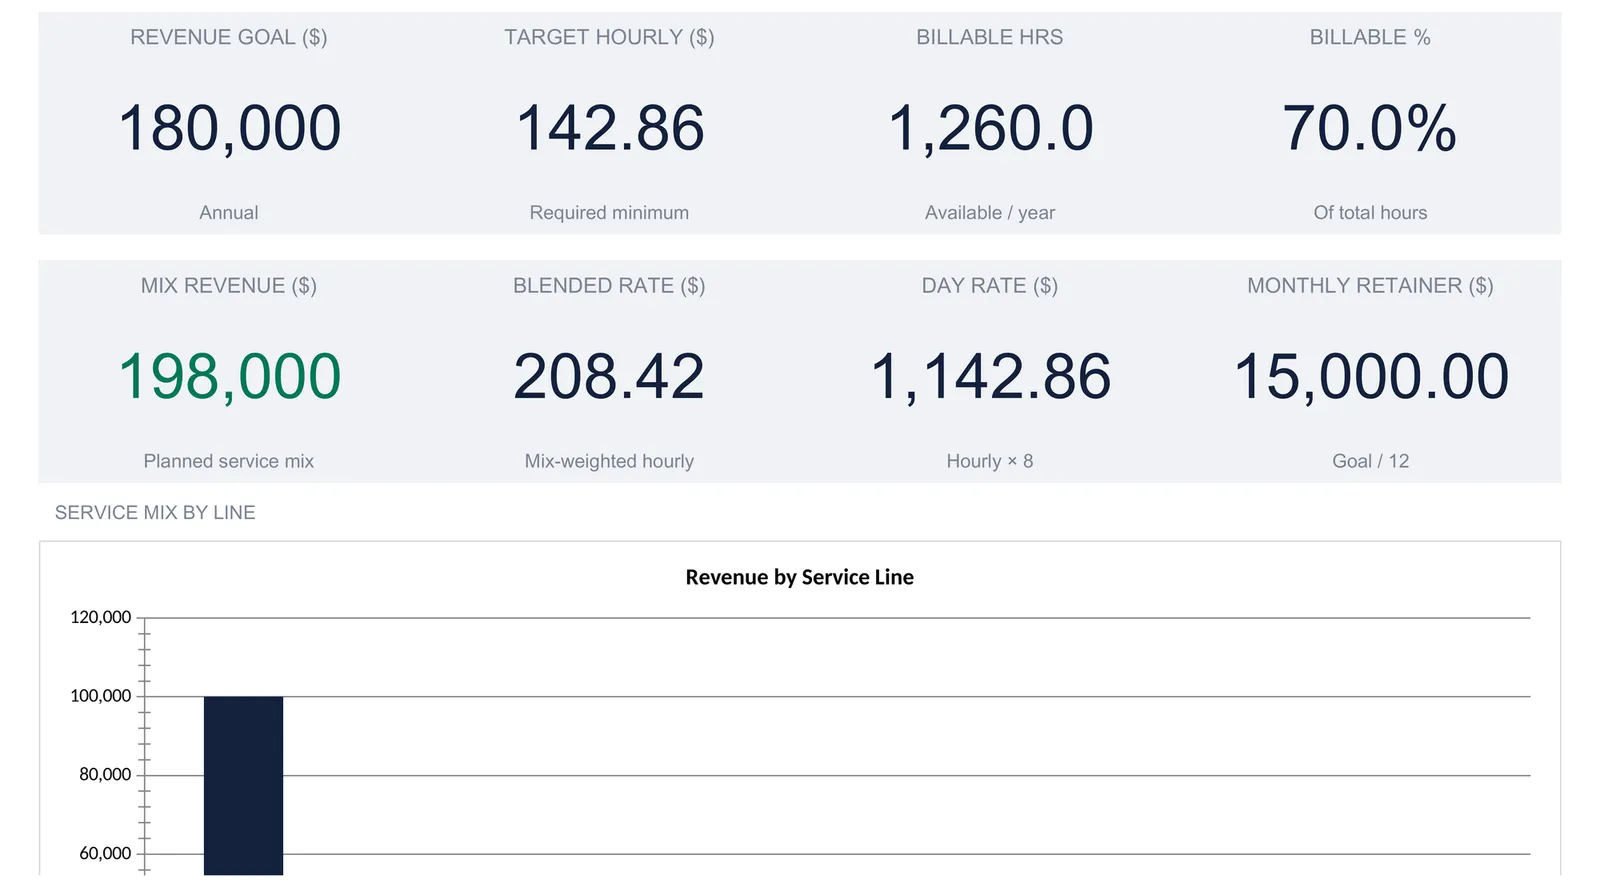
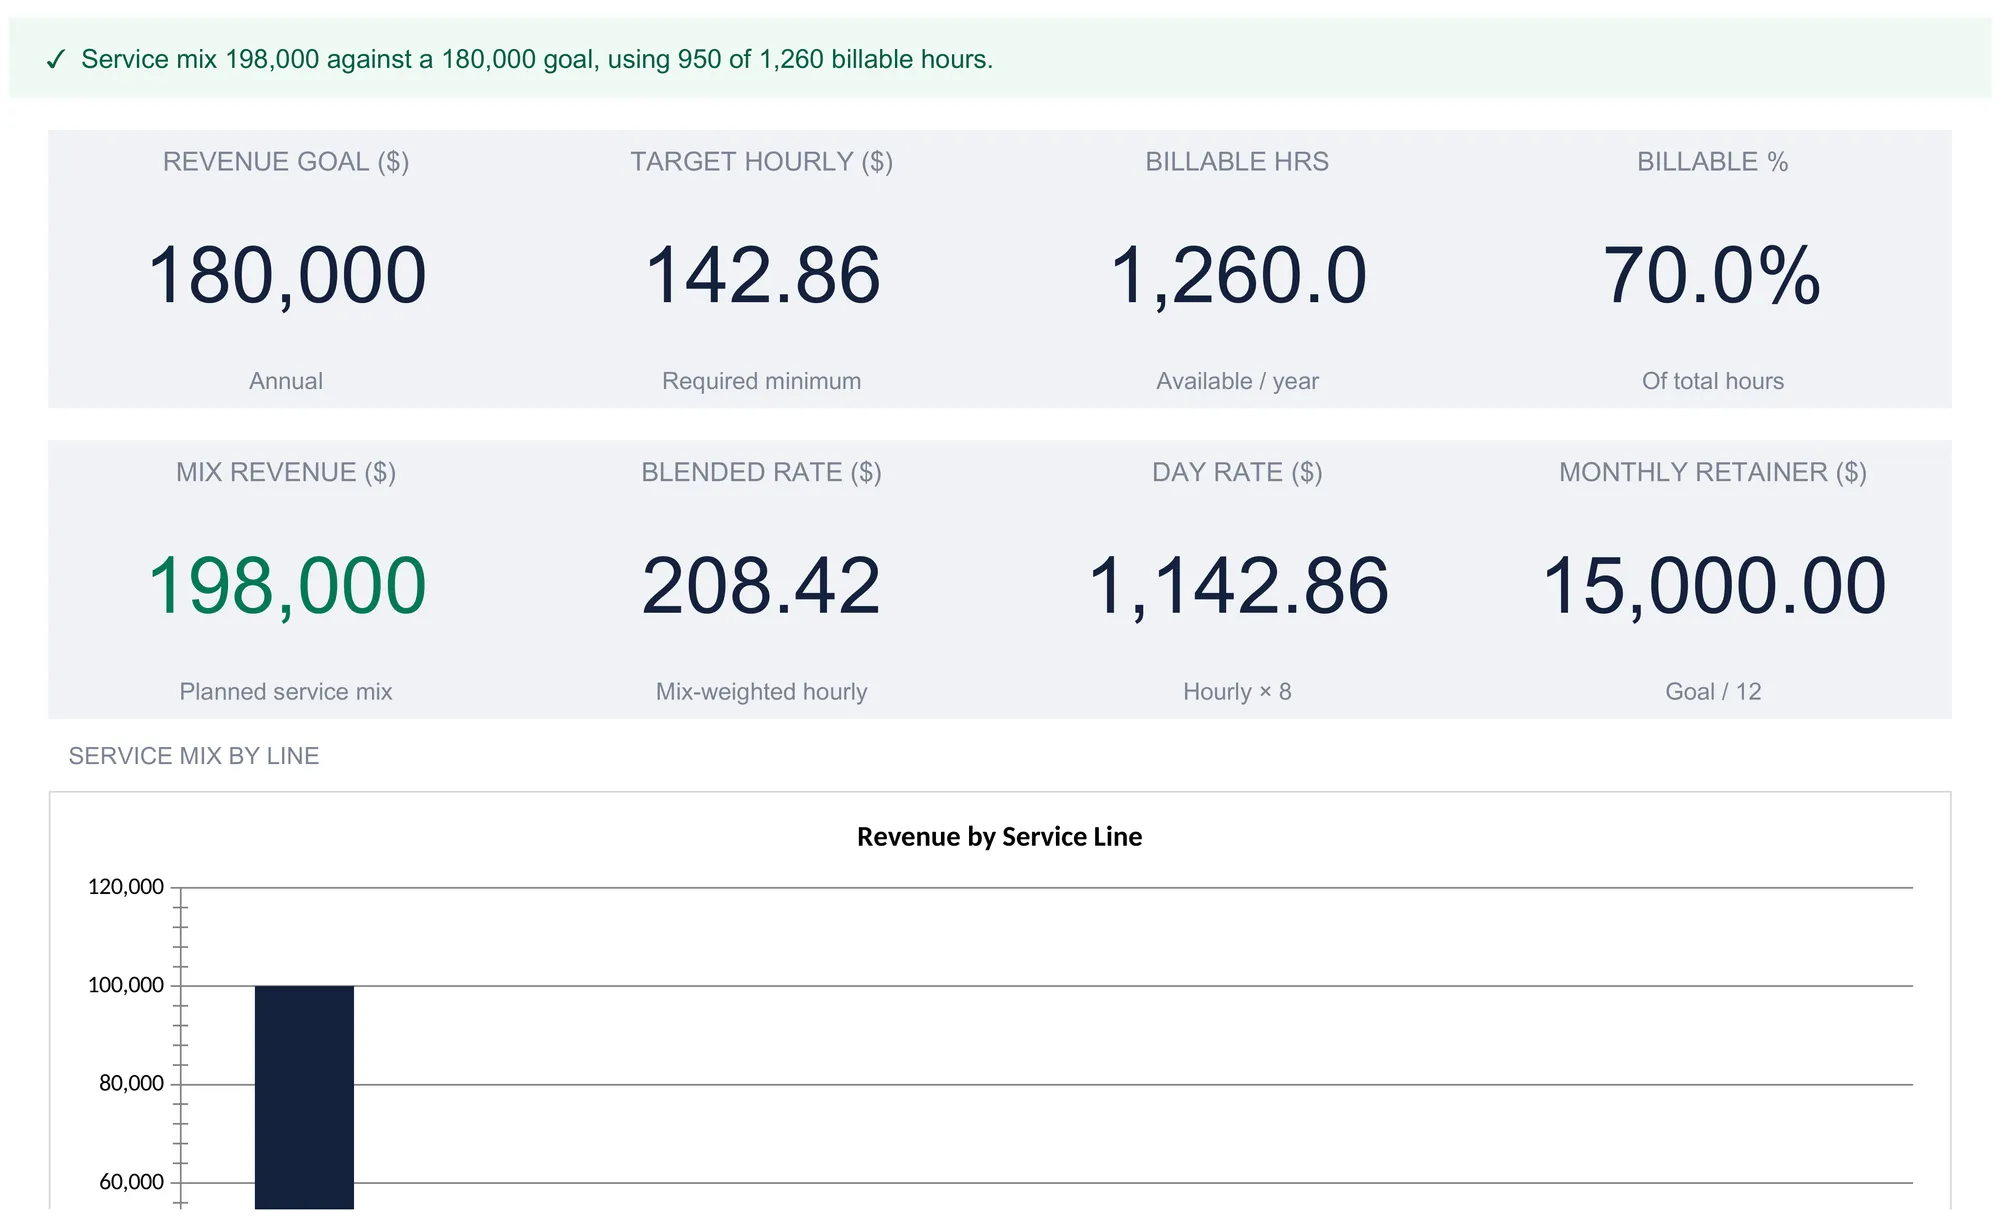
With the five sheets filled, the Dashboard reads across them and reports the practice in one screen. A banner across the top restates the goal and currency, and a status line below it delivers the verdict in a single sentence. In the sample it reads: “Service mix 198,000 against a 180,000 goal, using 950 of 1,260 billable hours,” carrying a check mark because two conditions are both met. The planned mix reaches the revenue goal, and it does so inside the billable hours available. If either falls short, the check mark becomes a warning and the same sentence still shows both figures, so the shortfall is never hidden.
Below the banner sit eight KPI tiles:
| Tile | Sample value | What it is |
|---|---|---|
| Revenue goal | 180,000 | The annual target from Settings |
| Target hourly | 142.86 | Required minimum, goal ÷ billable hours |
| Billable hrs | 1,260.0 | Available per year, from Capacity |
| Billable % | 70.0% | Utilization, billable ÷ total hours |
| Mix revenue | 198,000 | Planned service mix total |
| Blended rate | 208.42 | Mix-weighted hourly, mix revenue ÷ mix hours |
| Day rate | 1,142.86 | Required hourly × 8 |
| Monthly retainer | 15,000.00 | Goal ÷ 12 |
Only the mix-revenue tile carries a color: it turns green at or above the goal and red below it. Every other tile stays neutral, and the reason is a deliberate one that the How to Use sheet states outright. The workbook has no view on what your rate should be. It reports the target hourly, the blended rate, and the day rate as facts derived from your inputs, and leaves the judgment of whether those numbers are right for your market to you. As with the rest of the workbook, any tile with nothing to divide by reads “N/A” rather than a false zero.
Beneath the tiles, two charts turn the tables into pictures. One plots revenue by service line, so the 100,000 of one-to-one consulting towers over the 17,500 of group coaching at a glance. The other plots the required hourly by scenario, lining up Lean, Base, and Stretch. The dashboard render above is cropped to the tiles and the top of the first chart, so only the leading bar of the service-line chart is visible in the image; the full charts sit further down the sheet in the file itself.
Billable capacity and utilization in plain terms
Two pieces of jargon do most of the work in this template, and both are simpler than they sound.
Billable capacity is just the hours left to sell after everything else is removed. It starts from a full calendar, takes out the weeks you are not working, and then takes out the share of working hours spent on things clients never see. In the sample that chain runs 52 weeks to 45 working weeks to 1,800 total hours to 1,260 billable hours. It is the single most important number in a rate calculation, because it is the denominator, and a rate built on an inflated capacity is a rate that quietly misses its goal.
Utilization, the billable percentage, is the ratio of billable hours to total hours, 1,260 ÷ 1,800 = 70 percent in the sample. It answers “of the hours I am at work, how many can I actually invoice?” A solo consultant carries their own sales, marketing, bookkeeping, and learning, so the number is always well under 100 percent, and the template treats the exact figure as an input rather than a target. The Scenarios sheet exists mostly to show how much this one percentage moves the required rate: nudge it from 70 to 55 and the same goal has to be squeezed from far fewer hours.
The relationship between the two is the whole model in a sentence. Revenue goal divided by billable hours gives the rate, and billable hours is total hours multiplied by utilization. So the rate rises when the goal rises, when hours off rise, or when utilization falls, and the spreadsheet lets you move any of those three and watch the rate respond.
Where the numbers meet tax time
A required hourly of 142.86 is a billing target, not take-home pay, and it helps to remember why. A solo consultant is typically a sole proprietor, and in the US that means self-employment tax on top of income tax, paid without an employer withholding anything along the way. The IRS Self-Employed Individuals Tax Center describes both the self-employment tax that funds Social Security and Medicare and the quarterly estimated payments that stand in for a paycheck’s withholding, and business profit itself is reported on Schedule C. None of that changes the arithmetic in this workbook, which is about gross billings against a revenue goal, but it is the reason the revenue goal on Settings is worth setting with taxes and overhead already in mind. Building the rate that reaches a chosen gross number is exactly what the template does. Deciding what that gross number needs to be is a separate planning step, and a tax professional can help size it for a specific situation.
Excel or Google Sheets for a consulting rate calculator
The template is an .xlsx file built entirely on ordinary formulas, with no macros and no add-ons, so it behaves identically in Microsoft Excel and in Google Sheets after an upload. Google Sheets suits a consultant who wants to tweak the goal from a phone between calls and keep the file in a browser; Excel suits one who prefers a local file and a desktop. Because the whole thing is plain arithmetic across seven sheets, the hourly rate calculator, the capacity model, and the scenario compare all recalculate the same way in either program, and the structure described here is equally buildable by hand in both.
Which template fits which practice
- Solo Consultant Rate & Capacity Spreadsheet Template ($29) is the workbook this walkthrough follows: the capacity model, the rate calculator, the service-mix planner, the Lean/Base/Stretch scenarios, and the eight-tile dashboard, sized for a one-person knowledge-work business.
- Tiny Agency Capacity Spreadsheet Template ($39) is the next step up when a practice grows past one person. It tracks per-person utilization, a weighted pipeline, gross margin, and a hiring trigger for a two-to-five-person services firm, which are the questions that arrive once you are billing other people’s time as well as your own.
Both start from capacity, but they put it to different use. The solo version divides a revenue goal by billable hours to derive a rate, while the agency version takes each person’s bill rate as an input on the Team roster and measures forecast hours against roster capacity to read utilization.
Related
- Freelancer Cash Flow Spreadsheet: Monthly Reconciliation in 15 Minutes - once the rate is set, the monthly view of money in and out
- Side Hustle Calculator: Your Real Profit After Taxes and Expenses - the take-home side of a billing number, after taxes and costs
- How to Track Business Taxes in a Spreadsheet - the quarterly and annual tax view a self-employed consultant files from
Frequently asked questions
How do you calculate a consulting rate from a revenue goal?
Divide the annual revenue goal by the number of hours you can actually bill in a year. In the sample, a 180,000 goal divided by 1,260 billable hours gives a required hourly rate of 142.86. The billable-hours figure is the important half: it comes from a capacity model that removes vacation, holidays, and non-billable admin time before dividing, so the rate reflects a realistic year rather than a theoretical 2,080-hour one.
What is the difference between billable hours and total hours?
Total available hours is every working hour in the year: working weeks times standard hours per week, 45 times 40 equals 1,800 in the sample. Billable hours is what is left after admin and non-billable time is removed. At a 30 percent admin share, 1,800 total hours becomes 1,260 billable hours. The ratio between them, 70 percent here, is the utilization or billable percentage.
What is a good utilization rate for a solo consultant?
The template does not prescribe one, and there is no universal figure. It lets you set the admin or non-billable percentage yourself and shows the consequence: a lower billable percentage leaves fewer hours to divide the goal across, which pushes the required rate up. The Scenarios sheet makes this explicit by comparing 55, 70, and 80 percent side by side.
How is a day rate or monthly retainer derived from an hourly rate?
The workbook derives both from the same required hourly. The equivalent day rate multiplies the hourly by 8, assuming an eight-hour day at the same effective rate, so 142.86 becomes 1,142.86. The equivalent monthly retainer divides the annual goal by 12 directly, so a 180,000 goal is 15,000 a month regardless of hours.
Can the spreadsheet handle different rates for different services?
Yes. The Service Mix sheet takes up to seven service lines, each with its own hours and rate per hour, and computes revenue per line, a total, and a blended rate that is total revenue divided by total hours. In the sample, four lines priced from 175 to 350 per hour blend to 208.42 across 950 hours, which sits above the 142.86 minimum the flat calculation requires. It works the same in Excel and in Google Sheets, since the file is plain formulas with no macros.
Sources
- Self-Employed Individuals Tax Center - Internal Revenue Service
- About Schedule C (Form 1040), Profit or Loss from Business - Internal Revenue Service
About this article
Sheets, inputs, formulas and sample figures checked on 2026-09-10 against the shipped Solo Consultant Rate & Capacity workbook (Dashboard, Capacity, Rate Calculator, Service Mix, Scenarios, Settings, How to Use) and against the Tiny Agency Capacity workbook for the comparison section. Self-employment tax context checked against the live IRS Self-Employed Individuals Tax Center and Schedule C pages at writing time. Last reviewed September 2026.