A course launch P&L keeps every launch on one sheet and derives the rest: units from audience and conversion, gross from price, net revenue after refunds and processing, ROAS against ad spend, and a year total that adds the evergreen baseline. This walkthrough follows the full structure using a worked example - four launches, 2,050 units, $919,050 gross, and $701,016 profit for the year. Our Course Launch P&L Spreadsheet Template ($39) ships the same structure ready-made for Excel and Google Sheets.
A course launch looks simple from the outside: open the cart, run some ads, count the sales. The finances underneath are not simple at all. A single launch carries an audience size, a conversion rate, a price, refunds that trickle in for weeks, payment processing on every sale, per-student delivery costs, affiliate commissions, and the ad spend that drove the traffic. Stack four launches on top of each other in a year, add the evergreen sales that run quietly in between, and the question “did this launch actually make money?” gets hard to answer from a checkout dashboard alone. That dashboard reports gross. It has no idea what the ads cost or how many students asked for a refund.
Structure is what turns that pile of numbers into a profit-and-loss statement. For a course business the structure is five pieces: a set of cost constants that apply to every sale, one row per launch, the ad spend and return on that spend, a cost breakdown that ties each launch to its refunds and fees, and an evergreen baseline that runs all year. The examples below come from our Course Launch P&L Spreadsheet Template ($39), which ships the whole model ready-made for Excel and Google Sheets. The layout is reproducible by hand if you would rather build your own.
What a course launch P&L has to hold
Strip away the platform analytics and there are only five kinds of data in a course business:
- Cost constants. The rates that apply to every sale regardless of which launch it belongs to: the refund rate, payment processing, per-sale delivery, and the affiliate arrangement. These are set once.
- Per-launch records. For each launch, the audience it reached, the conversion rate, and the price. Everything about that launch’s revenue follows from those three numbers.
- Ad spend. What each launch cost to promote, which is the number that turns gross revenue into an honest picture of return.
- Cost breakdown. The refunds, processing, delivery, and affiliate amounts that each launch generated, computed from the constants so nothing is double-entered.
- Evergreen revenue. The steady, always-on income between launches that a launch-by-launch view would otherwise miss.
The template gives each of these its own sheet: Settings, Launches, Marketing, Refunds & Costs, and Evergreen, with a Dashboard on top and a How to Use sheet carrying the instructions. Seven sheets in total, and only a handful of cells across them are ever typed.
Start with the constants: the Settings sheet
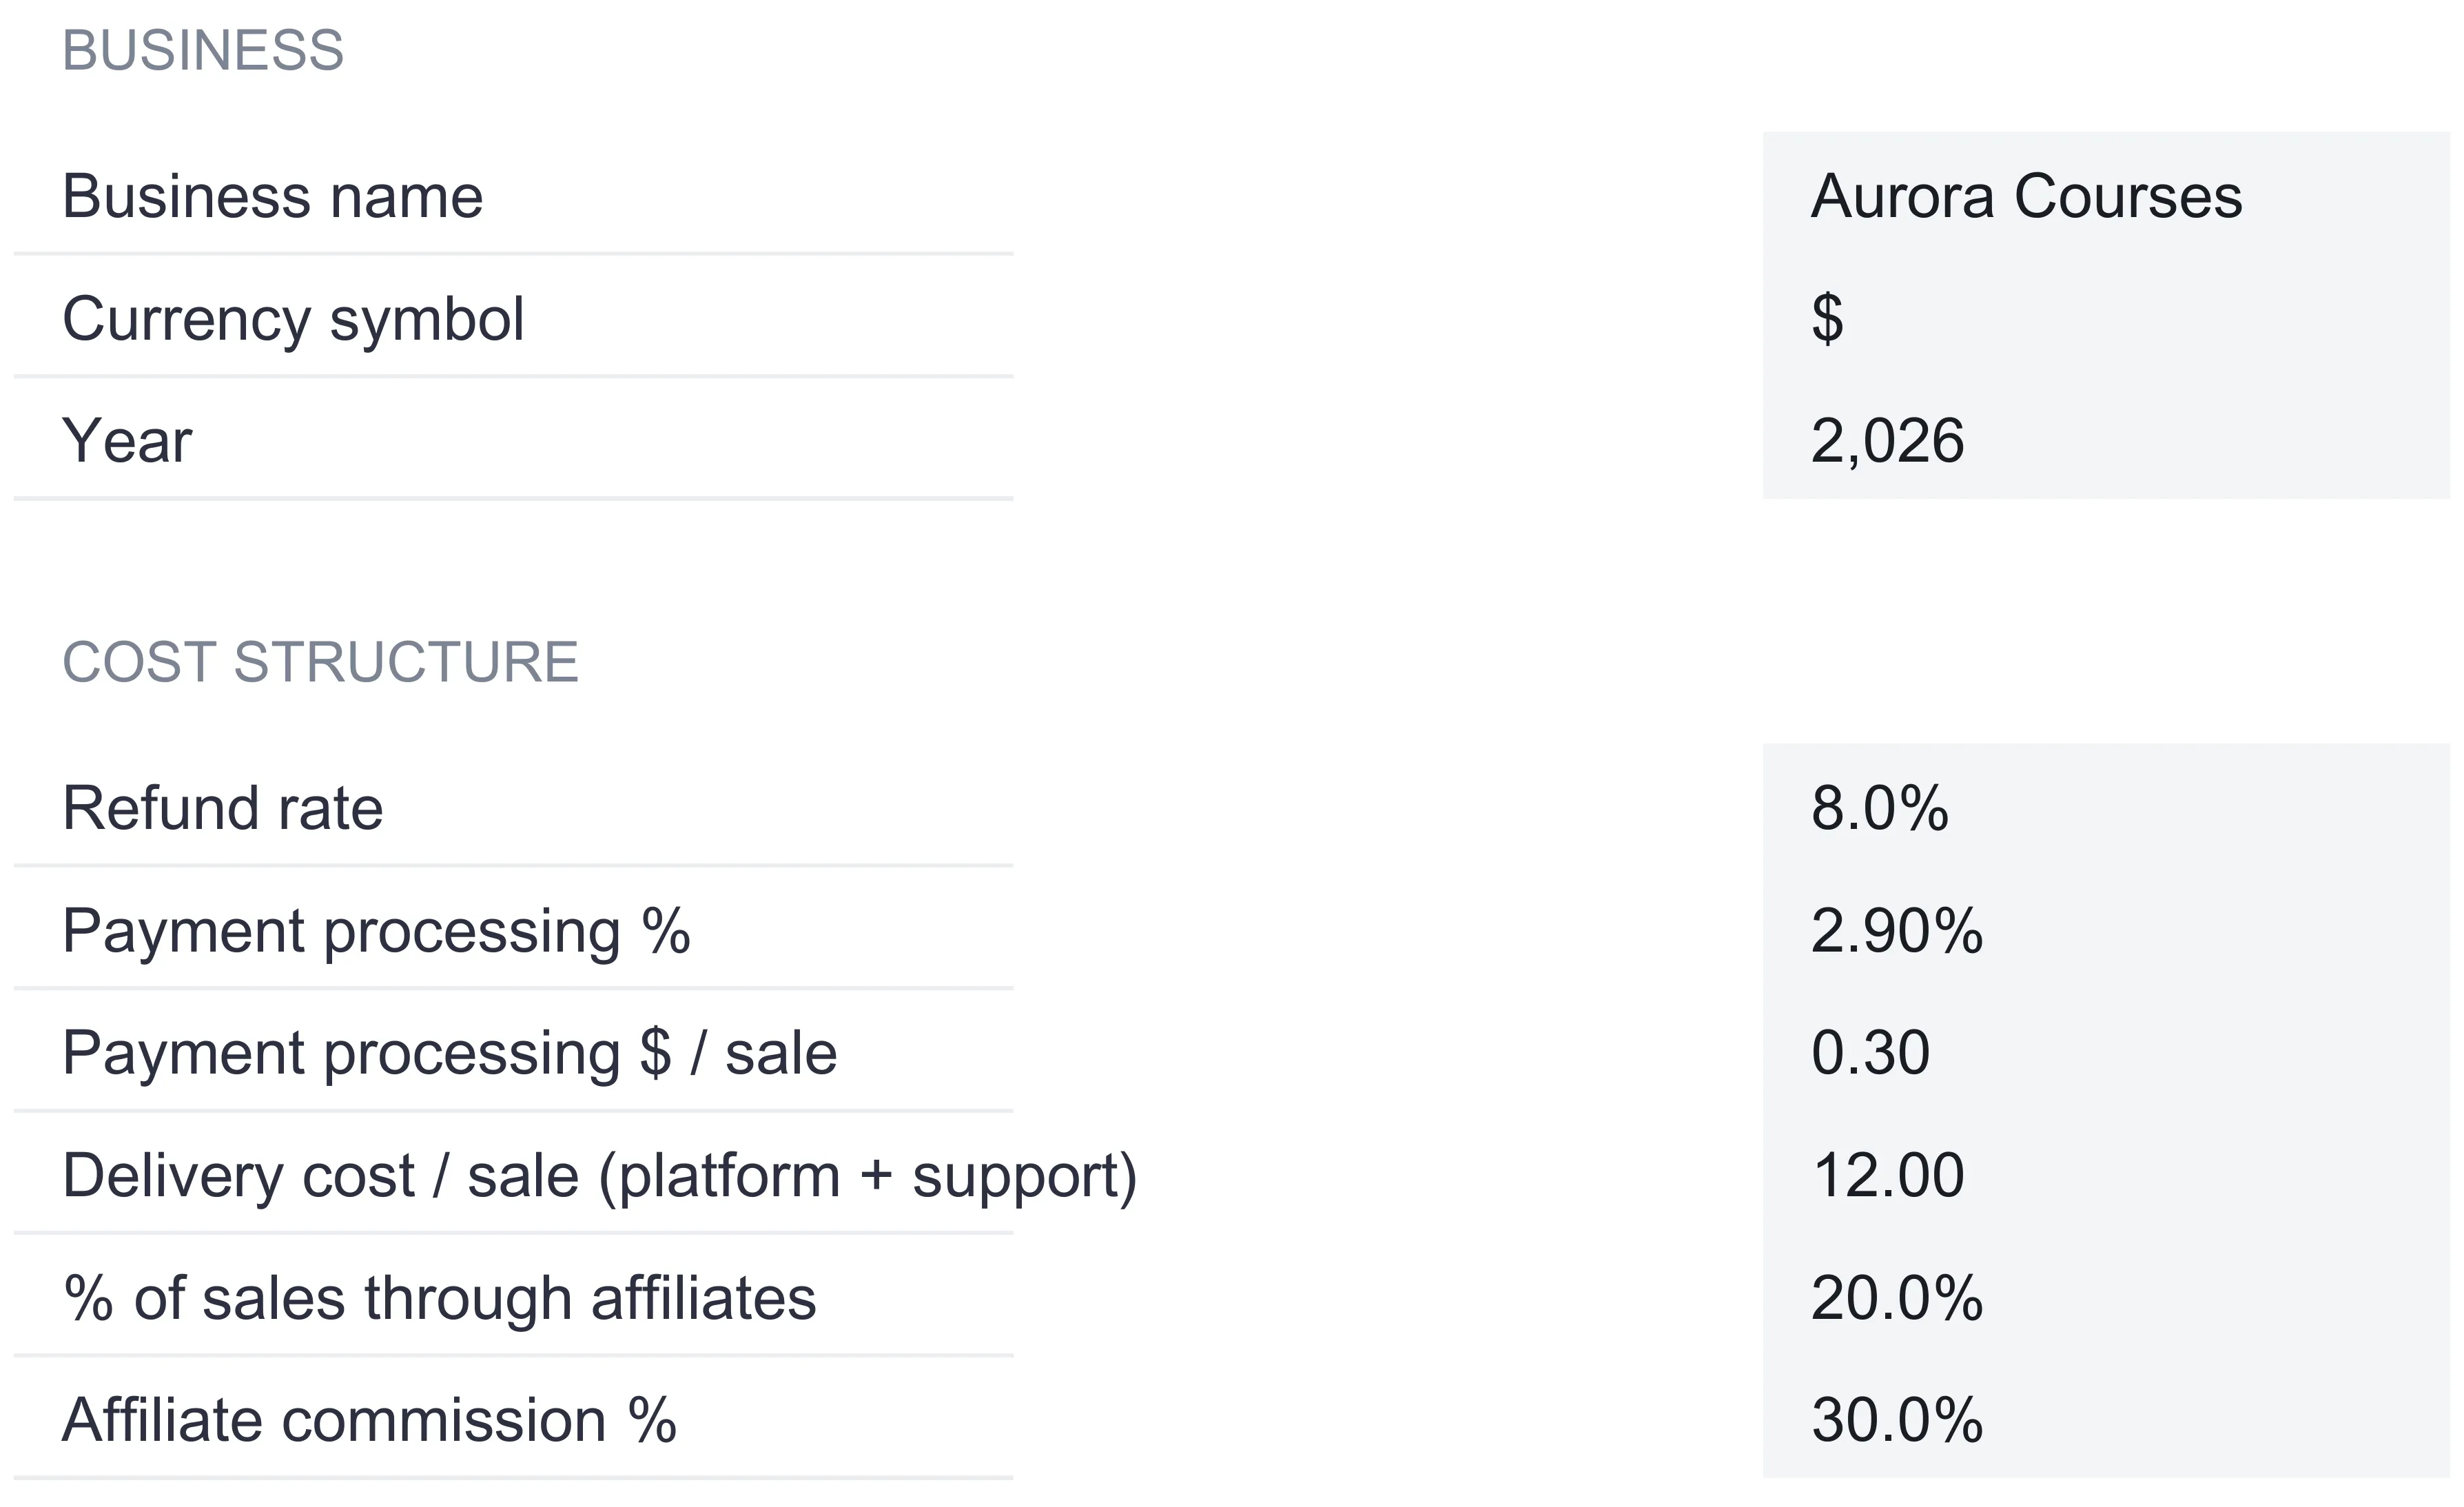
Six cost rates on the Settings sheet drive every launch calculation downstream, so they come first. Set them once and they apply uniformly across every launch.
Refund rate. The share of gross revenue that comes back as refunds. The sample uses 8 percent. Course refunds arrive over days and weeks after a launch closes, so modeling them as a rate rather than waiting for the final count keeps net revenue realistic while a launch is still settling.
Payment processing, two parts. A percentage of each sale, 2.9 percent in the sample, plus a flat amount per sale, 30 cents. Splitting processing into a percentage and a per-transaction fee mirrors how most checkout processors actually bill, so a launch of many small orders and a launch of a few large orders each carry the right processing cost.
Delivery cost per sale. A flat per-student cost for platform hosting and support, 12 dollars in the sample. This scales with the number of students, not with revenue, which is why it is modeled per sale rather than as a percentage.
Affiliate arrangement, two parts. The share of sales that come through affiliates, 20 percent in the sample, and the commission those affiliates earn, 30 percent. Multiplying the two gives the effective affiliate cost as a fraction of gross, which works out to 6 cents on every gross dollar here.
The sheet also holds the business name, the tracking year, and a currency selector with 35 symbols. Changing the symbol relabels every money column and KPI across the workbook. It relabels only, with no conversion of the underlying numbers. A note on the sheet flags that these rates apply uniformly across launches and can be adjusted inside individual formulas if a particular launch used a different stack.
Log each launch once: the Launches sheet
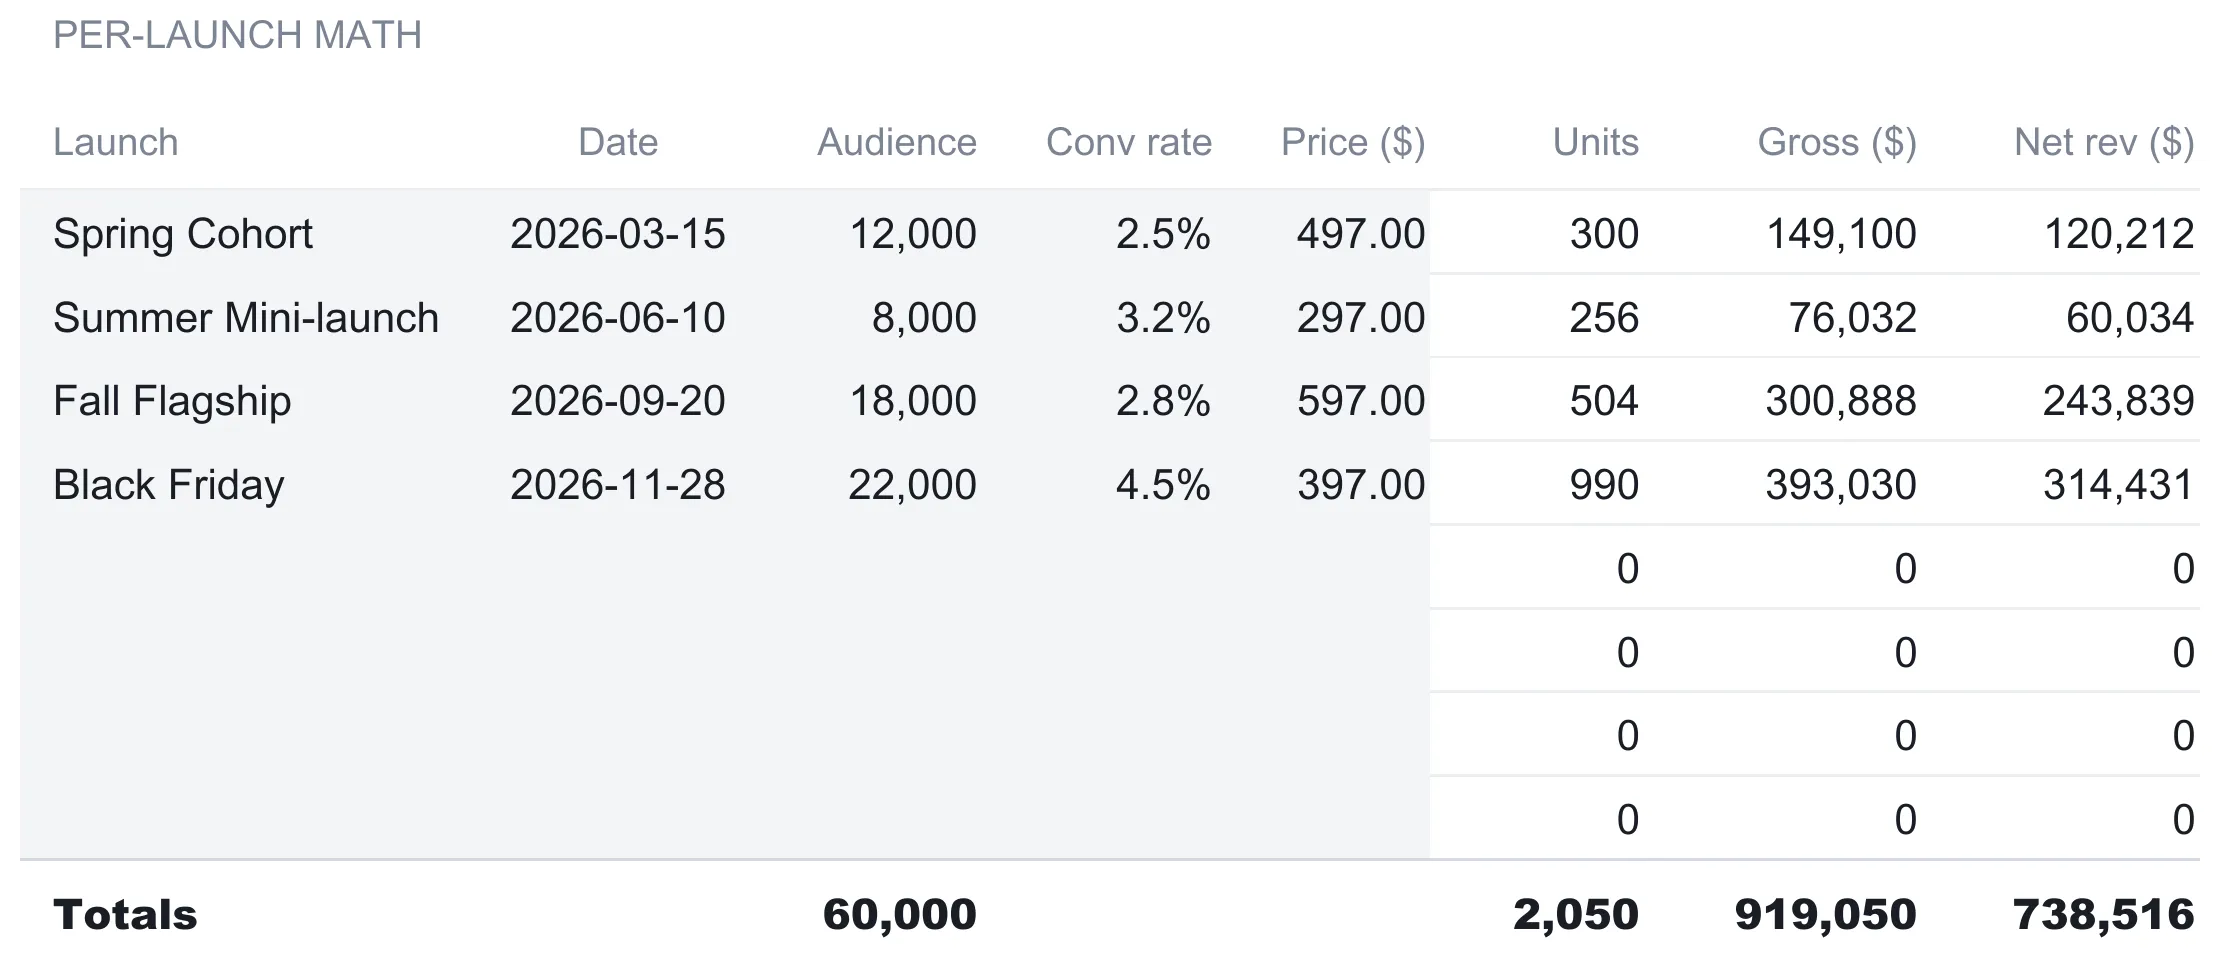
The Launches sheet is where a launch is actually entered, and it is the only place its raw inputs are typed. Five columns are entries: the launch name, the date it opened, the audience it reached, the conversion rate, and the price. Three more are formulas that carry the launch from an audience to a net revenue figure:
- Units = audience × conversion rate, rounded to whole buyers
- Gross = units × price
- Net revenue = gross, less refunds, processing, delivery, and affiliate costs
That net revenue formula is the heart of the model. In words, it takes gross and removes the percentage costs (refund rate, processing percentage, and the affiliate share times the commission) and then removes the per-sale costs (processing per sale plus delivery) multiplied by the number of units. With the sample constants, the percentage costs come to 16.9 percent of gross and the per-sale costs come to $12.30 per student.
One launch makes the flow concrete. The Fall Flagship reached an audience of 18,000 at a 2.8 percent conversion rate, which rounds to 504 units. At a $597 price that is $300,888 gross. The percentage costs strip out about 16.9 percent, the per-sale costs take $12.30 across 504 students, and $243,839 lands as net revenue. Do that for all four launches and the totals row reads a combined 60,000 audience, 2,050 units, $919,050 gross, and $738,516 in net revenue for the year.
The four sample launches are deliberately different from one another, which is what makes the sheet worth reading side by side. The Spring Cohort sells a $497 course to a 12,000 audience at a 2.5 percent conversion, producing 300 units and $149,100 gross. The Summer Mini-launch drops the price to $297 for a smaller 8,000 audience but converts higher at 3.2 percent, for 256 units and $76,032 gross. The Fall Flagship is the premium event at $597. The Black Friday launch is the volume event: the lowest-but-one price at $397, aimed at the largest 22,000 audience, and converting hardest at 4.5 percent for 990 units and $393,030 gross, more than any other launch in the year. A single price or a single conversion rate would flatten those differences. Giving each launch its own row keeps them visible, and the totals still add up across launches that look nothing alike.
Two design details are worth copying into any hand-built version.
Spare rows are pre-wired. The four blank rows below the sample launches already carry the units, gross, and net revenue formulas and already sit inside every total, cost breakdown, and chart. The next launch goes on the first free row and the whole workbook updates, with no formula to drag down. That gives a single file room for up to eight launches in a year.
Everything downstream reads this one sheet. The Marketing sheet, the Refunds & Costs sheet, and the dashboard all pull from these rows, so they cannot drift apart. Spreadsheets that break tend to break exactly here, when a launch gets typed into one summary but not another.
Measure the ad spend: the Marketing sheet
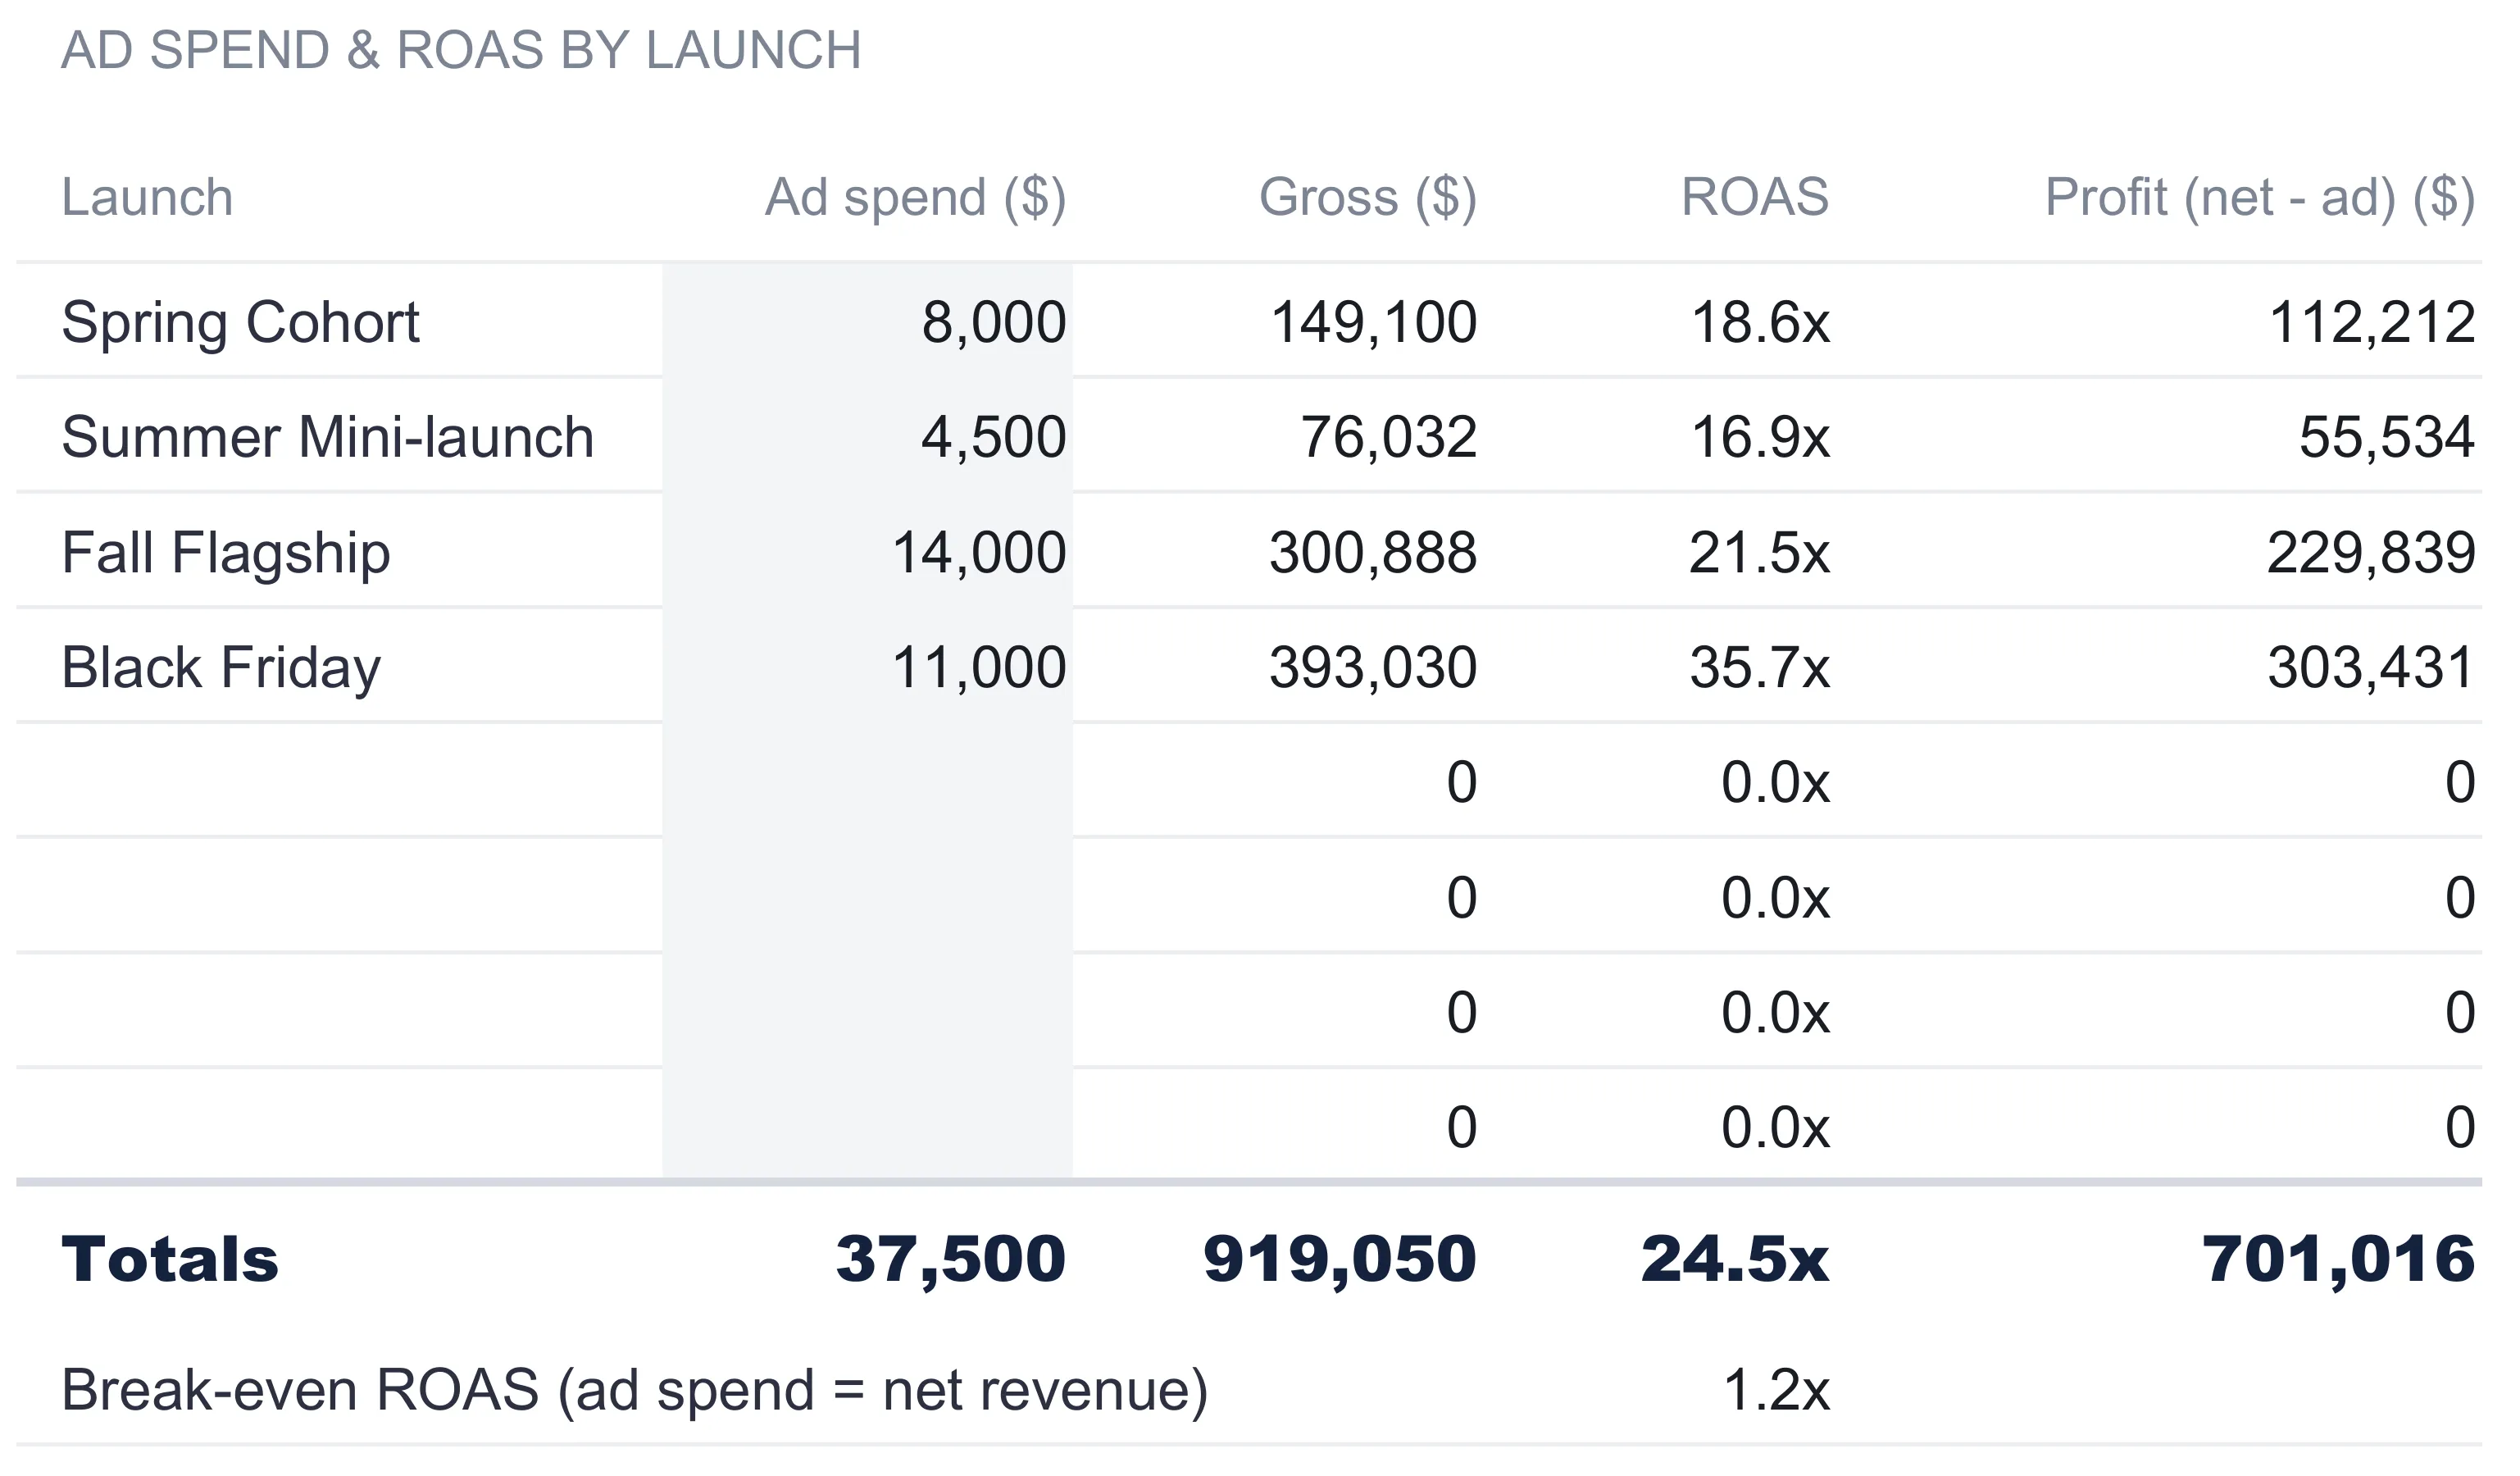
Gross revenue on its own says nothing about whether a launch was worth running, because it ignores what the launch cost to promote. The Marketing sheet fixes that by placing ad spend next to gross for each launch and computing two things from the pair.
ROAS, return on ad spend, is gross revenue divided by ad spend. The Black Friday launch grossed $393,030 on $11,000 of ads, a 35.7x return, while the Summer Mini-launch grossed $76,032 on $4,500, a 16.9x return. The sheet also carries a profit column that subtracts each launch’s ad spend from its net revenue, so the Black Friday launch shows $303,431 of profit against the Summer Mini-launch’s $55,534. Across the year, $37,500 of ad spend drove $919,050 of gross for a blended 24.5x ROAS, and $701,016 of profit after ads.
Break-even ROAS is the quieter number and the more useful one. It is the ROAS at which a launch’s ad spend would exactly equal its net revenue, so anything above it contributes profit. In the sample year that break-even sits at 1.2x. The gap between the 1.2x break-even and the 24.5x blended ROAS is a plain-language picture of how much headroom the ad spend has. Because break-even is computed from net revenue, it moves whenever the refund, processing, delivery, or affiliate rates on Settings change: a course with heavier refunds or richer affiliate commissions carries a higher break-even ROAS, because more of each gross dollar is spoken for before ads are paid.
Trace where the money went: the Refunds & Costs sheet
Net revenue on the Launches sheet is a single number per launch, but a P&L is more useful when the deductions are itemized. The Refunds & Costs sheet breaks each launch’s costs into five columns, all computed from the Settings constants so nothing is entered twice.
- Refunds = gross × the refund rate
- Processing (rate) = gross × the processing percentage
- Processing (per sale) = units × the flat processing fee
- Delivery = units × the per-sale delivery cost
- Affiliate = gross × the affiliate share × the commission rate
For the year, that is $73,524 in refunds, $26,652 in percentage-based processing, $615 in flat per-sale processing, $24,600 in delivery, and $55,143 in affiliate commissions. Add those five and the total, $180,534, is exactly the gap between the $919,050 gross and the $738,516 net revenue. The breakdown is not a separate estimate; it is the same net revenue calculation, shown one cost at a time.
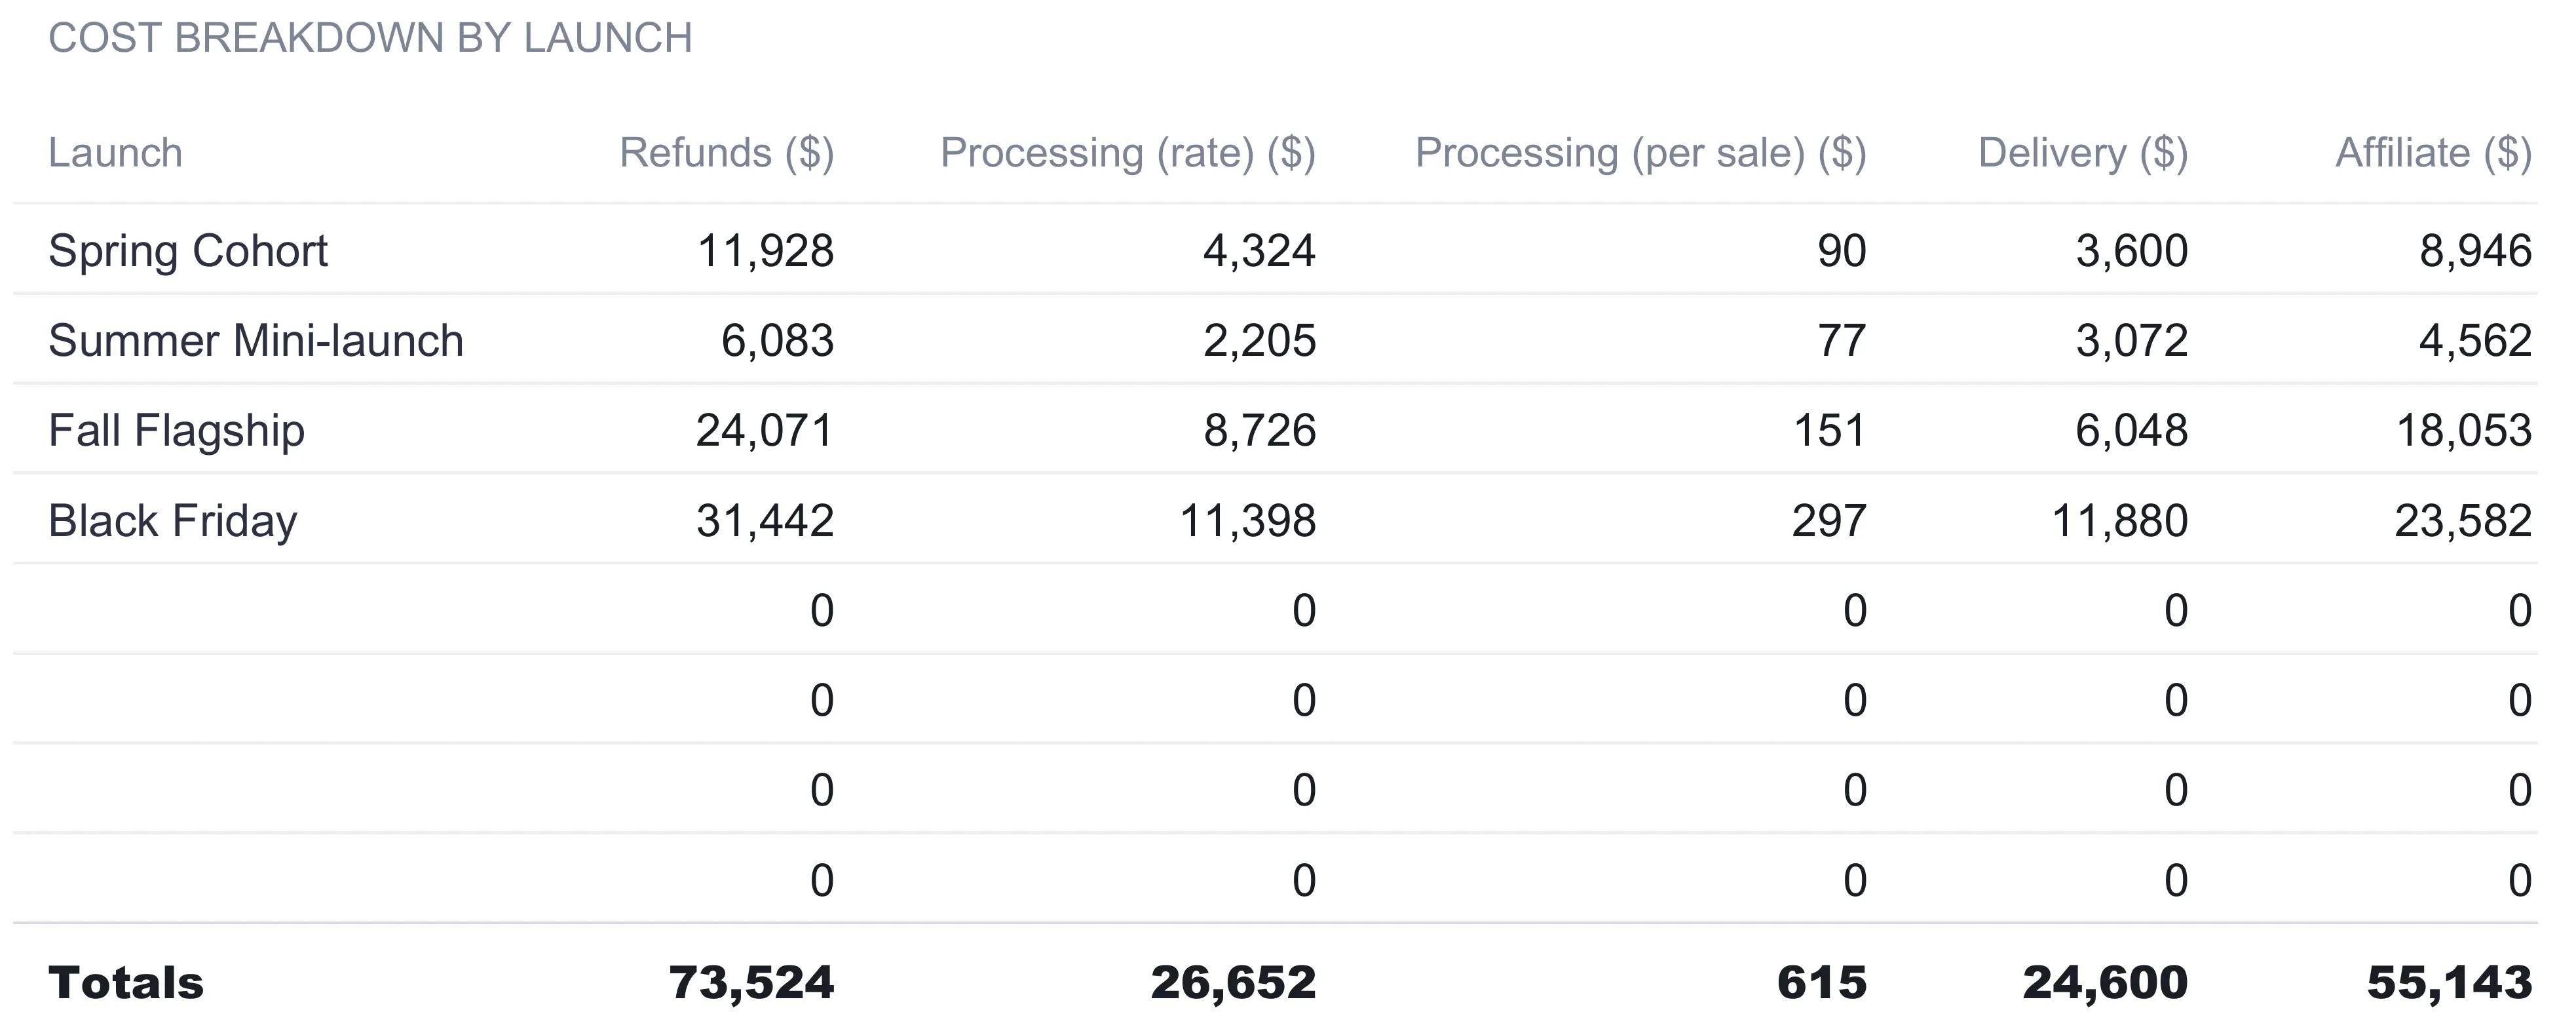
Seeing the costs itemized is where the shape of a course business shows up. Refunds are the largest single line here at $73,524, larger than the entire year’s ad spend, which is the kind of fact a gross-revenue view hides completely. Affiliate commissions are the second largest. A creator watching those two lines grow relative to gross is watching the real economics of the launch, not the headline.
Keep the always-on income separate: the Evergreen sheet
Launches are spiky by nature: a few big weeks and long quiet stretches in between. But most course businesses also sell steadily between launches, through an open sales page, a cohort waitlist, or an automated funnel. The Evergreen sheet captures that on a single line, one figure per month across all twelve months.
In the sample the evergreen line climbs from $3,500 in January to $7,100 in December, totaling $63,500 for the year. It is deliberately kept apart from the launch math, because evergreen revenue behaves nothing like a launch. It carries no ad-spend spike and no launch-week refund wave; it is the baseline the business earns whether or not a cart is open. Keeping it on its own sheet is what lets the dashboard answer the question of how much of the year rides on launches versus how much the business earns quietly on its own.

The dashboard: eight numbers and a verdict
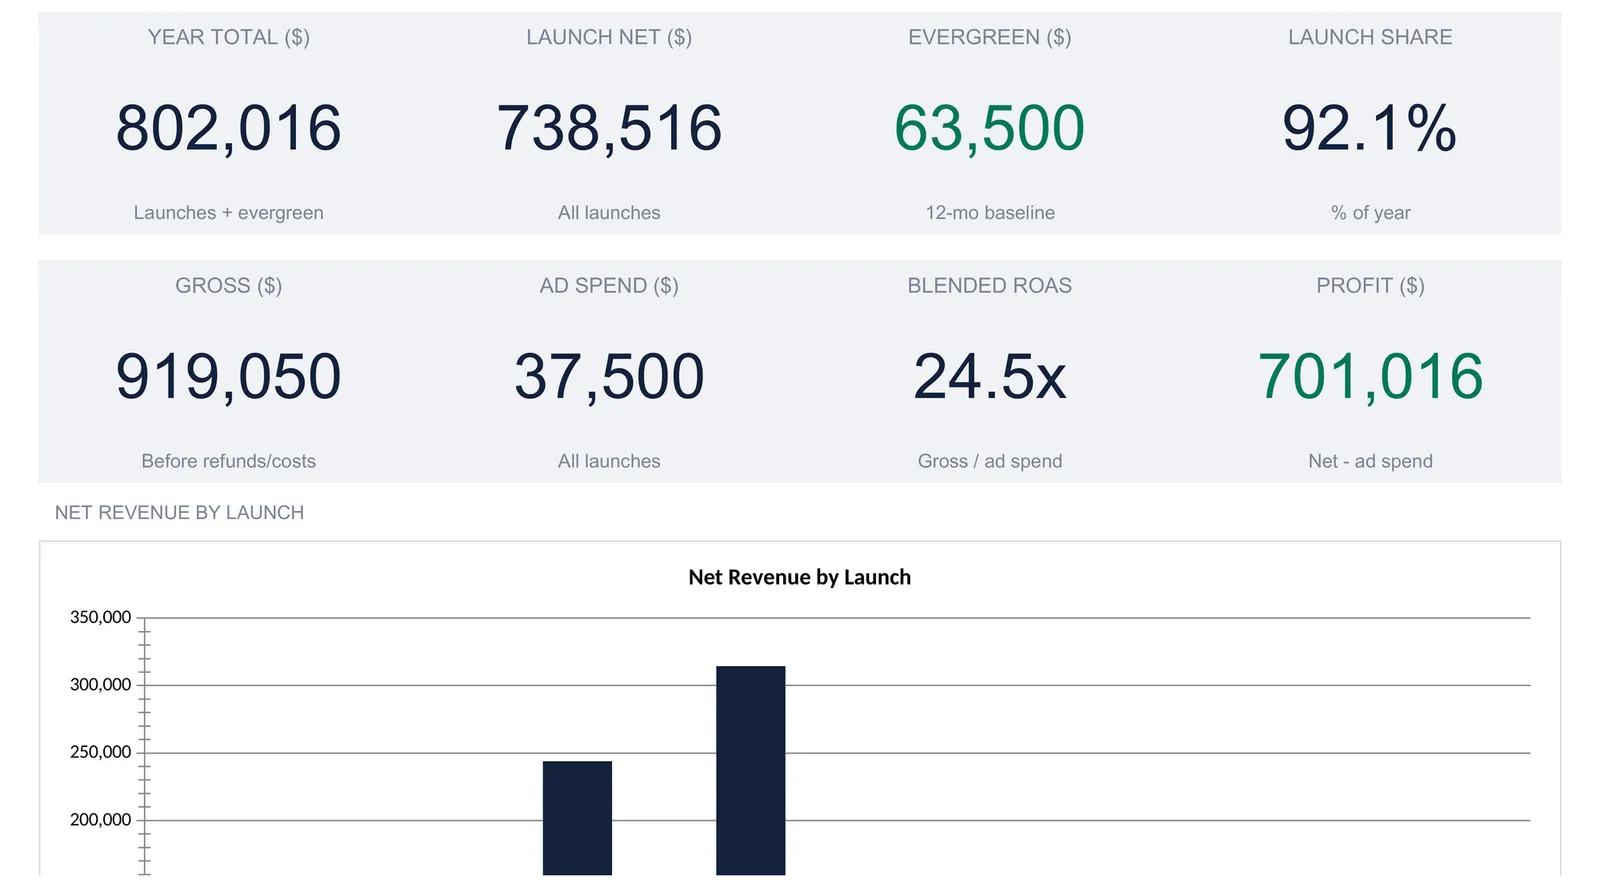
With the input sheets filled, the dashboard computes the year across eight tiles:
| Metric | Sample value | How it is derived |
|---|---|---|
| Year total | $802,016 | Launch net revenue + evergreen |
| Launch net | $738,516 | Net revenue across all launches |
| Evergreen | $63,500 | 12-month always-on baseline |
| Launch share | 92.1% | Launch net ÷ year total |
| Gross | $919,050 | Sum of every launch’s gross |
| Ad spend | $37,500 | Total spent across all launches |
| Blended ROAS | 24.5x | Gross ÷ ad spend |
| Profit | $701,016 | Launch net revenue - ad spend |
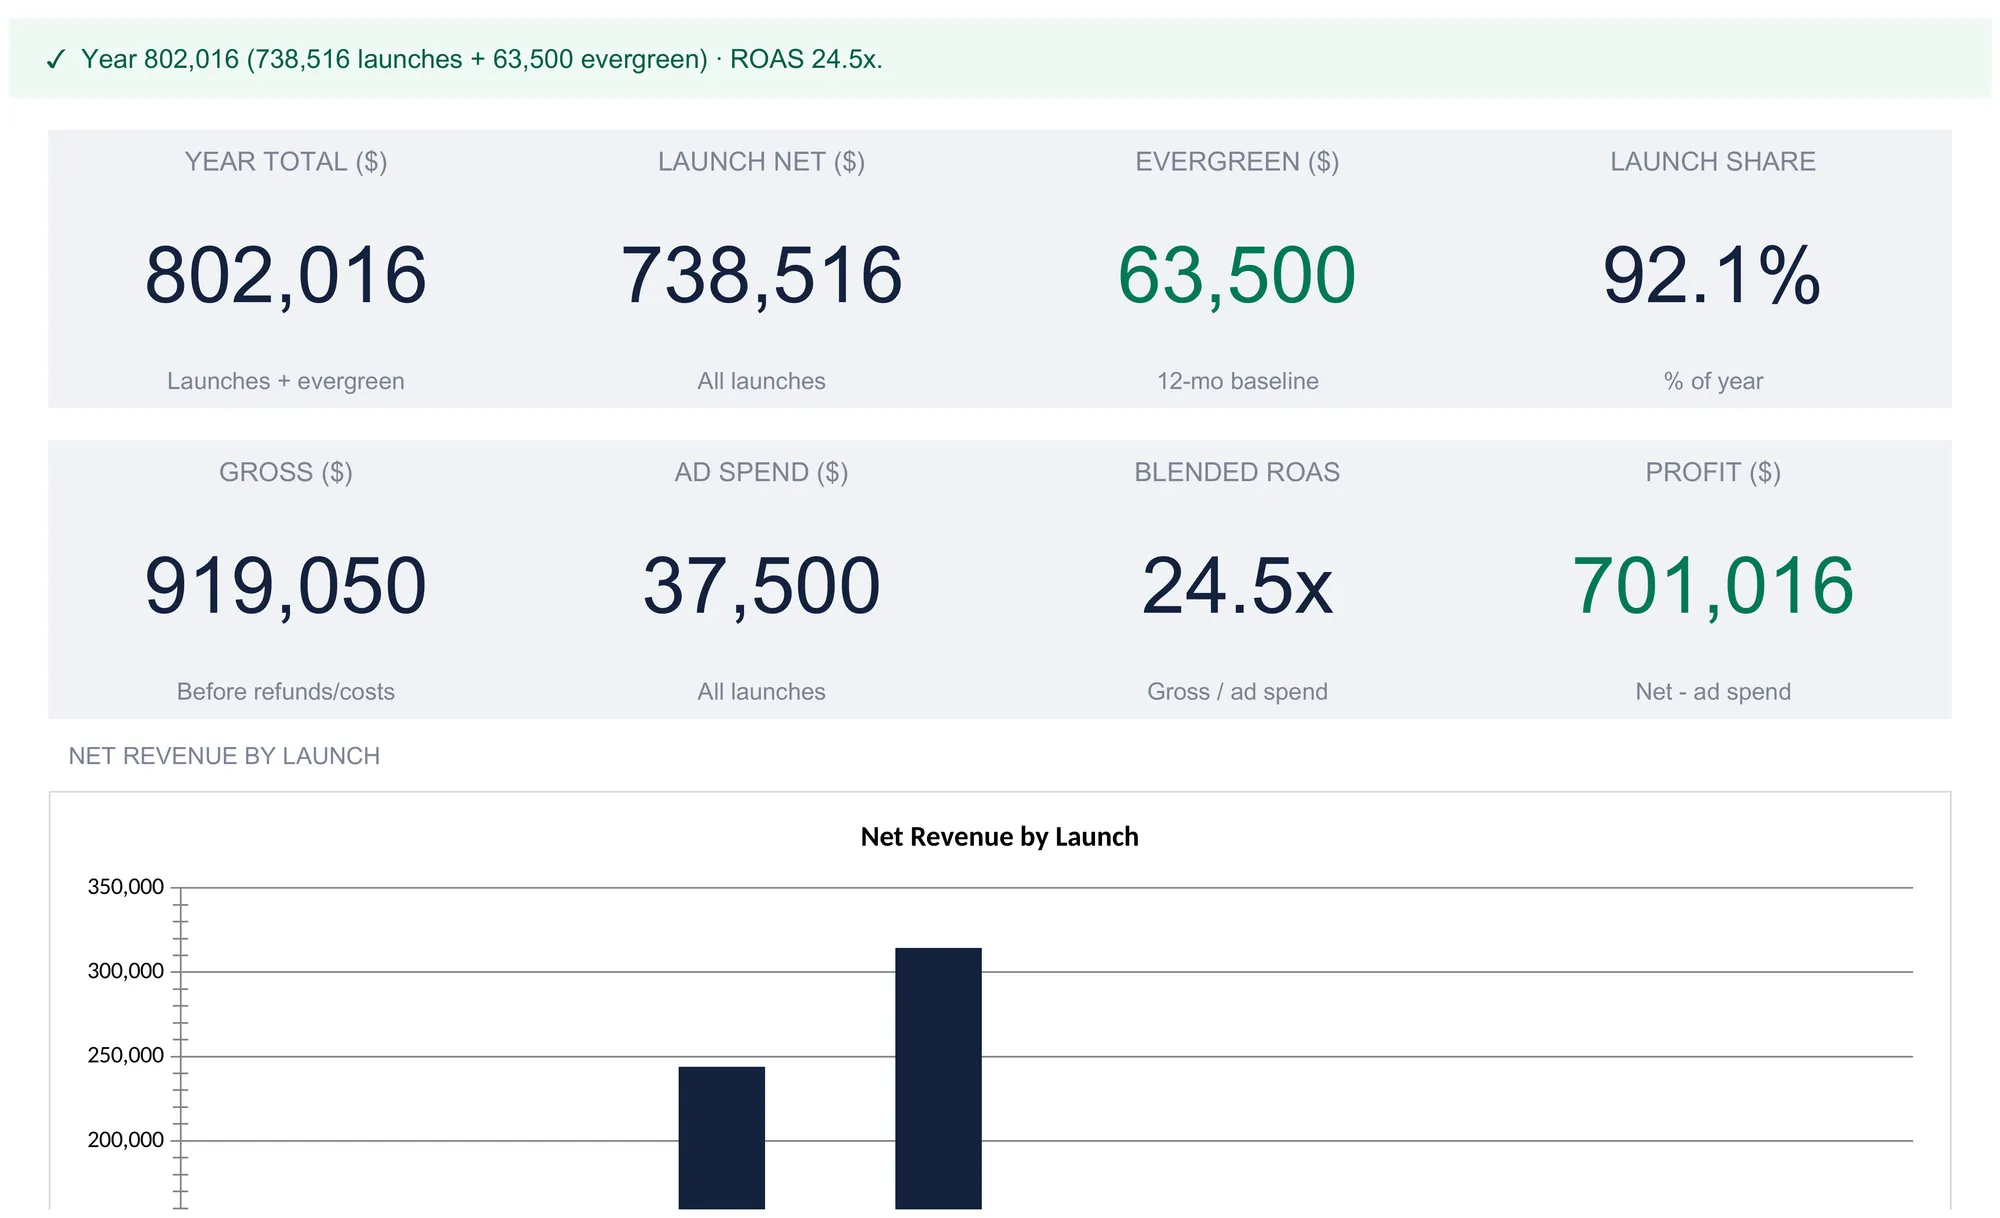
A status line above the tiles states the year in one sentence: a checkmark, the year total, the split between launches and evergreen, and the blended ROAS. It flips to a warning when a year’s launch ad spend climbs to or above its launch net revenue, so a launch calendar that has stopped paying for its own ads says so the moment the file opens. Below the tiles, a bar chart plots net revenue by launch, and a second chart plots evergreen against launch revenue month by month. The cropped screenshot above shows the tiles and the start of the net-revenue chart; the monthly evergreen-versus-launch chart sits further down the sheet.
The launch-share tile is the one that reframes the whole picture. At 92.1 percent, this sample business is overwhelmingly a launch business, with evergreen filling the remaining 8 percent. A different creator with a heavy automated funnel might see that split closer to even. Either way, the number is invisible on a checkout dashboard and obvious the moment launches and evergreen live in the same file.
The monthly chart lower on the dashboard is where the timing becomes visible. It reads each launch’s net revenue into the month the launch opened, taking that month from the date typed on the Launches sheet, and stacks it on top of the evergreen figure for the same month. In the sample that puts a launch spike in March, June, September, and November, the four months the sample launches went live, with the evergreen band climbing gently underneath from $3,500 to $7,100 across the year. The picture is a series of tall, irregular launch columns sitting on top of a low, rising evergreen floor. That is the shape of a launch-driven course business seen across twelve months rather than as a single annual figure. A creator can read the quiet months and the peak months straight off the chart, and see at a glance how much of any given month came from a launch versus the always-on funnel.
ROAS, refund rate, net profit, and evergreen in plain terms
Four terms carry most of the model’s meaning, and each is a plain calculation on numbers the sheets already hold.
Refund rate is the share of gross revenue that customers get back. At 8 percent, a launch grossing $100,000 hands back $8,000. It is applied to gross, so it scales with the size of the launch.
ROAS, return on ad spend, is gross revenue divided by ad spend. A 24.5x blended ROAS means every dollar of ads returned $24.50 of gross. It measures the ads, not the whole business, because it uses gross rather than net.
Net profit is what remains after both the launch’s own costs and its ad spend. On this dashboard that is the $701,016 profit tile: net revenue of $738,516 minus the $37,500 of ad spend. It is the number no single platform reports, because no platform knows both the refund rate and the ad bill.
Evergreen baseline is the steady, launch-independent revenue the business earns year-round, $63,500 here. It is the floor the year would land on with no launch at all, and comparing it to the launch total is how a creator reads how concentrated the year really is.
One launch from audience to profit: a worked example
It helps to follow a single launch through every sheet, because the same launch appears on four of them and each sheet adds one layer. The Black Friday launch is the clearest case, since it is the largest in the sample.
It starts on the Launches sheet as a name, a date, and three typed numbers: a 22,000 audience, a 4.5 percent conversion rate, and a $397 price. The sheet rounds 22,000 times 4.5 percent to 990 units, and 990 units times $397 gives $393,030 gross. That gross figure is the last number a checkout dashboard would show.
The Refunds & Costs sheet then itemizes what that launch owes. Refunds run 8 percent of gross, or $31,442. Percentage processing is 2.9 percent of gross, $11,398, and flat processing is 30 cents across 990 sales, $297. Delivery is $12 per student across 990 students, $11,880. Affiliate commissions are 20 percent of sales at a 30 percent rate, which is 6 percent of gross, $23,582. Those five costs total $78,599, and gross minus that total is the $314,431 net revenue the Launches sheet reported for this launch all along.
The Marketing sheet adds the last layer, the ad spend. This launch cost $11,000 to promote, so its ROAS is $393,030 divided by $11,000, or 35.7x, the strongest of the year. Subtracting the $11,000 from the $314,431 net revenue leaves $303,431 of profit for the Black Friday launch on its own. Run the same three sheets for the other three launches and the dashboard adds the evergreen baseline on top to reach the year: $802,016 total revenue and $701,016 profit. No step in that chain is estimated; each is the previous number with one more cost applied.
Where the data ends up at tax time
For a US creator operating as a sole proprietor, the categories on these sheets map onto tax reporting. Course income and its expenses generally land on Schedule C, which the IRS describes as the form for reporting profit or loss from a business operated as a sole proprietor. The refund, processing, delivery, affiliate, and advertising lines the workbook already totals are the same kinds of figures that reporting asks for, and a tax professional can confirm how a specific course business should file. Arriving at year-end with revenue and categorized costs already totaled turns filing prep into a copy job rather than a reconstruction from scattered payout emails.
Excel or Google Sheets for a course launch P&L
The template is an .xlsx file built on plain formulas, with no macros and no add-ons, so it runs identically in Microsoft Excel and in Google Sheets after upload. Google Sheets suits creators who plan launches collaboratively and want a shared link a co-founder or contractor can open; Excel suits those who prefer a local file on their own machine. The structure described here, from the cost constants through the blended-ROAS dashboard, is equally buildable in either, and the spreadsheet template downloads as one file that works in both.
Which template fits which creator
- Course Launch P&L Spreadsheet Template ($39) is the workbook this walkthrough follows: the cost constants, the per-launch math, the ad-spend and ROAS view, the itemized cost breakdown, the evergreen baseline, and the eight-metric dashboard, built for a course or digital-product business that runs several launches a year.
- Creator Revenue Tracker Spreadsheet Template ($29) sits one step earlier in the same family. Where the Course Launch P&L is built around discrete launches and their ad math, the Creator Revenue Tracker follows month-to-month creator income across platforms and sponsors, which fits a creator whose revenue is steady and diversified rather than launch-driven. Some creators keep both, one for the always-on income and one for the launch spikes.
Related
- How to Build a Profit and Loss Statement in a Spreadsheet - the general-purpose P&L structure this launch model is a specialized version of
- How to Calculate a Break-Even Point in a Spreadsheet - the break-even idea behind the Marketing sheet’s break-even ROAS, applied to a whole business
- How to Manage Freelance Finances in a Spreadsheet - the same sheet-based approach for a solo creator’s wider finances
Frequently asked questions
What does ROAS mean on this sheet, and what is break-even ROAS?
ROAS is return on ad spend, gross revenue divided by the money spent on ads for that launch. A launch that grossed $393,030 on $11,000 of ads posts a 35.7x ROAS. Break-even ROAS is the point where a launch's ad spend equals its net revenue after refunds, processing, delivery, and affiliate costs. In the sample year that break-even sits at 1.2x, because about 20 cents of every gross dollar is eaten by those costs before ad spend is even counted.
What is the difference between gross and net revenue for a course launch?
Gross is units times price, the headline number a checkout dashboard shows. Net revenue is what survives after the launch's own costs: refunds, payment processing, per-sale delivery, and affiliate commissions. In the sample, a launch that grossed $149,100 kept $120,212 as net revenue, before any ad spend. Net revenue is the figure the ad spend is then subtracted from to reach profit.
Does the spreadsheet connect to Stripe, Teachable, or Kajabi?
No. It has no integration and no import; each launch is a handful of typed cells, namely a launch name and date, audience size, conversion rate, price, and ad spend, and every gross, cost, and profit figure is a formula. That keeps the file readable and offline, and it means the numbers come from your own checkout reports rather than a live feed. Creators who want automatic syncing use their platform's built-in analytics; the spreadsheet suits those who want to model and read every line themselves.
How many launches can one file track?
The Launches sheet ships with four sample launches and four spare rows already wired into every total, cost breakdown, and chart, so a single file covers up to eight launches in a year. Filling a spare row adds it everywhere automatically. A creator running more than eight launches in one year would extend the formulas down or start a second file for the next year.
Can it separate evergreen sales from launch spikes?
Yes. The Evergreen sheet holds twelve months of always-on revenue from the post-launch funnel, such as sales-page orders and cohort waitlists, on its own line. The dashboard reports evergreen as a separate tile and a 12-month baseline, shows launch share as a percentage of the year, and plots evergreen against launch revenue month by month, so a steady baseline and a spiky launch calendar never blur together.
Sources
- About Schedule C (Form 1040), Profit or Loss from Business - Internal Revenue Service
About this article
Sheets, inputs, formulas, and every worked figure checked on 2026-09-10 against the shipped Course Launch P&L workbook (Dashboard, Launches, Marketing, Refunds & Costs, Evergreen, Settings, How to Use tabs). The Schedule C reference was checked against the live IRS page at writing time. Last reviewed September 2026.