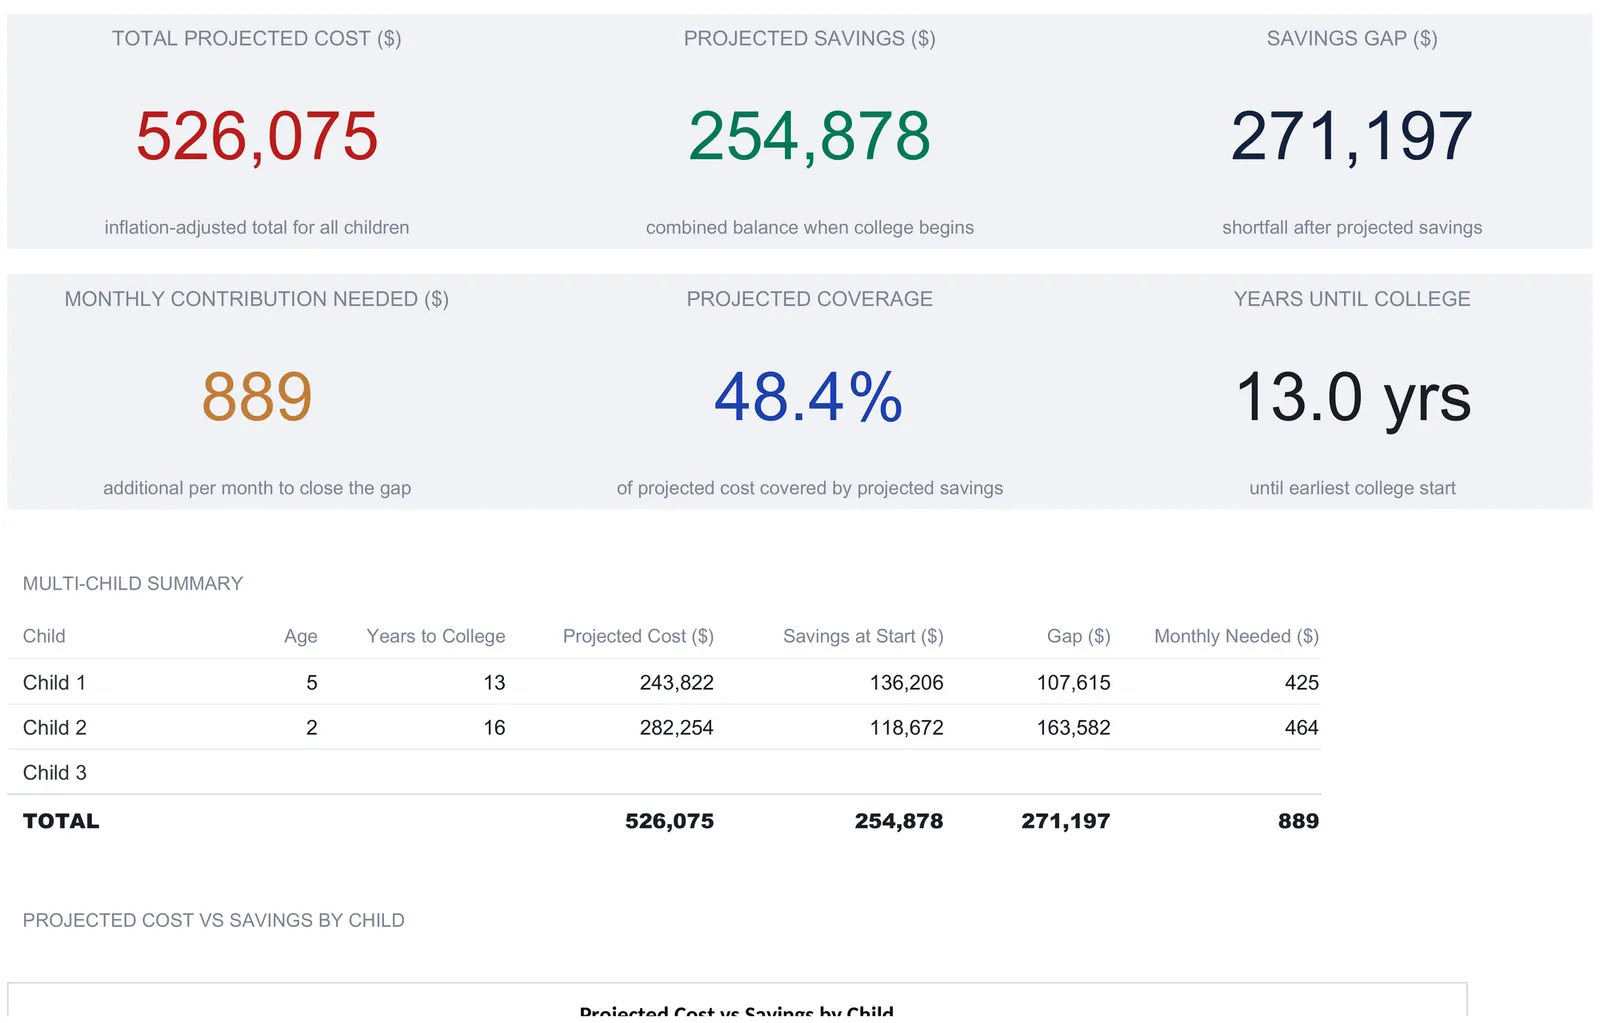
A college savings spreadsheet turns a single what-if number into a plan: it takes up to three children, projects each account year by year with a mid-year growth model, inflates future tuition on its own schedule, and reads the two sides back as a funding gap. This walkthrough follows the full structure with a worked example, a five-year-old with $15,000 saved at $400 a month and a two-year-old with $5,000 at $300, whose two 529 accounts are projected to hold $254,878 against $526,075 of inflated college cost. Our College Savings Calculator Ultimate Spreadsheet Template ($29) ships the same structure ready-made for Excel and Google Sheets.
Saving for college is a race between two curves that most people only ever see one of. On one side, an account grows: a starting balance, a monthly contribution, and years of compounding. On the other, the bill grows too, because a year of tuition costs more when a toddler turns eighteen than it does today. A single what-if calculator shows you the first curve and asks you to trust that the target on the other side is right. A spreadsheet built for the job draws both curves, ages the cost forward on its own schedule, and reports the distance between them as one number: the funding gap.
That gap is the whole point, and the workbook below builds up to it across six sheets that hand off in order: a Setup sheet where each child and the cost assumptions are entered, a Savings Projection that grows each account year by year, a Cost Projection that inflates future tuition, a 529 vs Taxable sheet that prices the tax treatment, a Contribution Planner that stress-tests the plan across rates and contributions, and a Dashboard that reads everything back. The examples come from our College Savings Calculator Ultimate Spreadsheet Template ($29), which ships the whole thing ready-made for Excel and Google Sheets. Everything it does is reproducible by hand if you would rather build your own college savings spreadsheet from scratch.
What a college savings spreadsheet has to hold, and what a single calculator leaves out
The general college savings calculator guide walks through the idea of the projection well, and for one child at one set of assumptions a single-box tool answers the question. A larger plan asks harder questions, and this workbook is built to answer them. It carries four things a one-box calculator does not.
- More than one child, each on its own timeline. A two-year-old and a five-year-old reach college in different years and face different inflated prices, so each gets its own savings projection and its own cost schedule rather than sharing one average.
- The cost curve as its own model. Future tuition is not a single target number typed in by hand. It is computed from a cost-today figure and an inflation rate, aged forward by the exact number of years until each child enrolls, so the target moves when the assumption does.
- The tax treatment in dollars. A dedicated 529 vs Taxable sheet grows the same balance three ways and applies each account’s tax rules, turning the abstract advantage of a 529 into a specific figure on the same contributions.
- A sensitivity grid, not a point estimate. A Contribution Planner lays out the projected balance across six return rates and ten monthly-contribution levels at once, so the plan is a range you can read rather than a single fragile number.
The walkthrough below follows the six sheets in the order the work happens, starting with the Setup sheet that feeds all of them and a How to Use sheet that carries the instructions.
Enter the plan once: the Setup sheet
The Setup sheet is where everything is described once, and every other sheet reads back from it. It is organized in three blocks: up to three children, a set of college cost assumptions, and two tax rates.
Each child slot holds six inputs: a name, the child’s current age, the age college begins, current savings, a monthly contribution, and an expected annual return. The sample carries two children. Child 1 is age 5 with $15,000 already saved, $400 a month going in, and a 7 percent expected return. Child 2 is age 2 with $5,000 saved and $300 a month at the same 7 percent. Both start college at age 18. The third slot has no name and no age entered, and that empty age is doing real work: leaving a child’s Current Age blank drops that slot out of every projection and every total, so the file always sizes itself to the family actually entered. The slot’s College Start Age of 18 and 7 percent return stay on the sheet, unused until an age goes in.
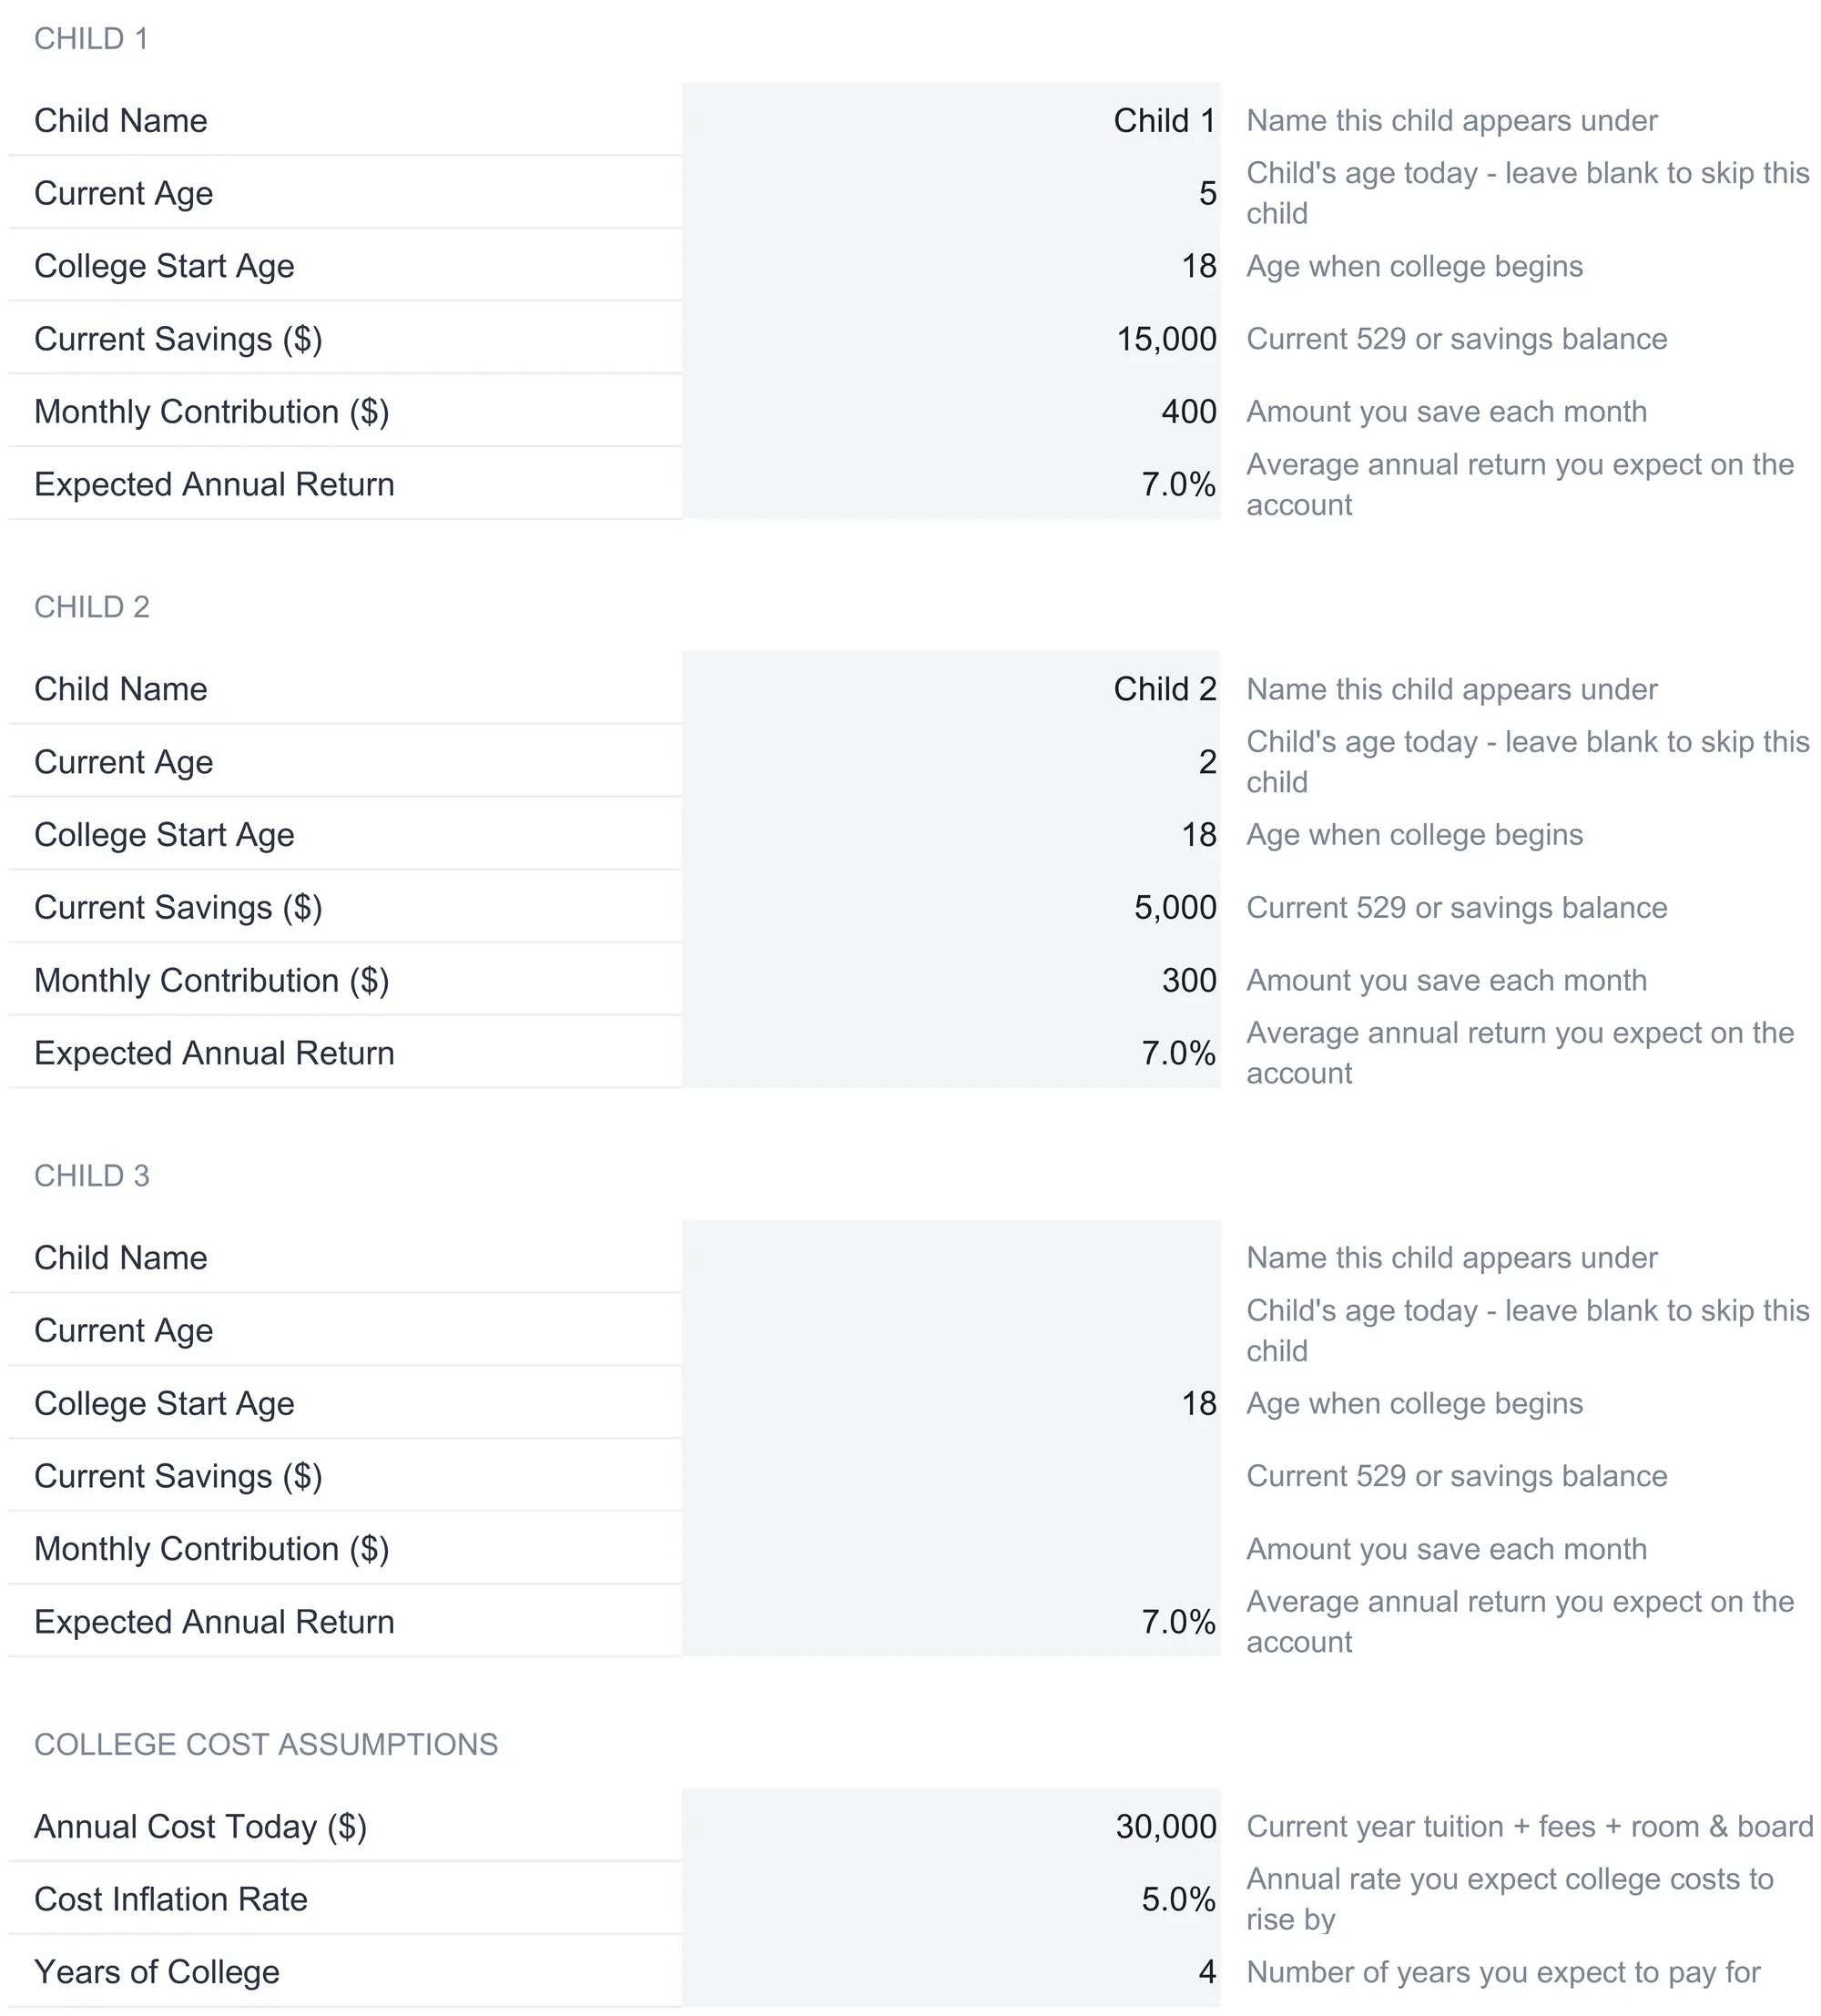
Below the children sit the college cost assumptions that all of them share. Annual Cost Today is $30,000 in the sample, described on the sheet as the current-year total of tuition, fees, and room and board. The Cost Inflation Rate is 5 percent, the annual pace those costs are assumed to rise at. Years of College is 4, the number of years the plan pays for, with the sheet noting 4 for a bachelor’s degree and 2 for an associate’s, and up to 8 years billable. Two tax rates finish the sheet: a 15 percent capital gains rate and a 22 percent income tax rate, both used only by the 529 vs Taxable comparison further on.
These are the tinted input cells, and the How to Use sheet describes the tinted cells as the ones you fill in and the white cells as formulas. The projection sheets are formula-driven and read from this one sheet, which is why the whole model re-figures the moment a single assumption changes. The only other tinted cells in the file are the currency selector on the Dashboard and the rate and contribution headings on the Contribution Planner. Set the cost-today figure to a specific school’s number, or the return to a rate you find more realistic, and every projection, comparison, and gap updates at once.
Grow each account: the Savings Projection sheet
The Savings Projection sheet takes each child’s inputs and grows the account one year at a time, from today to the year college begins. Each child gets a block of its own, headed with the child’s name and the age span it covers, so Child 1’s table reads “AGE 5 TO 18” and runs thirteen rows.
Six columns tell the story left to right: the year number, the child’s age that year, the starting balance, the annual contribution, the growth earned, and the ending balance that becomes next year’s start. The annual contribution is simply the monthly figure times twelve, so Child 1’s $400 a month reads $4,800 a year down the column. The growth column is where the one modeling choice worth understanding lives. Rather than assume a full year of return on money that trickles in month by month, the sheet uses a mid-year contribution model. Growth equals the starting balance plus half that year’s contribution, times the expected return. Adding only half the year’s deposits reflects that a January dollar compounds longer than a December one, and it keeps the projection from overstating growth on money that was not there for the full year.
| Year | Age | Starting balance | Annual contribution | Growth | Ending balance |
|---|---|---|---|---|---|
| 1 | 6 | $15,000 | $4,800 | $1,218 | $21,018 |
| 2 | 7 | $21,018 | $4,800 | $1,639 | $27,457 |
| 5 | 10 | $41,720 | $4,800 | $3,088 | $49,608 |
| 10 | 15 | $87,084 | $4,800 | $6,264 | $98,147 |
| 13 | 18 | $122,653 | $4,800 | $8,754 | $136,206 |
Follow Child 1’s block to the end and the account reaches $136,206 the year college starts. Two totals underneath make the composition plain: $62,400 in contributions over the thirteen years and $58,806 in growth, which added to the $15,000 opening balance rebuild the $136,206 exactly. Growth nearly matches contributions here, which is compounding doing close to half the work over a thirteen-year horizon. Child 2, with a longer sixteen-year runway but a smaller $300 monthly contribution, lands at $118,672 by its own age 18.
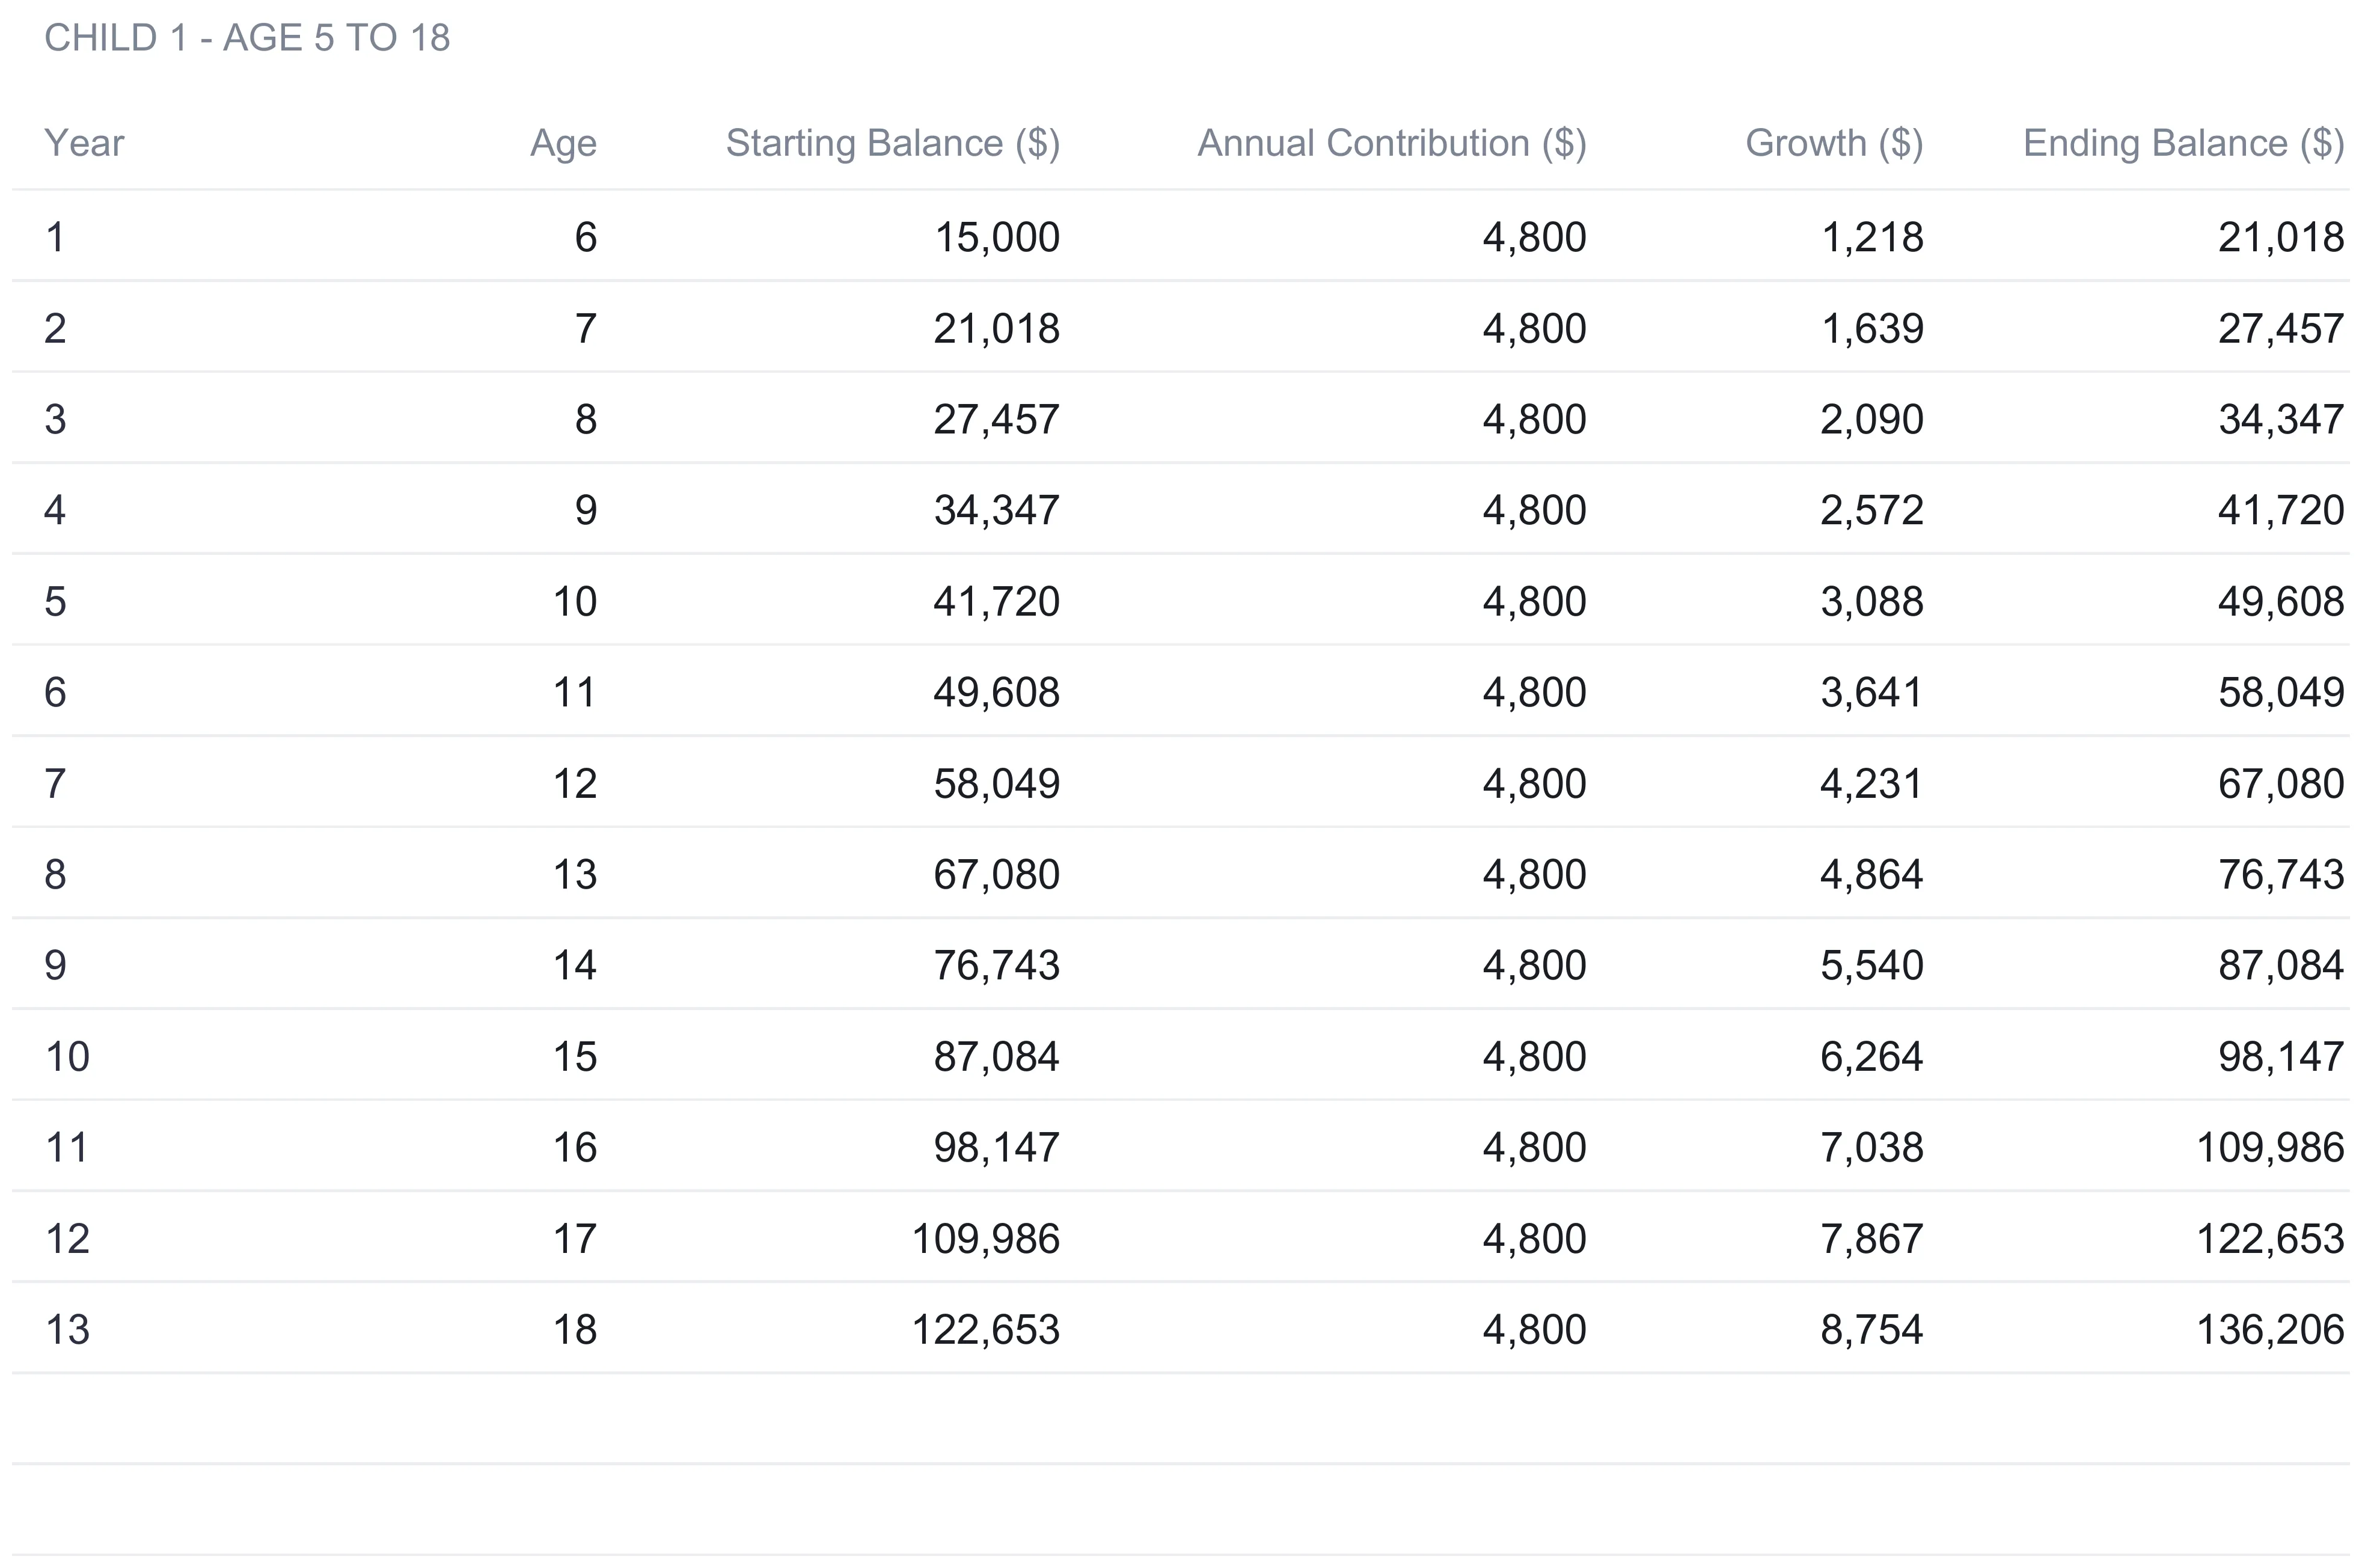
The sheet is sized for horizons up to twenty-two years, and any rows past a child’s college-start age stay blank, so each block ends exactly where that child’s runway does. The TOTAL row does not re-add the column; an INDEX reads the ending balance at the college-start year directly, and both the Dashboard and the Cost Projection point at that one cell. The 529 vs Taxable sheet and the Contribution Planner run the same growth model as a closed-form formula instead, which is why they land on the same $136,206 rather than a figure of their own.
Age the bill forward: the Cost Projection sheet
The Savings Projection draws the account curve. The Cost Projection draws the other one. It takes the $30,000 cost-today figure and inflates it forward to the years each child will actually be in college, one row per year of college.
The mechanics are a compounding factor. For each college year the sheet counts the years from now, raises 1.05 to that power, and multiplies the cost-today figure by the result. Child 1 enrolls thirteen years out, so the first college year carries an inflation factor of 1.89 and a projected annual cost of $56,569, already well above today’s $30,000. The next three years push further out and cost more: $59,398, then $62,368, then $65,486, for a four-year total projected cost of $243,822. That is what a $30,000 sticker price becomes for a five-year-old, thirteen to sixteen years from now, at 5 percent inflation.
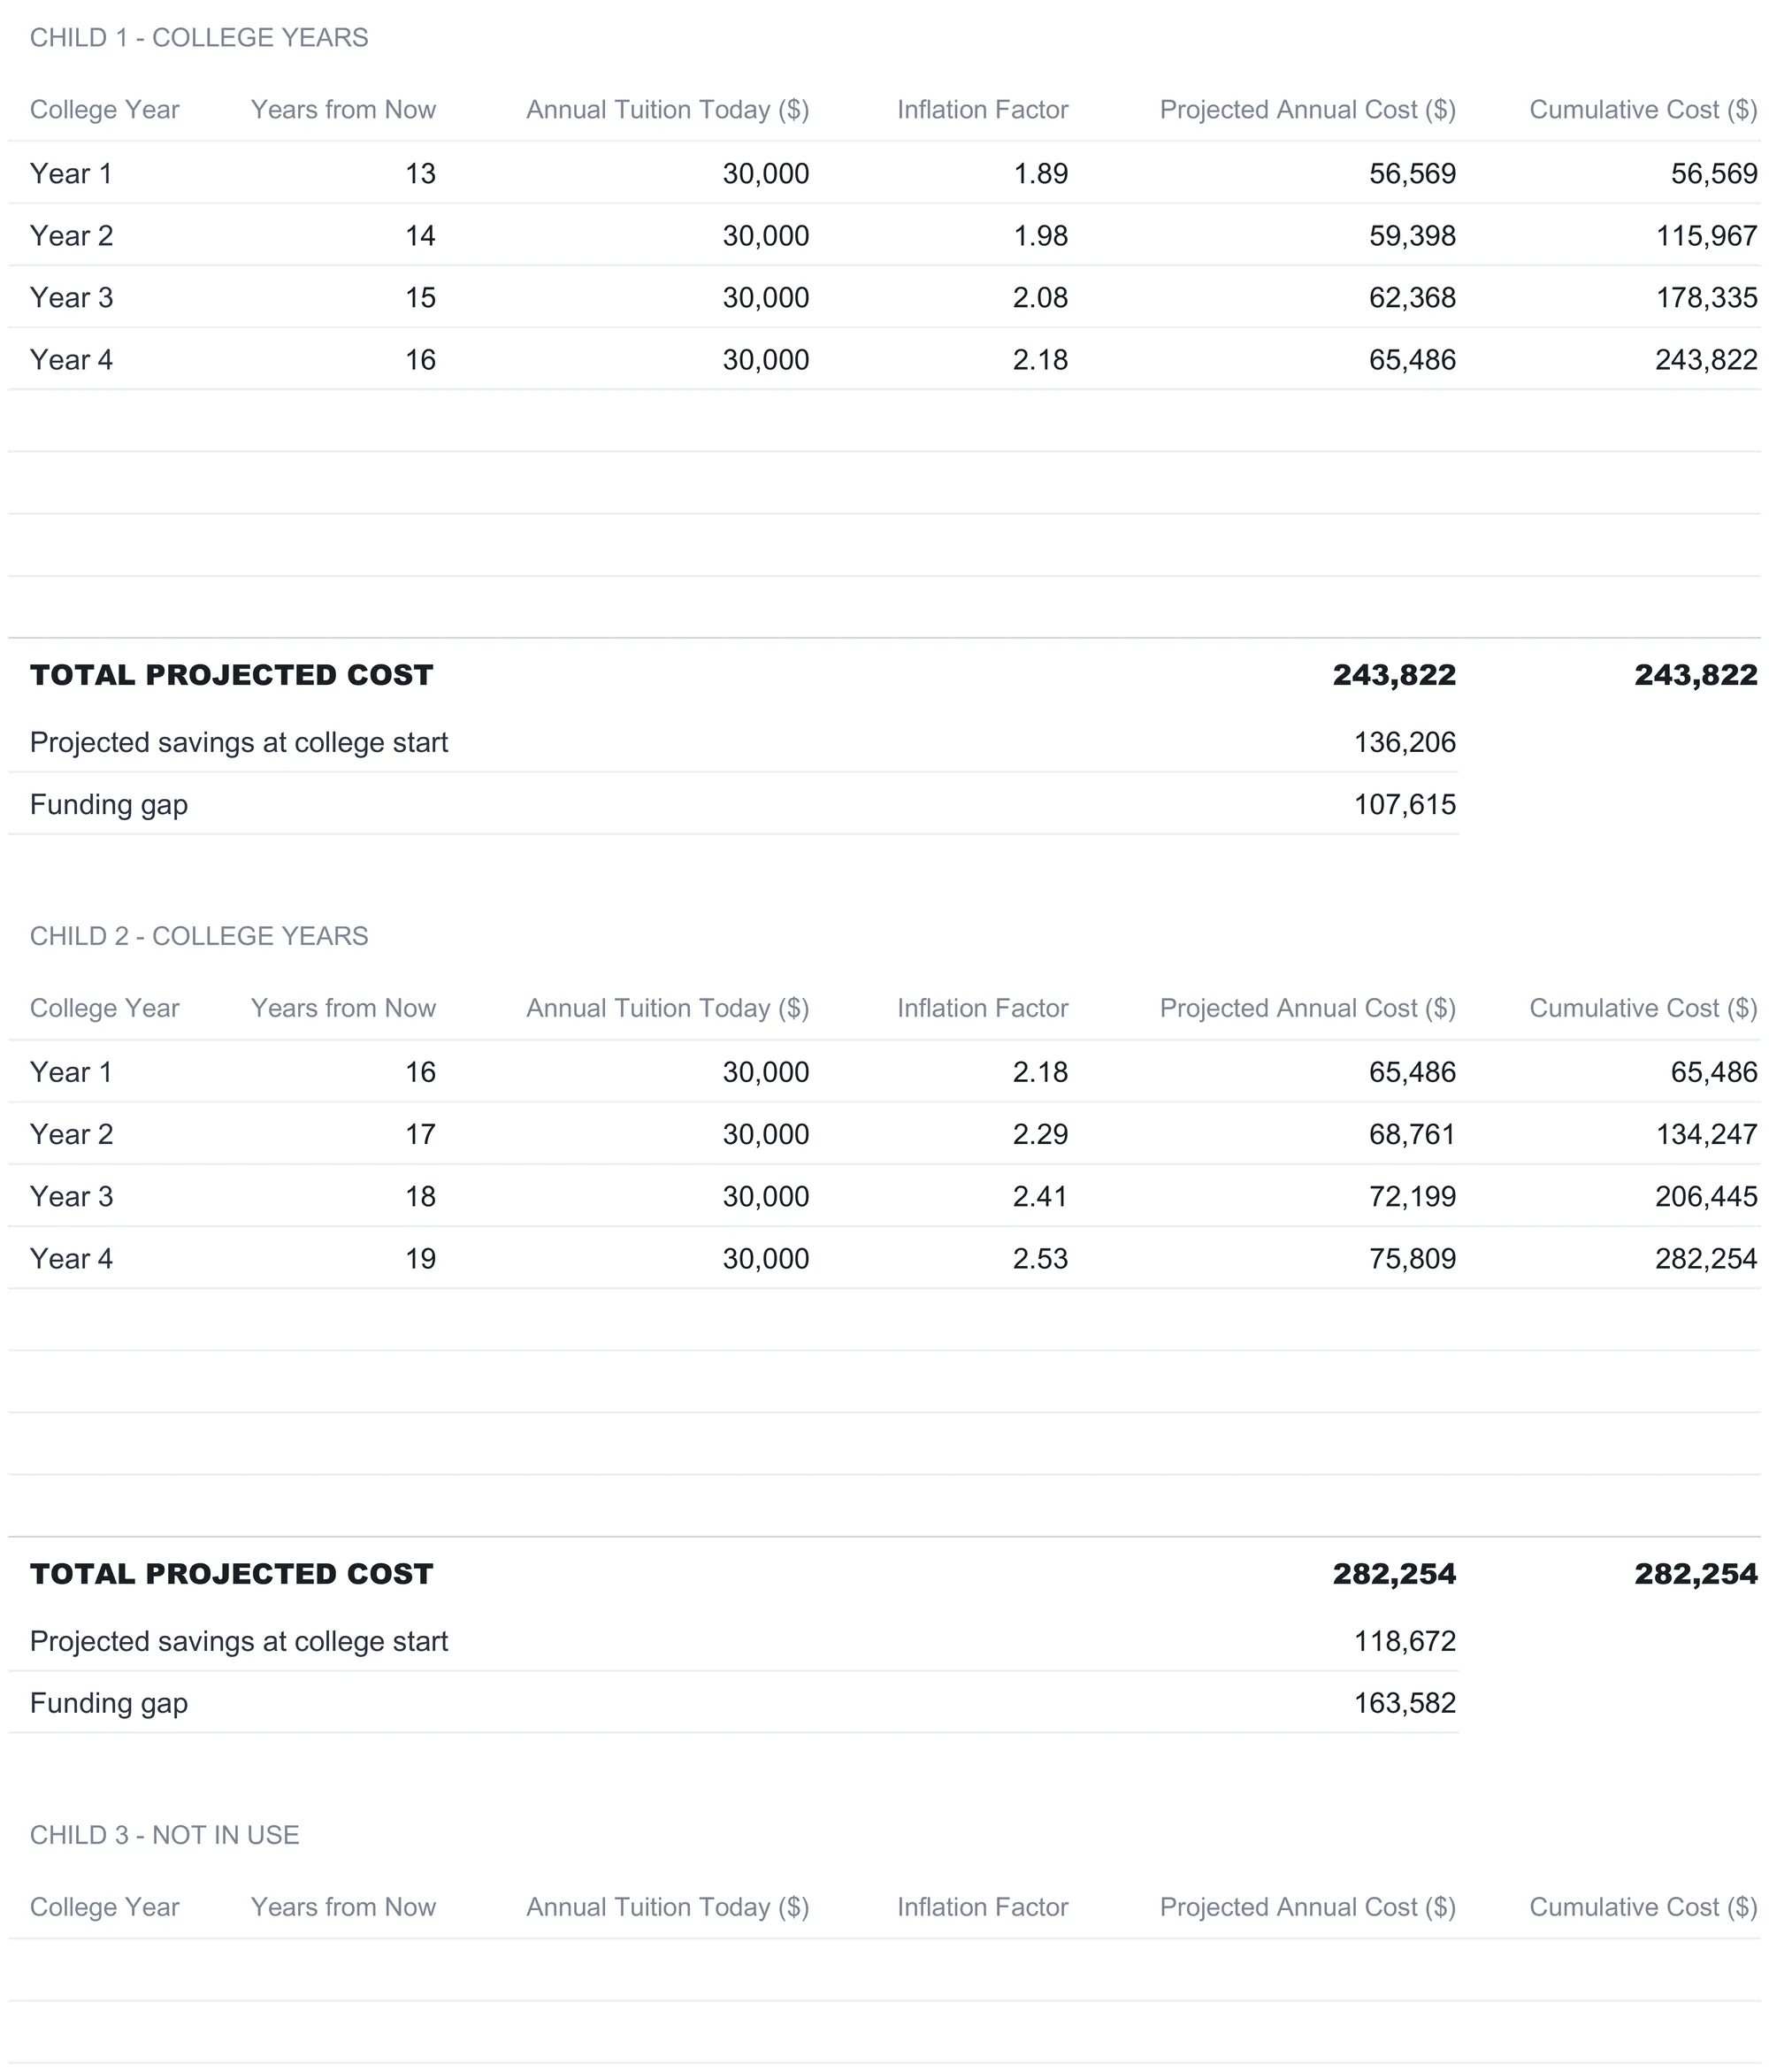
Directly beneath each child’s cost total, the sheet does the subtraction that the whole file exists for. It pulls the projected savings at college start from the Savings Projection sheet, $136,206 for Child 1, and subtracts it from the $243,822 cost to show a funding gap of $107,615. The label itself is a formula, reading “Funding gap” when costs outrun savings and “Funding surplus” when they do not. Child 2’s longer horizon cuts both ways: more years of compounding but also more years of inflation, so its cost climbs to $282,254 against $118,672 saved, a wider $163,582 gap. Seeing the two children side by side is the first sign that the younger child, despite more time, is the tighter of the two plans at these contributions.
Price the tax treatment: the 529 vs Taxable sheet
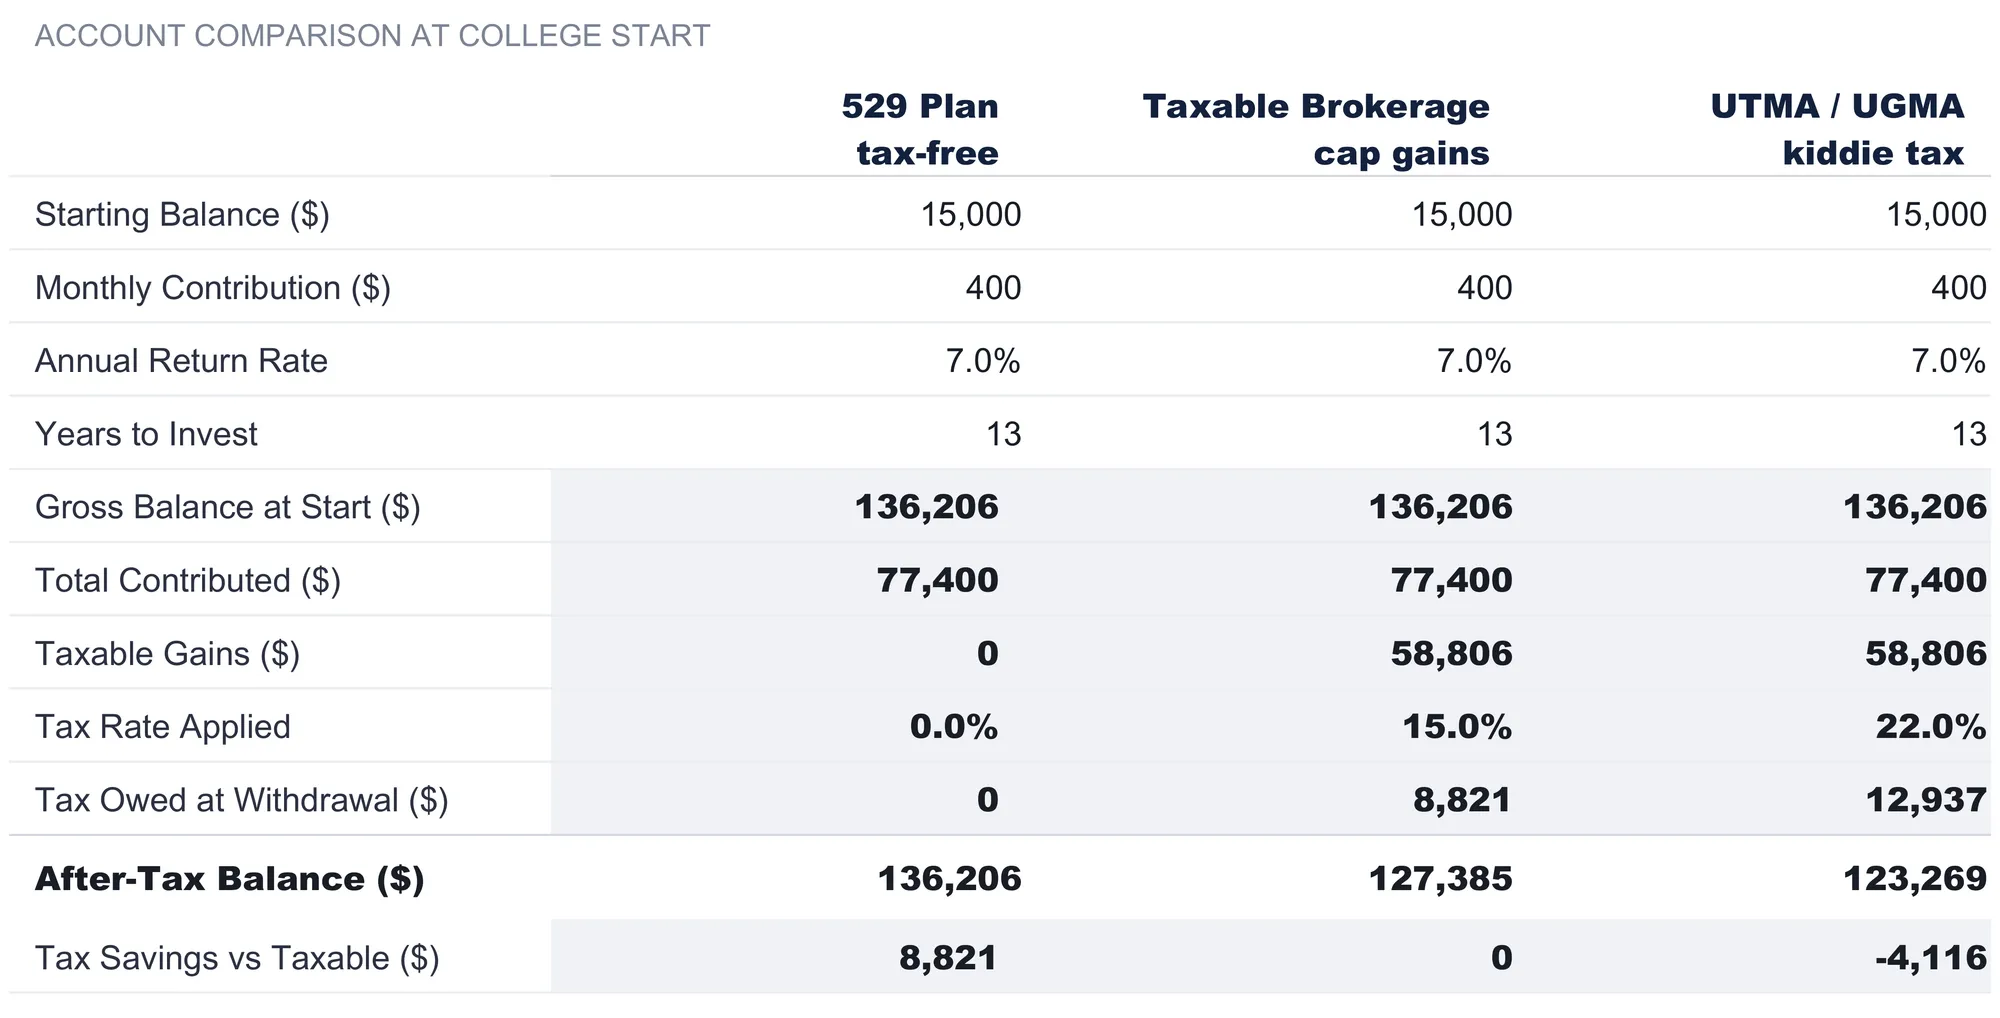
Where the account is held changes what survives to pay the bill, and the 529 vs Taxable sheet turns that into dollars. It grows Child 1’s exact inputs three ways in parallel columns, a 529 Plan, a taxable brokerage, and a UTMA/UGMA custodial account, so the balances are identical and only the tax handling differs.
All three reach the same $136,206 gross balance at college start on $77,400 of total contributions, leaving $58,806 in gains. From there the columns diverge. The 529 applies a zero percent rate, because qualified education withdrawals from a 529 are federally tax-free, a point the IRS 529 questions-and-answers page confirms. The taxable brokerage applies the 15 percent capital-gains rate from Setup to its gains, owing $8,821. The UTMA/UGMA column applies the 22 percent income-tax rate as a stand-in for kiddie-tax treatment, owing $12,937.
| Account | 529 Plan | Taxable brokerage | UTMA / UGMA |
|---|---|---|---|
| Gross balance at start | $136,206 | $136,206 | $136,206 |
| Taxable gains | $0 | $58,806 | $58,806 |
| Tax rate applied | 0% | 15% | 22% |
| Tax owed at withdrawal | $0 | $8,821 | $12,937 |
| After-tax balance | $136,206 | $127,385 | $123,269 |
| Tax savings vs taxable | +$8,821 | $0 | -$4,116 |
The bottom row reads each account against the taxable brokerage as a baseline. The 529 comes out $8,821 ahead on the same contributions and the same growth, purely because none of the gain is taxed on the way out. The UTMA sits $4,116 behind the taxable account, because the income rate applied to it exceeds the capital-gains rate. The sheet’s notes add the context the arithmetic cannot: 529 contributions may be deductible on state income taxes in many states, non-qualified 529 withdrawals incur income tax plus a 10 percent penalty on the earnings, and UTMA/UGMA gains fall under kiddie-tax rules until the child is somewhere between 19 and 24. Those rules are the reason the comparison is a starting point for a conversation with a tax professional rather than a verdict, and the tax rates are editable precisely so the sheet can match a real situation.
Stress-test the plan: the Contribution Planner sheet
A projection built on one contribution and one return is fragile, because both assumptions are guesses. The Contribution Planner replaces the single answer with a grid, so the plan becomes a range you can read at a glance. It is built for Child 1, headed “PROJECTED BALANCE AT AGE 18 (Child 1, 13 years)”, with expected return down the side from 4 to 9 percent and monthly contribution across the top from $100 to $1,000.
Reading the grid locates the plan. The current $400-a-month-at-7-percent cell reads $136,206, the same figure the projection produced, which is the sheet checking its own work. From there the sensitivities are easy to see. Hold the rate at 7 percent and step the contribution up to $1,000 a month, and the balance climbs to $286,294, more than double the current plan. Move the return a point or two at the same contribution and the same cell shifts far less. Over this horizon the contribution moves the outcome more than the rate does.
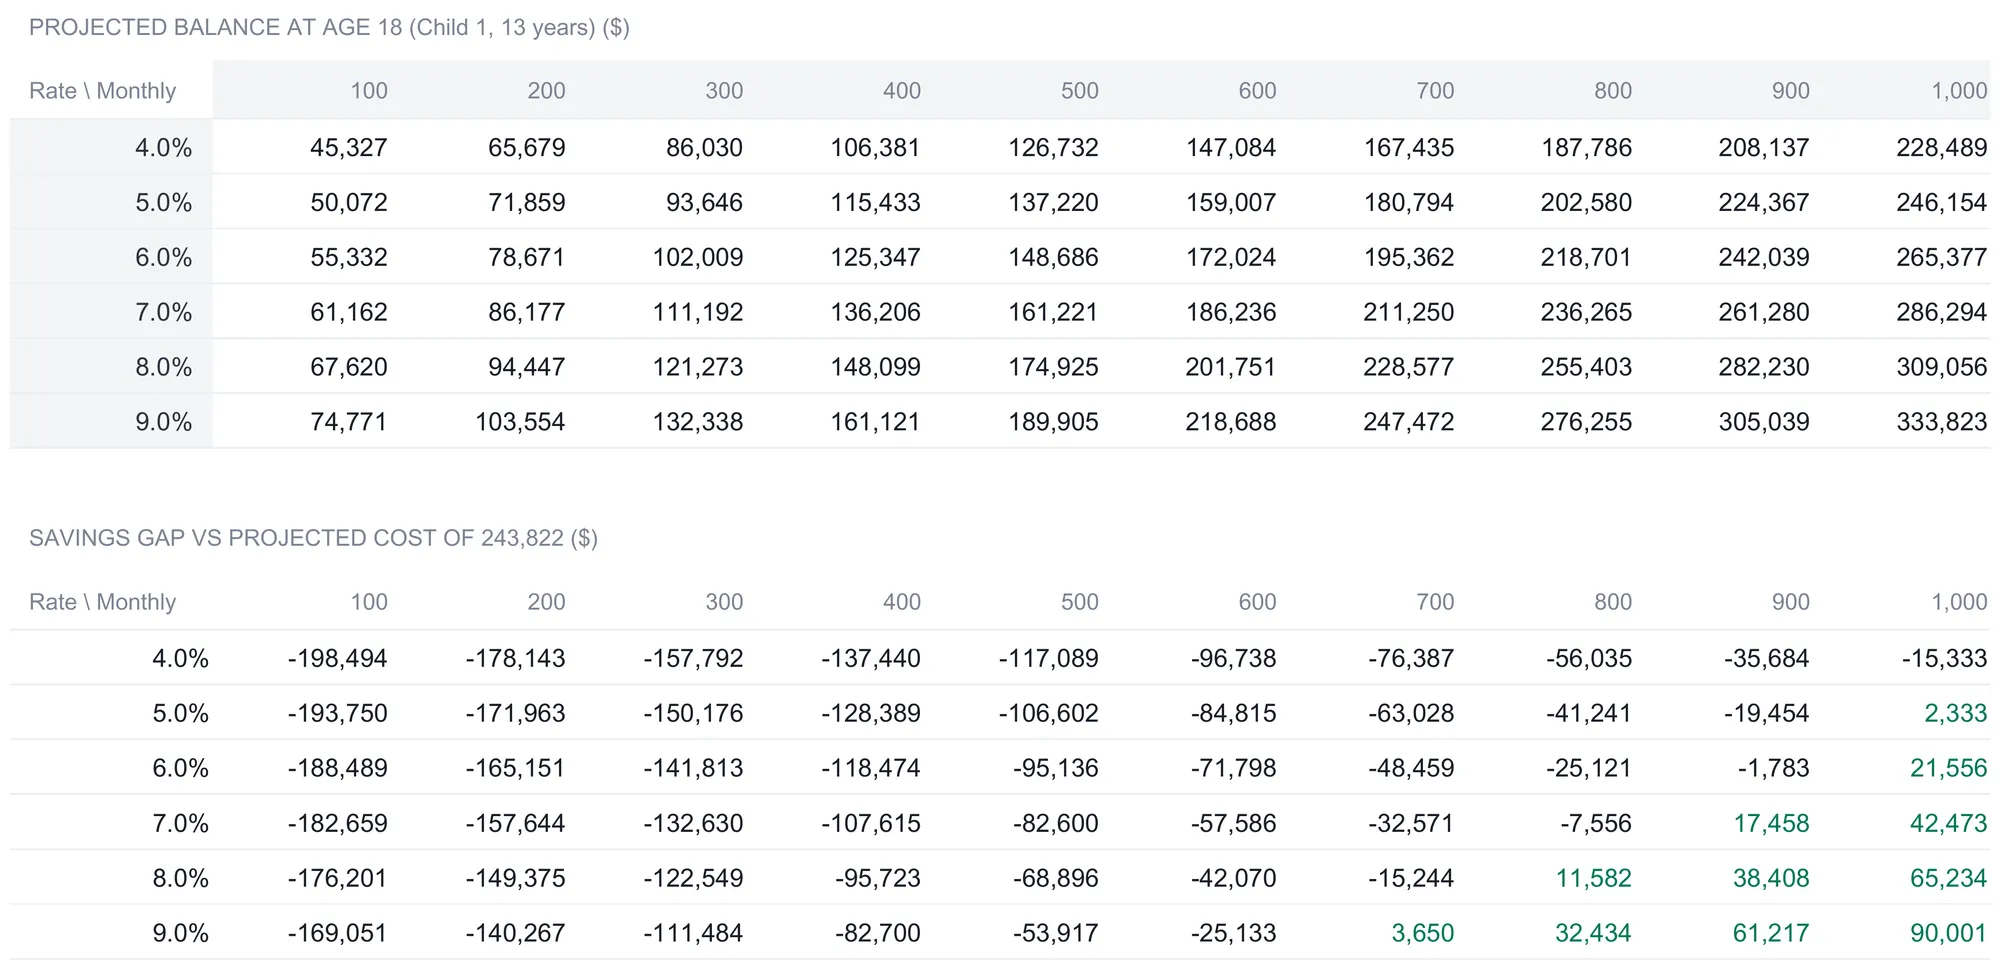
A second grid below it does the more useful thing. Instead of the raw balance it shows the gap against Child 1’s projected cost of $243,822, so a negative cell is a shortfall and a positive one is on track. At 7 percent, the current $400 a month leaves a $107,615 shortfall, and running along that row the first cell that turns positive is $900 a month, at a $17,458 surplus. That is the planner answering the practical question directly: at this return and this cost, the contribution that fully funds Child 1’s four years sits around $900 a month rather than the $400 in place today. The tinted rate and contribution headings are themselves input cells, so the whole grid can be re-centered on the range you actually care about.
Read it all back: the Dashboard
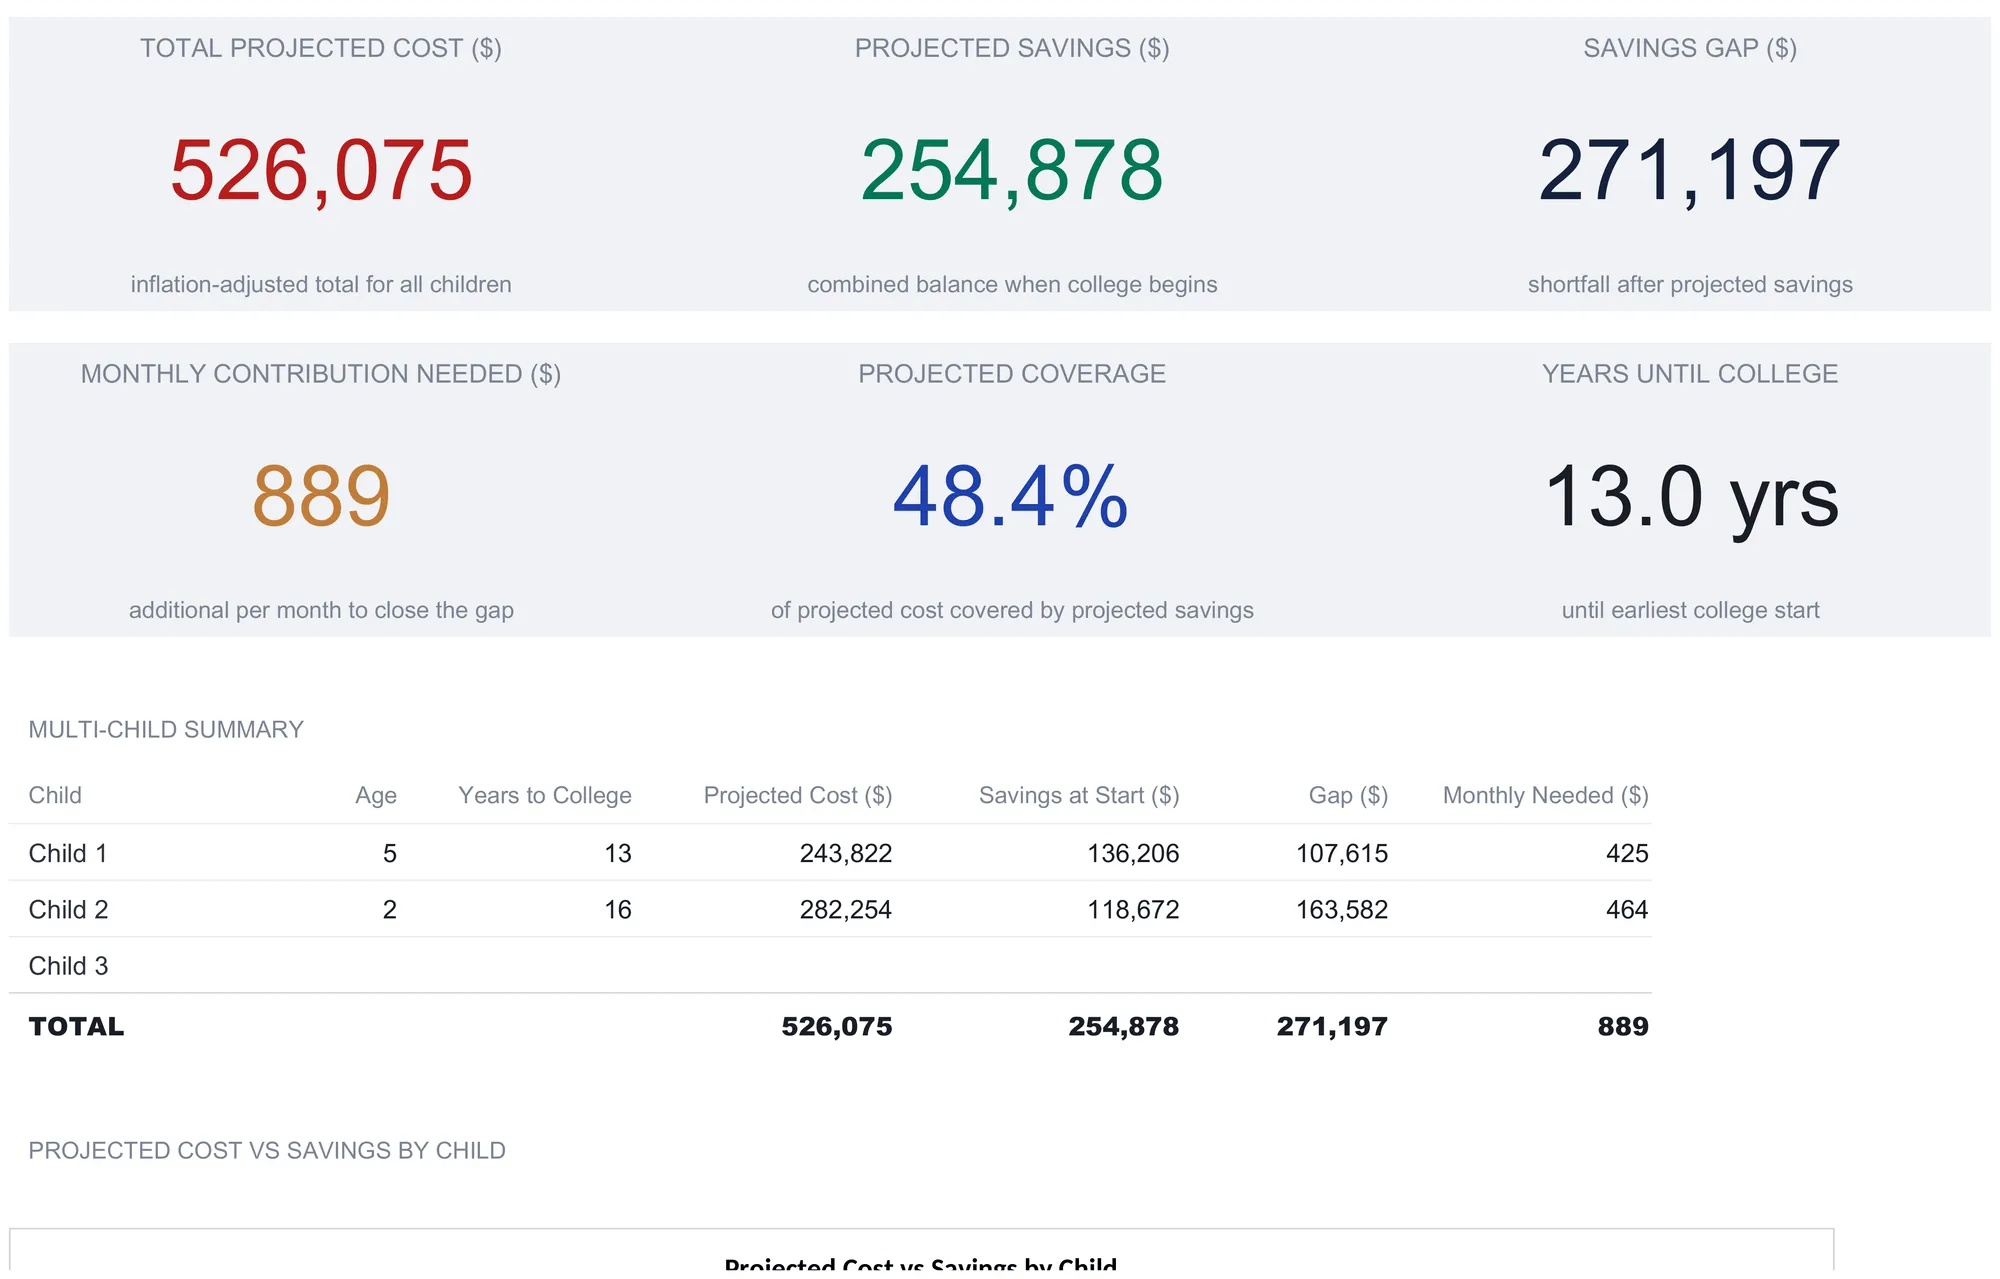
With the children entered and every sheet computed, the Dashboard reads the plan back as six KPI tiles across the top.
| Tile | Sample value | What it reads |
|---|---|---|
| Total projected cost | $526,075 | Inflation-adjusted college cost across all children |
| Projected savings | $254,878 | Combined balance when college begins |
| Savings gap | $271,197 | Shortfall after projected savings |
| Monthly contribution needed | $889 | Additional per month to close the gap |
| Projected coverage | 48.4% | Share of projected cost covered by projected savings |
| Years until college | 13.0 | Until the earliest college start |
Two of these repay a second look. Projected Coverage divides the $254,878 of projected savings by the $526,075 of projected cost to read 48.4 percent, and the workbook is careful to note this is savings at college start over cost, not what is in the accounts today. It is a measure of where the plan lands, not where it stands. Monthly Contribution Needed, $889, is the additional monthly amount required to close the combined gap, computed for each child with a future-value annuity at that child’s expected return and then summed. It reads as the single lever the plan turns on, the number to move if the coverage figure is lower than intended.
Below the tiles, a multi-child summary table breaks the totals back apart, one row per child. Child 1 shows a $243,822 cost, $136,206 in savings, a $107,615 gap, and $425 a month needed; Child 2 shows $282,254, $118,672, $163,582, and $464. The TOTAL row rebuilds the $526,075 cost, the $254,878 savings, the $271,197 gap, and the $889 monthly figure exactly, so the KPI tiles and the per-child rows always reconcile. Two charts finish the sheet, one plotting projected cost against savings for each child and one drawing the funding gap by child, turning the same numbers into the shape of the plan.
The funding gap, coverage, and the two curves in plain terms
College planning gets confusing because two moving numbers are easy to mistake for one. Keeping them separate is what the whole file is for.
Projected cost is the bill, aged forward. It is not today’s $30,000 sticker price but what four years will cost in the years a specific child attends, after inflation compounds on it. For Child 1 that is $243,822, well above four times the current figure.
Projected savings is the account, grown forward. It is the starting balance plus every contribution plus the compounding on both, read at the year college begins. For Child 1 that is $136,206.
The funding gap is simply the first minus the second, $107,615 for Child 1 and $271,197 across both children. Coverage expresses the same relationship as a percentage, the 48.4 percent of projected cost the projected savings would meet. A gap is normal, especially early, and the value of seeing it in dollars is that the response is concrete: the Contribution Planner shows exactly which monthly contribution would close it. What the file deliberately does not do is decide anything for you. It projects the two curves and reports the distance, and every rate and cost that shapes them is a cell you control.
Excel or Google Sheets for college savings
The template is an .xlsx file built on standard formulas, with no macros and no add-ons, so it behaves the same in Microsoft Excel and in Google Sheets after upload. The How to Use sheet notes it works in LibreOffice Calc as well. Google Sheets suits two parents who want to open the same live plan from different places; Excel suits one who prefers a local file. The structure described here, a Setup sheet feeding a savings projection and a cost projection that meet at a gap, is equally buildable in either, and nothing in this walkthrough depends on a feature only one of them has. A currency selector on the Dashboard relabels every money header and KPI across the workbook, changing the symbol shown without converting the underlying numbers, so a plan reads naturally whether it is denominated in dollars, pounds, or rupees.
Which template fits the job
- College Savings Calculator Ultimate Spreadsheet Template ($29) is the workbook this walkthrough follows: the three-child Setup sheet, the year-by-year savings projection, the tuition-inflation cost projection, the 529-versus-taxable comparison, the return-and-contribution sensitivity grid, and the six-KPI dashboard. The tier family starts smaller, with a free College Savings Calculator for a single-sheet estimate and a College Savings Calculator Essentials ($19) that wraps a dashboard around a single projection. The Ultimate version is the one that carries multiple children, the separate cost model, the account-comparison sheet, and the sensitivity grid.
- Retirement Calculator Ultimate Spreadsheet Template ($29) is the natural companion, because college and retirement are the two long-horizon goals that compete for the same monthly dollars. It runs the same kind of growth-projection-and-scenario arithmetic on a retirement balance, with an accumulation phase, a withdrawal phase, and its own sensitivity analysis, so a household can see both plans in the same shape and weigh them against each other rather than in isolation.
Related
- College Savings Calculator: Planning for Education Costs - the general guide to college cost inflation, 529 basics, and the monthly-savings idea this template puts into a full workbook
- How to Project Retirement Savings in a Spreadsheet - the other long-horizon goal, built with the same growth-projection and scenario tools
- How to Track Savings Goals in a Spreadsheet - a broader goal tracker for the shorter targets that sit alongside a college fund
Frequently asked questions
How is this different from a one-box college savings calculator?
A single-box calculator answers one child at one contribution and one return, and shows a number. This workbook is built around up to three children and shows the work behind each: a year-by-year growth table for every account, a separate tuition-inflation schedule that ages college costs forward child by child, a 529-versus-taxable comparison that puts the tax treatment in dollars, and a sensitivity grid across six return rates and ten contribution levels. The dashboard then rolls all of it into a combined funding gap. The number a simple calculator gives you is one cell in the Contribution Planner grid here.
Where do the numbers in the template come from, and are they right for me?
Everything downstream is computed from the Setup sheet, and every figure on it is an editable input: each child's age, college start age, current savings, monthly contribution, and expected return, plus the annual cost today, the cost inflation rate, the years of college, and the two tax rates. The sample uses $30,000 for a year of tuition, fees, room and board, 5 percent cost inflation, and a 7 percent return, which are illustrative starting points, not a forecast. Real college costs vary widely by school and real returns depend on the markets, so the figures that matter are the ones you type in.
How does it handle more than one child?
The Setup sheet has three child slots. Fill in a child's age to include them and leave it blank to skip that slot, which keeps blank children out of every total. Each active child gets its own savings projection and its own tuition-inflation schedule, because a two-year-old and a five-year-old reach college in different years and face different inflated prices. The dashboard's multi-child summary carries one row per slot and a TOTAL that matches the KPI tiles, so the combined cost, savings, and gap always reconcile to the per-child rows.
Does the 529 versus taxable sheet tell me which account to use?
It shows the mechanical difference, not a recommendation. All three columns grow the same balance from Child 1's inputs, then apply each account's tax treatment: the 529 pays no tax on qualified withdrawals, the taxable brokerage applies the capital-gains rate to its gains, and the UTMA/UGMA applies an income-tax rate to stand in for kiddie-tax rules. In the sample that is an $8,821 tax saving for the 529 over the taxable account on the same gains. Which account actually fits depends on state 529 rules, financial-aid treatment, and your own tax situation, which a tax professional can confirm.
Does the template account for financial aid, scholarships, or the Roth rollover?
No. It projects what accounts are likely to hold and what college is likely to cost, and reports the gap between them. It does not model grants, scholarships, loans, the FAFSA treatment of a 529, or the rules for rolling unused 529 funds to a Roth IRA. Those are real parts of paying for college, and the IRS 529 guidance and a financial aid office cover them. The spreadsheet's job is the savings-and-cost arithmetic that sits underneath all of that.
Sources
- 529 plans: Questions and answers - Internal Revenue Service
- Fast Facts: Price of attending an undergraduate institution - National Center for Education Statistics
About this article
Sheet names, inputs, formulas, cached values, charts and screenshot captions re-checked on 2026-09-10 against the shipped College Savings Calculator Ultimate workbook (Dashboard, Setup, Savings Projection, Cost Projection, 529 vs Taxable, Contribution Planner, How to Use), and the free and Essentials tier comparison checked against those two shipped workbooks. The 529 tax-free-withdrawal statement was confirmed on 2026-09-10 against the live IRS 529 questions-and-answers page; the NCES price-of-attendance page was read for context on college costs, and no figure in this article is drawn from it. Last reviewed September 2026.