An auto loan spreadsheet does more than find a monthly payment. This walkthrough follows a workbook that holds three loan offers side by side, calculates each payment from the standard PMT formula, builds a full 84-month amortization schedule, adds insurance, maintenance, and fuel to reach a true cost of ownership, and tracks vehicle value against loan balance year by year. The worked example carries a $32,000 vehicle across a 60-month offer at 5.9%, a 72-month offer at 6.9%, and a 48-month offer at 4.9%, with a $27,000 loan on Offer 1 costing $520.73 a month and $4,244 in interest. Our Auto Loan Calculator Ultimate Spreadsheet Template ($29) ships the whole structure ready-made for Excel and Google Sheets.
A car quote is easy to read one line at a time and hard to compare across. One dealer offers a lower monthly payment, another a lower rate, a third a shorter term, and each of those numbers pulls a different way. The lowest payment often costs the most in the end, the shortest term costs the most each month, and the rate on its own tells you almost nothing until you know how long you carry it. What actually decides the question is the total you pay across the whole loan, plus the running costs of owning the car, set against what the car will be worth while you still owe on it. Those figures are exactly what a single-payment calculator hides and what a spreadsheet built for the job can hold.
This walkthrough follows a workbook that keeps three loan offers side by side and works each one from the price down to what the car is worth years later. It runs through six sheets in the order the work happens: a loan setup that holds the three offers, an amortization schedule that breaks the lead offer down month by month, an offer comparison that stacks the three quotes, a total cost analysis that shows how rate and term move the numbers, a depreciation table that tracks value against balance, and a dashboard that reads everything back. The examples come from our Auto Loan Calculator Ultimate Spreadsheet Template ($29), which ships the whole thing ready-made for Excel and Google Sheets. Everything it does is reproducible by hand if you would rather build your own auto loan spreadsheet from scratch.
What a comparison spreadsheet holds that a single calculator does not
Type a price, a rate, and a term into a free calculator and it hands back one monthly payment. That answers the smallest version of the question. The larger version, the one that actually costs or saves money, is which of several real quotes leaves you better off once every cost is counted, and it takes more than one number to answer. This workbook is built around four things a single-payment tool leaves out.
- Three offers, not one. The Loan Setup sheet carries three complete quotes in parallel, so a longer term at a higher rate and a shorter term at a lower rate sit next to each other with all their downstream numbers rather than being figured one at a time and half-remembered.
- The full schedule, not just the payment. A dedicated Amortization Schedule breaks the lead offer into 84 rows of principal and interest, so you can see how little of an early payment touches the balance and watch the split shift month by month.
- The cost of owning, not just borrowing. A True Cost of Ownership figure folds insurance, maintenance, and fuel into the loan total, because the payment is only part of what the car takes out of a budget each year.
- Value against balance over time. A Depreciation sheet estimates what the car is worth each year and sets it beside what is still owed, which is the only way to see whether a sale would clear the loan or leave a gap.
The walkthrough below follows the six sheets in that order, starting with the setup that feeds all of them and a How to Use sheet that carries the instructions.
Enter the offers: the Loan Setup sheet
The Loan Setup sheet is where every number in the file begins. Three offers sit in columns B, C, and D, which is the natural shape for holding a bank quote next to two dealer quotes, and the tinted cells are the ones you fill in. The header says as much plainly: enter loan details for up to three offers, and the results calculate automatically.
The top block, Vehicle & Loan Details, holds the inputs. In the sample all three offers are for the same $32,000 vehicle, which is what makes them comparable, and they differ in how the car is financed. Offer 1 puts $5,000 down over 60 months at 5.9 percent. Offer 2 puts $3,000 down over 72 months at 6.9 percent. Offer 3 puts $8,000 down over 48 months at 4.9 percent. Trade-in value is zero in each, a cell to fill if you are handing over an old car. The Loan Amount is not typed; it computes as vehicle price minus down payment minus trade-in, so the three offers finance $27,000, $29,000, and $24,000 respectively. The larger the down payment, the smaller the loan, which is why Offer 3 borrows the least despite the same sticker price.
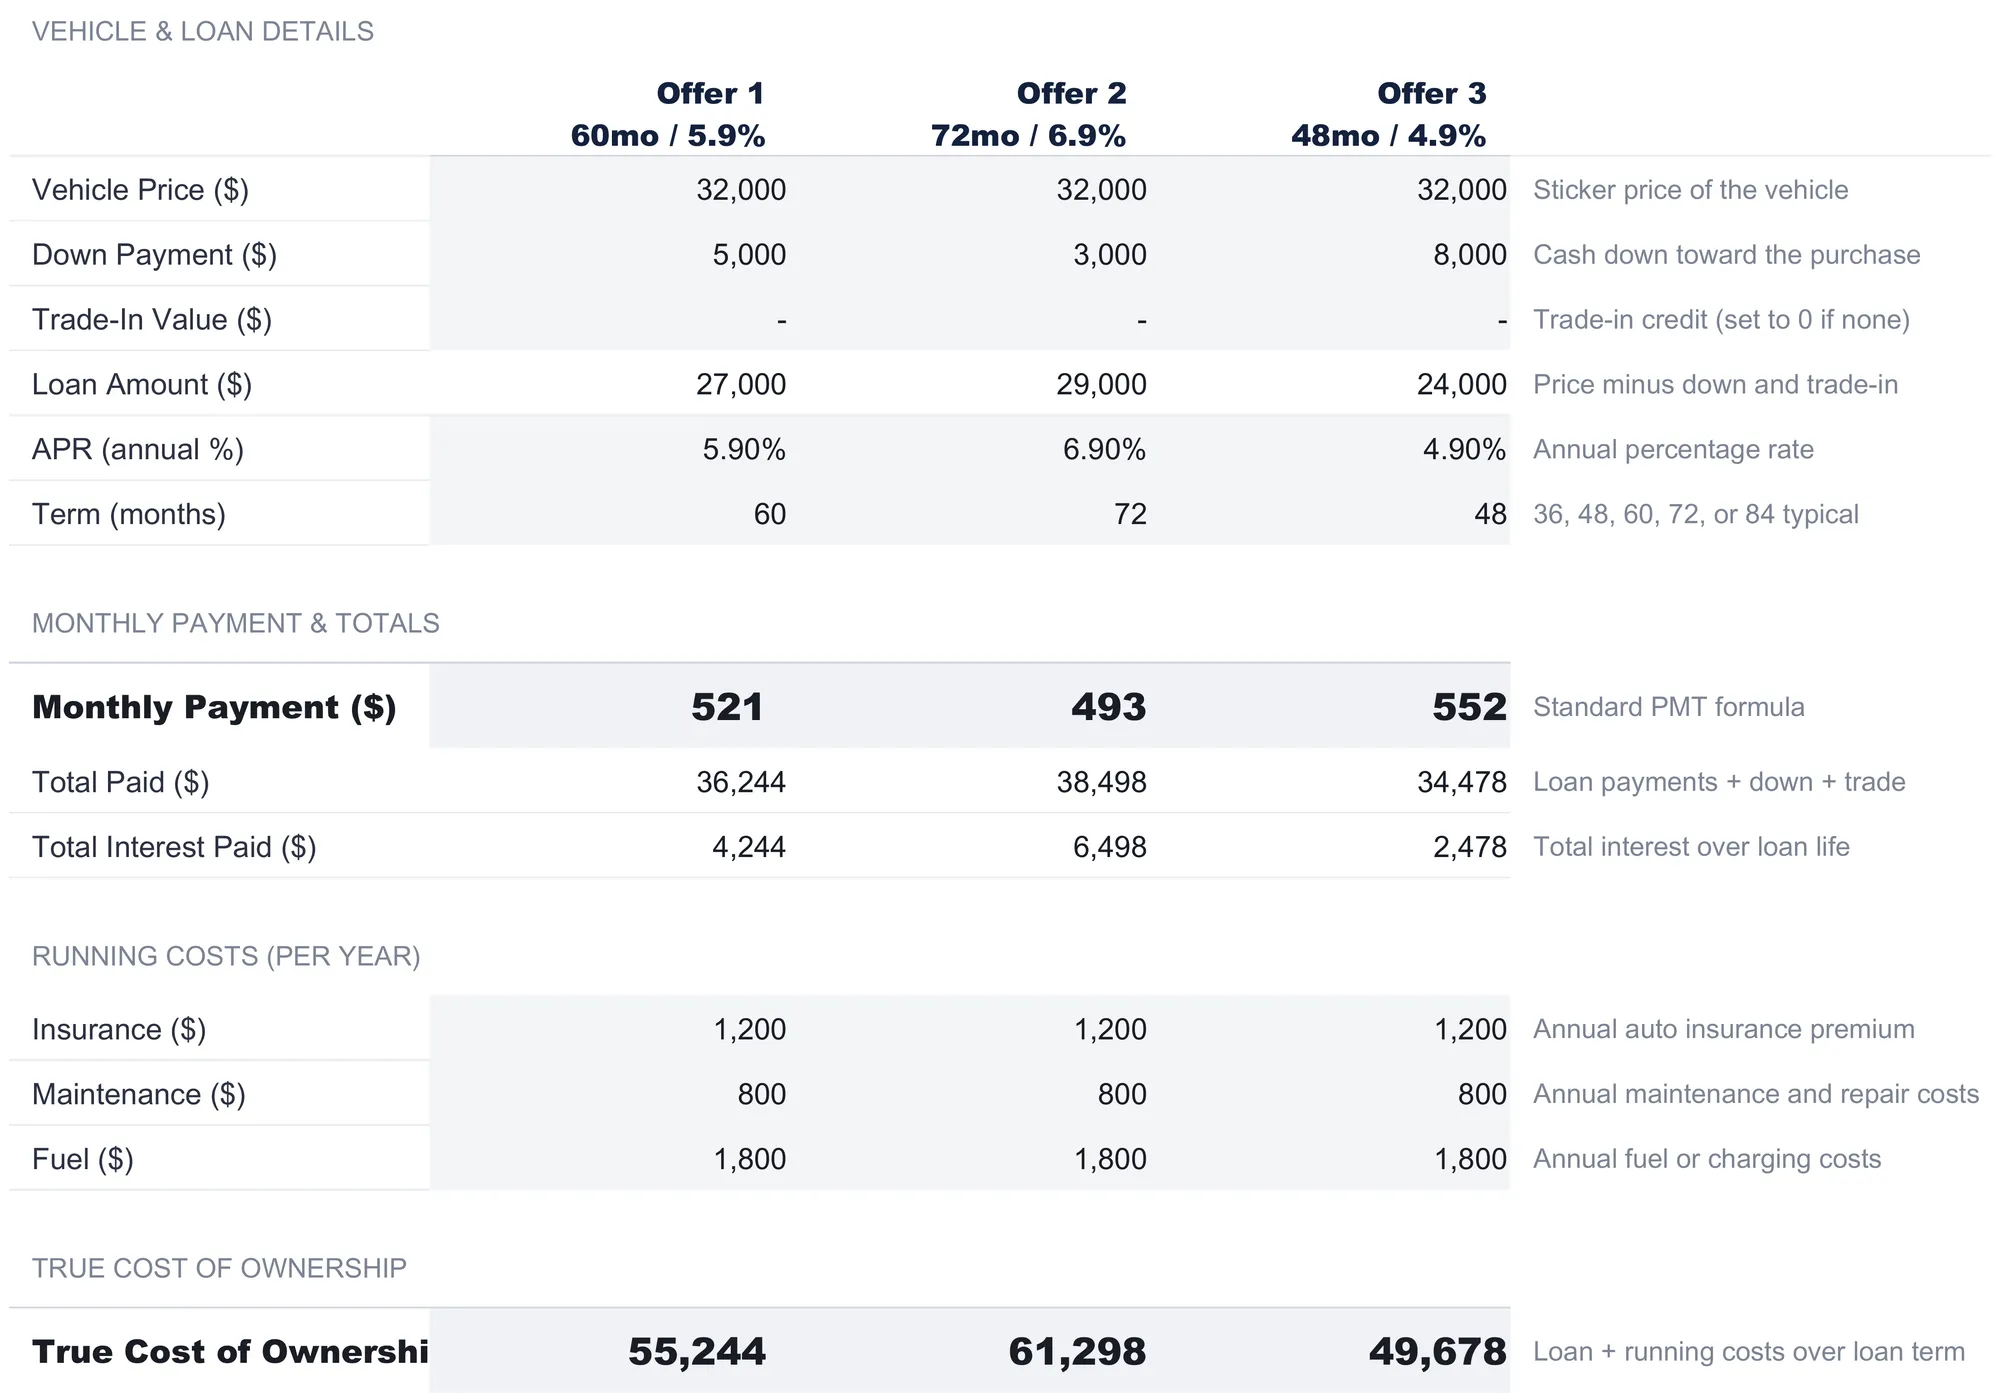
Below the inputs, the Monthly Payment & Totals block turns each offer into the figures that matter. The Monthly Payment is the standard PMT loan formula applied to the loan amount, rate, and term, and it works out to $520.73 for Offer 1, $493.03 for Offer 2, and $551.62 for Offer 3. Read those three alone and Offer 2 looks cheapest, because stretching $29,000 over 72 months makes each payment the smallest of the three. The Total Interest Paid row tells the other half of the story: $4,244 on Offer 1, $6,498 on Offer 2, and $2,478 on Offer 3. The offer with the lowest payment pays the most interest, and the offer with the highest payment pays the least, because a longer term buys a smaller payment with more months of interest. The Consumer Financial Protection Bureau explains the difference between a rate and an APR: the APR bundles the interest rate with lender fees into one figure that lets offers be compared on the same footing. It is the APR that feeds these calculations.
The Total Paid row adds the loan payments back to the down payment and trade-in, since money put down is still money spent on the car: $36,244, $38,498, and $34,478. And a Running Costs block underneath holds the yearly cost of keeping the car on the road, in the sample $1,200 of insurance, $800 of maintenance, and $1,800 of fuel, $3,800 a year across all three offers. Those feed the last figure on the sheet, the True Cost of Ownership, which the next sections build on.
Read the month-by-month split: the Amortization Schedule
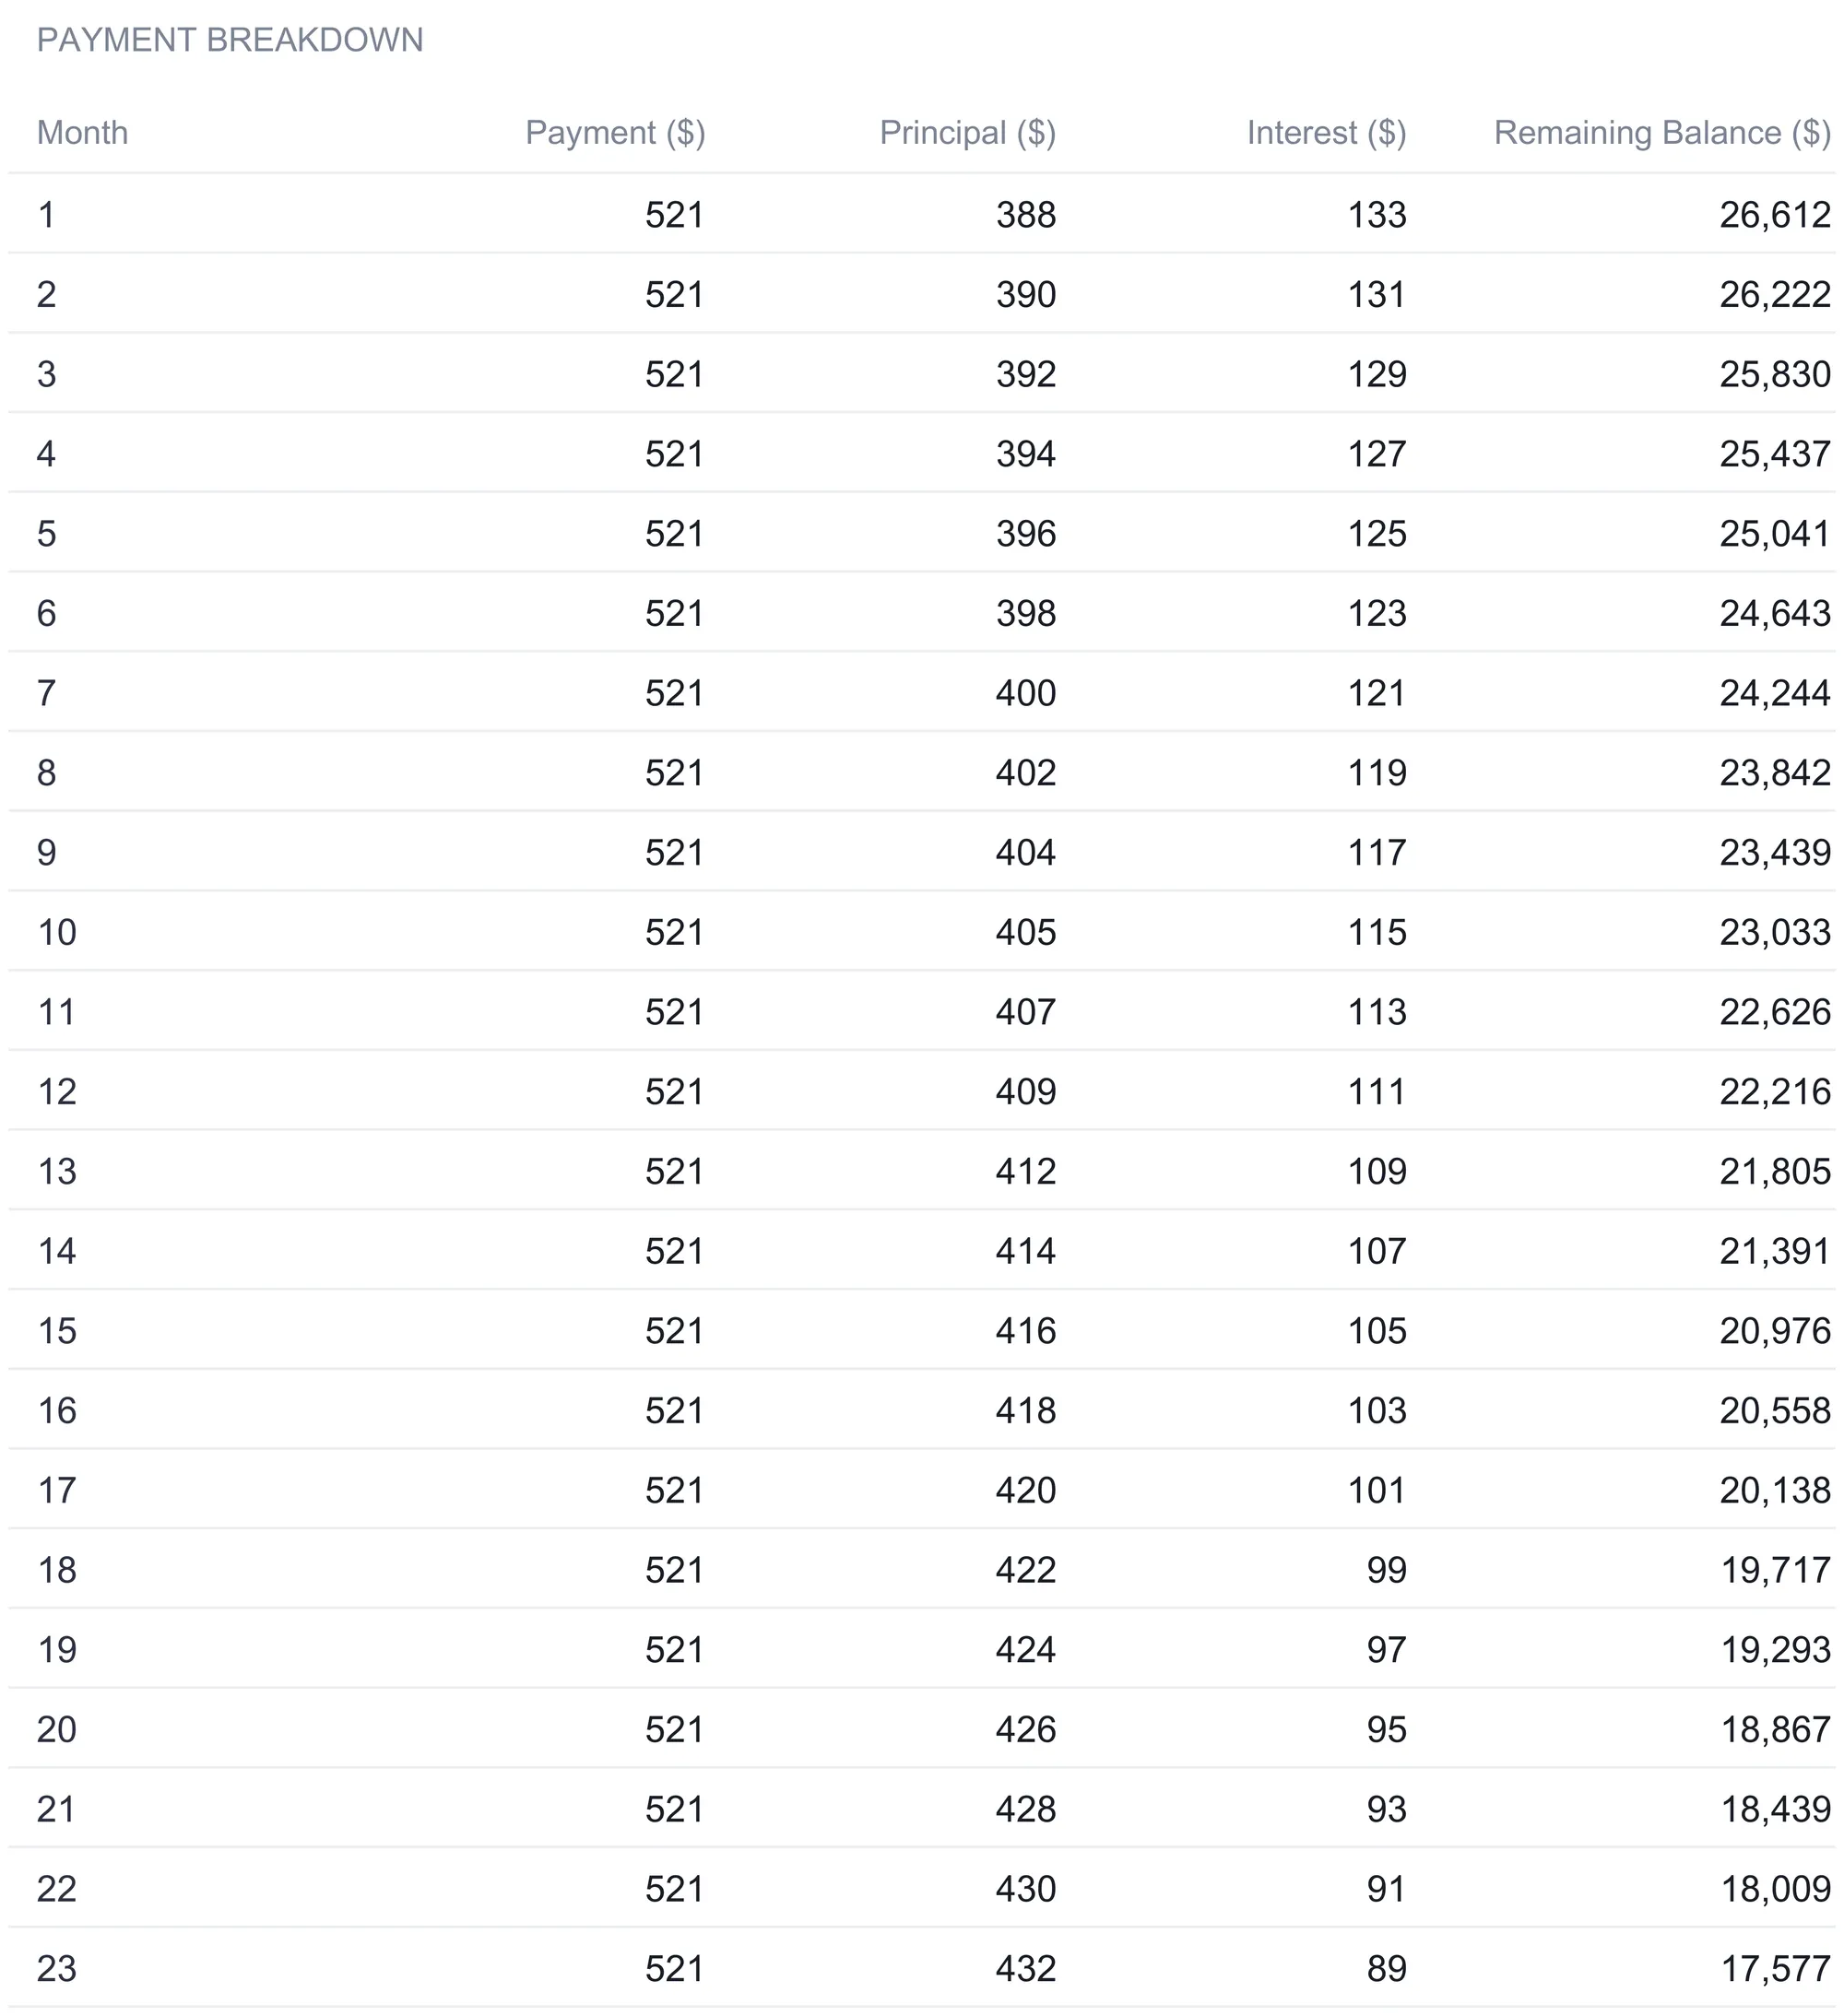
A payment is a single number; an amortization schedule is that number taken apart. The Amortization Schedule sheet lays out the full 84-month track for Offer 1, the $27,000 loan at 5.90 percent, with a row for every month showing Payment, Principal, Interest, and Remaining Balance. Eighty-four rows are there so the sheet can handle the longest common auto term even though this offer runs 60 months; rows past the term show blank or zero automatically.
The mechanics are worth seeing once. Month one charges interest on the whole $27,000 balance at one twelfth of the annual rate, which is $132.75, and the rest of the $520.73 payment, $387.98, goes to principal, leaving $26,612.02 owed. Month two charges interest on that slightly smaller balance, so a little less goes to interest and a little more to principal, and the balance drops to $26,222.13. That shift compounds gently across the loan: by month 12 the balance is down to $22,216.25, and the interest portion of each payment keeps shrinking while the principal portion grows. The payment itself holds at $520.73 all the way to the final month; only the split inside it moves.
The last month of the term is handled with a small piece of care that keeps the schedule honest. Instead of charging the standard payment and leaving a stray cent, the final month settles whatever balance remains plus that month’s interest, so month 60 clears the loan to exactly zero rather than a rounding remnant. That is the detail worth copying into any amortization schedule you build by hand, because the place these files usually go wrong is a balance that ends at a few cents above or below zero. The whole schedule recalculates the moment you change an input in Loan Setup, so a different price, rate, or term redraws all 84 rows at once.
The render above shows every money column rounded to whole dollars, which is how the sheet displays them; the underlying figures carry the cents used in the totals. Reading the first two dozen rows is usually enough to make the shape obvious: early payments are mostly interest, late payments are mostly principal, and the crossover is what paying a loan down actually looks like. The same mechanics drive any installment loan, and the general version is laid out in the guide to building a loan amortization schedule in a spreadsheet.
Stack the quotes: the Offer Comparison sheet
The Offer Comparison sheet is the clean summary you would print and set on the table. It pulls every figure directly from Loan Setup rather than recomputing anything, so it can never disagree with the source, and it lines the three offers up across the same rows: loan amount, APR, term, monthly payment, total interest, total paid, and true cost of ownership. Reading down a single column gives one offer in full; reading across a single row compares the three on one measure.
This is where the trade-off stops being abstract. Offer 2’s $493.03 payment is the lowest on the sheet, and its $61,298 true cost of ownership is the highest. Offer 3’s $551.62 payment is the highest, and its $49,678 true cost of ownership is the lowest. The gap between the cheapest and priciest true cost is more than $11,000 on the same $32,000 car, driven by how much is put down, the rate on each quote, and how long the loan runs. The sheet does not tell anyone which to choose, and the right answer depends on what a household can carry each month against what it wants to spend in total. What the layout does is make both ends of that decision visible at once, so the choice is made on the full picture rather than the payment alone.
See how rate and term move the numbers: the Total Cost Analysis
The offers on the other sheets are three fixed points. The Total Cost Analysis sheet fills in the space around them with two sensitivity grids, both built on the Offer 1 loan amount of $27,000. The top grid shows total interest paid for every combination of APR and term; the bottom grid shows the matching monthly payment. APR runs down the rows from 3 to 9 percent, and the term runs across the columns at 36, 48, 60, 72, and 84 months, the common auto loan lengths.
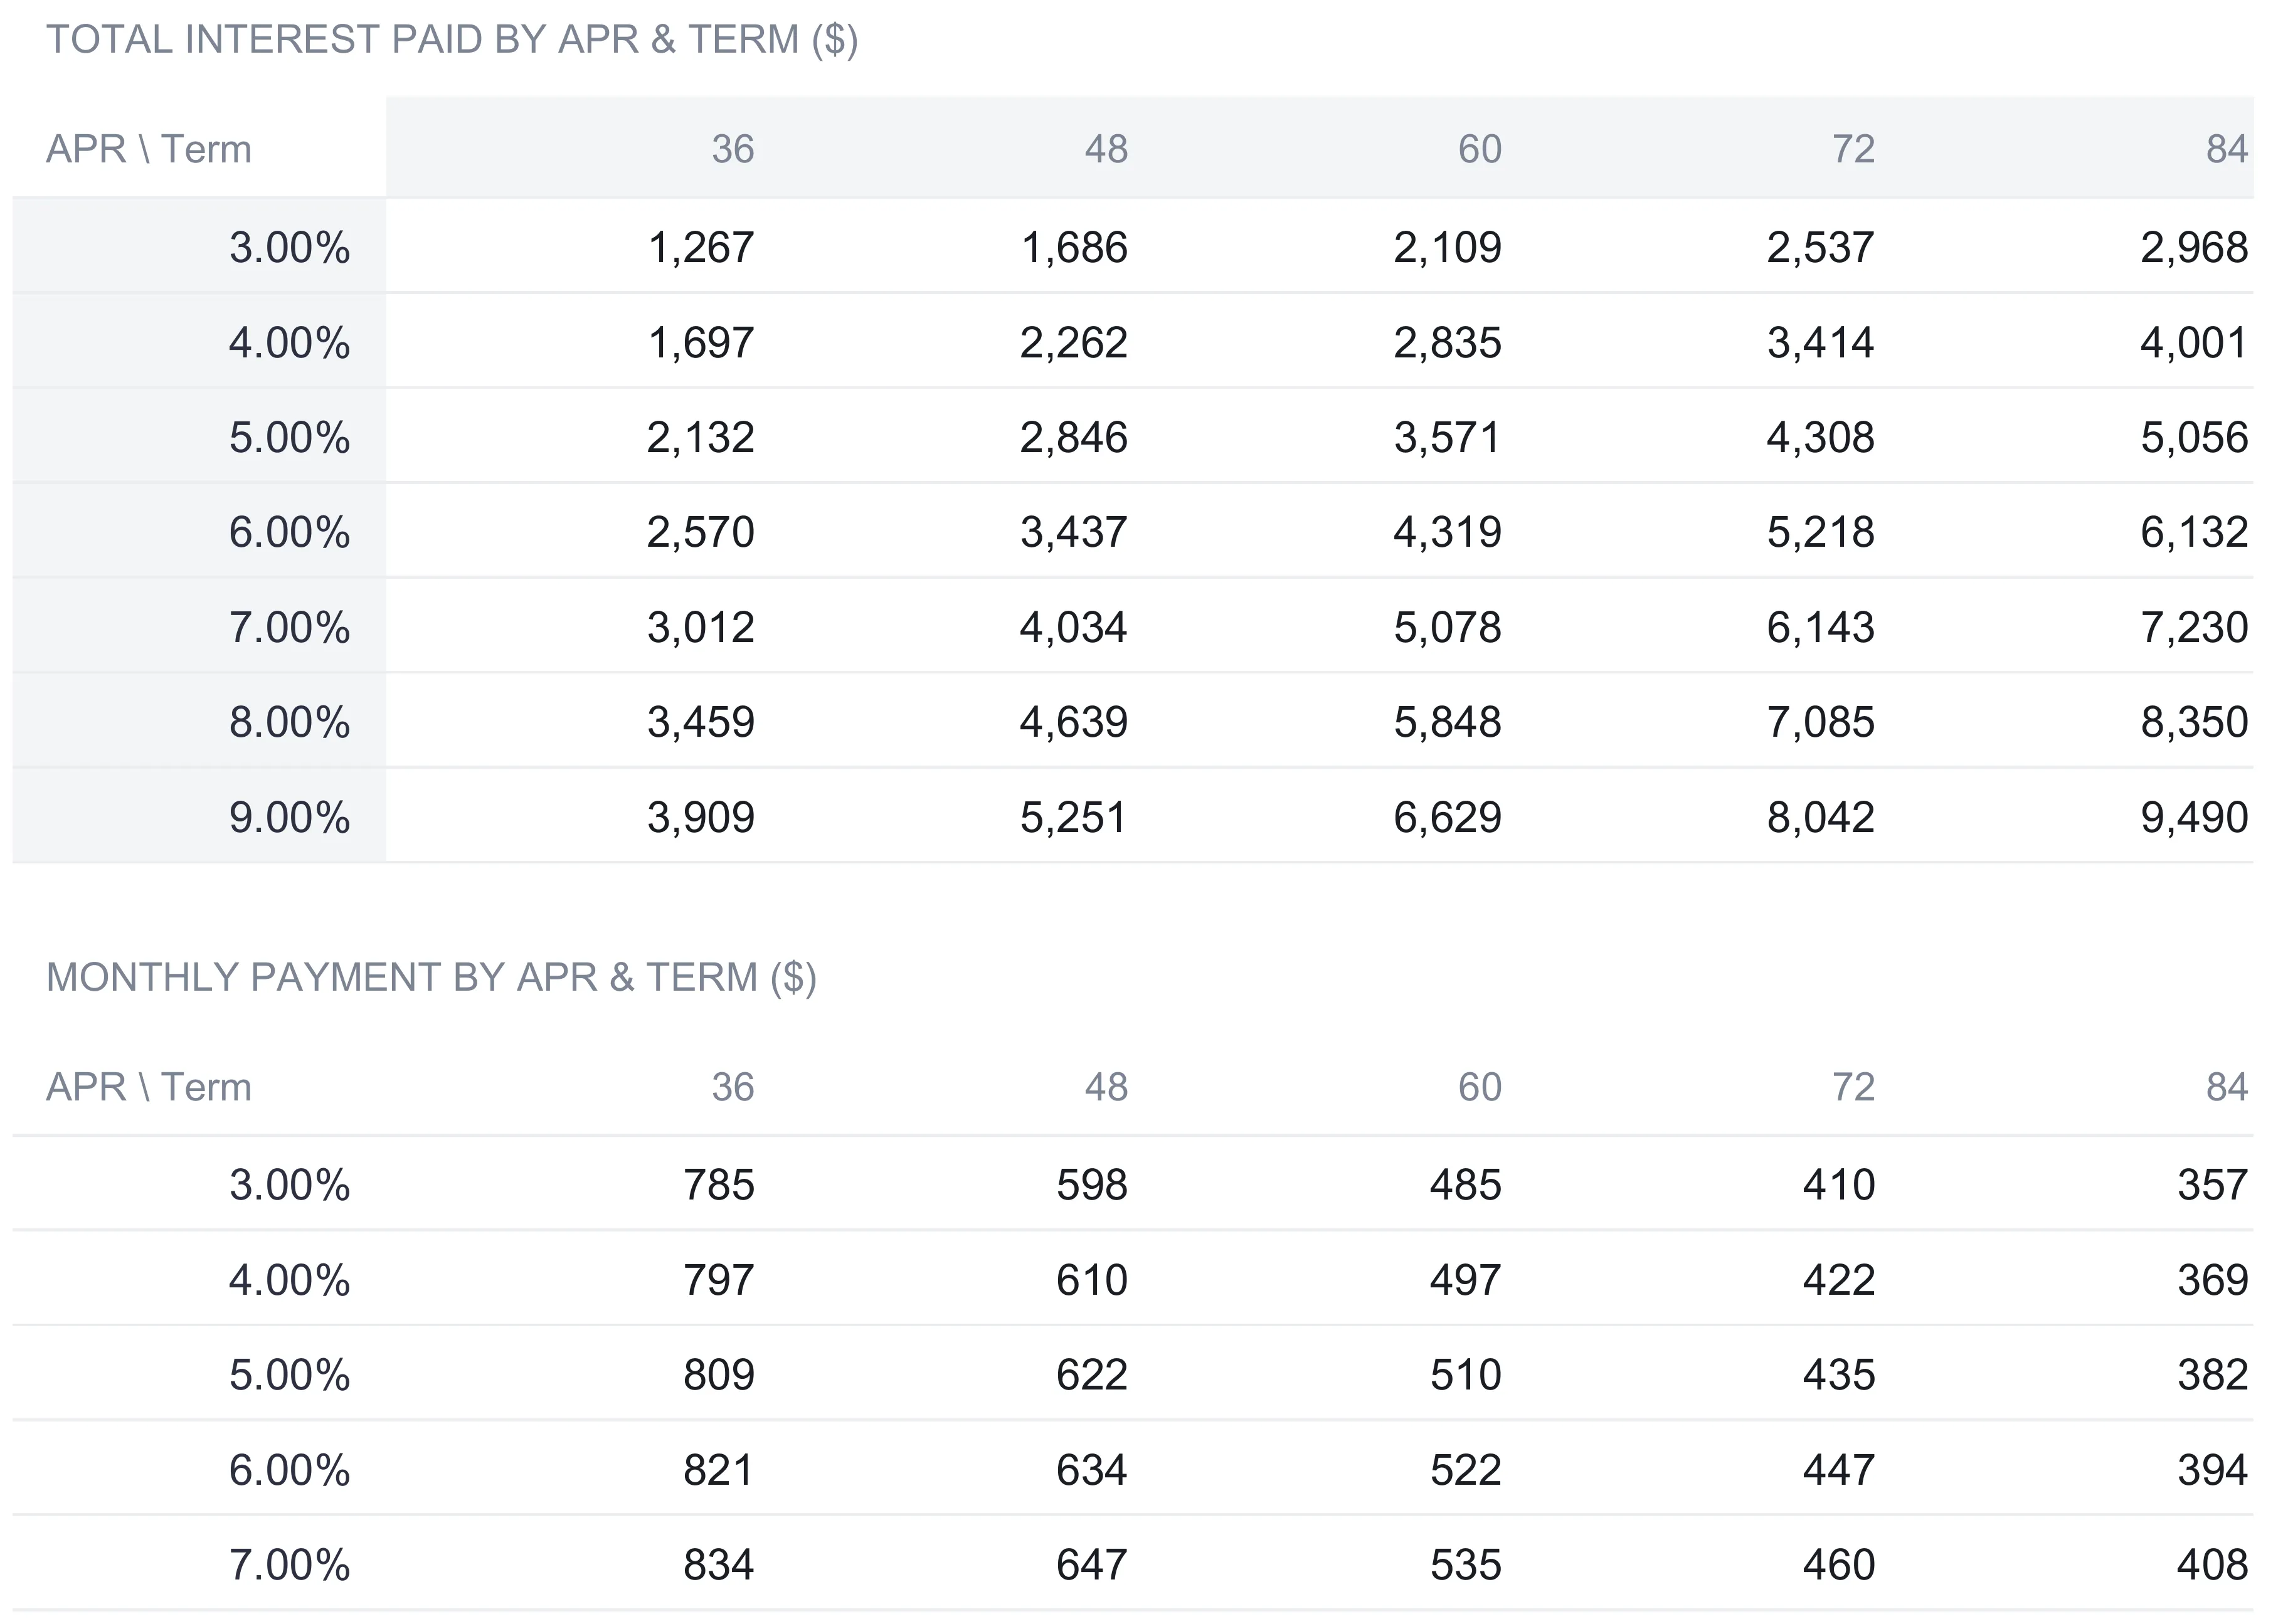
The grids make two relationships concrete. Read across a row and a longer term always lowers the monthly payment while raising the total interest: at 3 percent, $27,000 costs $785.19 a month over 36 months but only about $357 a month over 84 months, and the interest climbs from $1,266.84 to $2,967.84 for the privilege. Read down a column and a higher rate raises both the payment and the interest at once. The two facts together explain why the longest, highest-rate corner of the top grid, 9 percent over 84 months, reaches $9,490.44 of interest, more than seven times the cheapest corner. Finding the row and column nearest to a real quote shows roughly where it sits among the alternatives, and because the tinted APR column and term row are editable, they can be retyped to bracket a specific offer more tightly. Everything keys off the Offer 1 loan amount, so changing Offer 1’s price, down payment, or trade-in in Loan Setup redraws both grids.
Track value against balance: the Depreciation sheet
Borrowing cost is only half of what a car does to your finances. The other half is that the car itself loses value, often faster than the loan is paid down in the early years, and the Depreciation sheet is where the two curves meet. It estimates the vehicle’s value across seven years and sets it beside the Offer 1 loan balance, year by year, with an equity column, a depreciation rate, and a status flag sitting to the right of the two.
The assumed depreciation is steepest at the start, as it is for most vehicles: 20 percent of the purchase price in year one, then 15 percent a year in years two and three, and 10 percent a year from year four on. On the $32,000 car that takes the value from $32,000 at purchase to $25,600 after one year, $20,800 after two, $16,000 after three, and $9,600 after five. The loan balance beside it comes straight from the amortization schedule, falling from $27,000 to $22,216 after a year, $11,761 after three, and to zero once the 60-month term ends. The equity column is simply value minus balance, and the status flag reads Equity when that is positive and Underwater when the balance is larger than the car is worth.
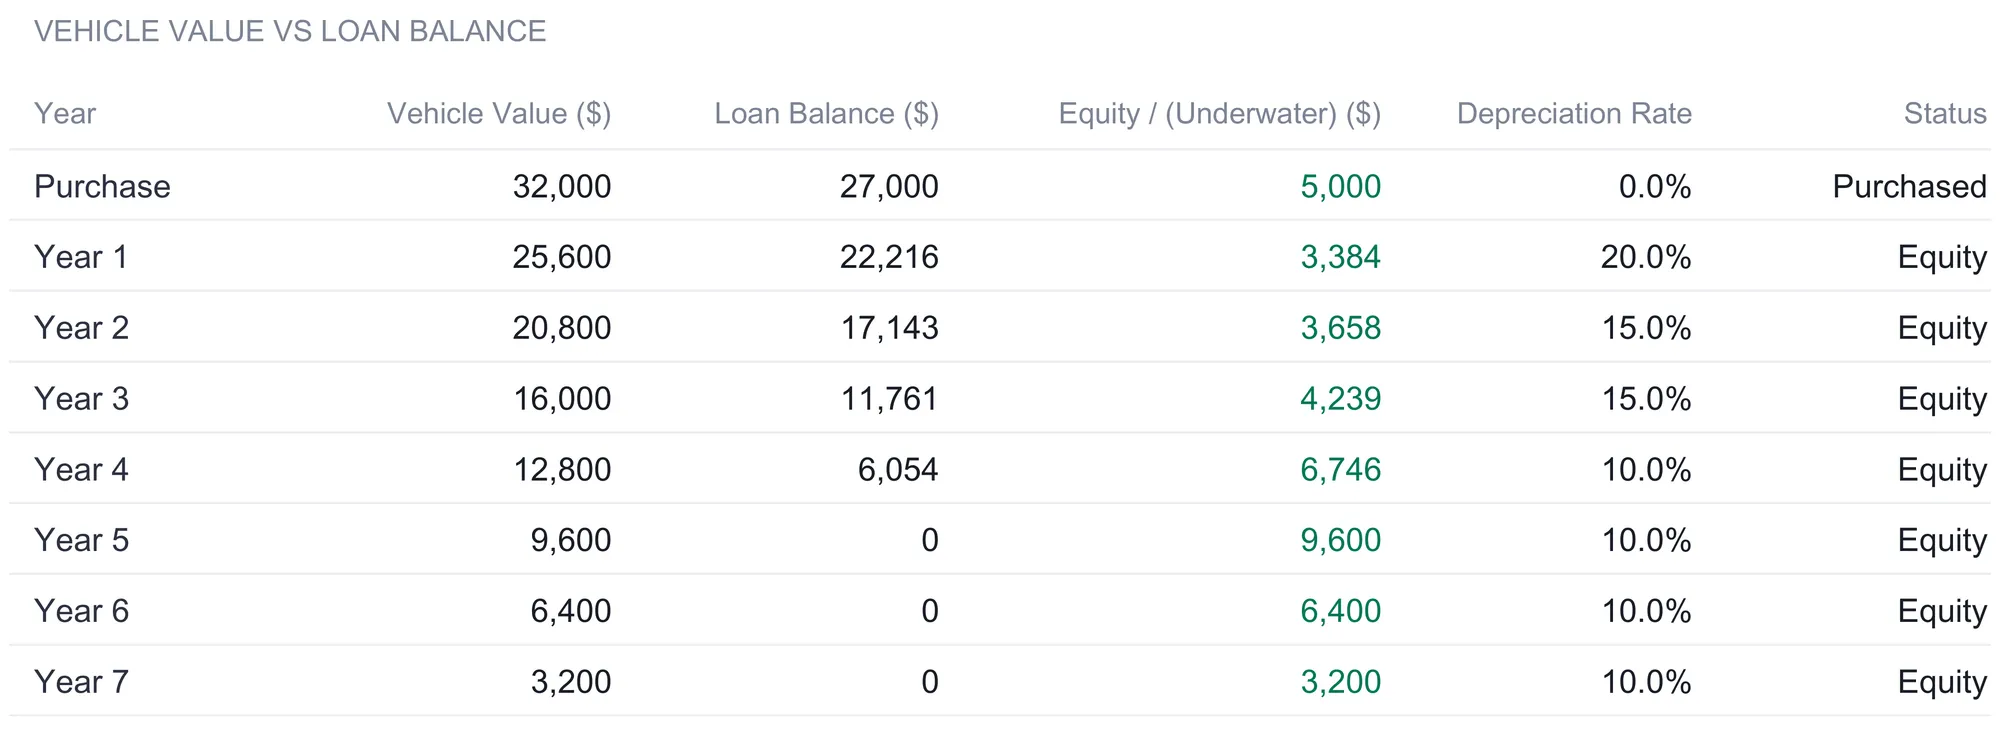
In the sample the status column reads Equity on every year row, under a purchase row flagged Purchased, and the reason is the $5,000 down payment. Starting the loan $5,000 below the sticker price keeps the balance under the depreciating value from day one, so selling the car at any point would clear what is owed. That is not automatic. A smaller down payment or a longer term slows how fast the balance falls, and the early years can flip to Underwater. That is the position the CFPB describes in its auto loan guidance as owing more than your vehicle is worth. Being underwater matters most if the car is totaled or sold before the loan catches up, and the value of laying value against balance is that it shows the exposure before it becomes a surprise. The depreciation rates are fixed inside the value formulas rather than typed, so the table scales with the purchase price it reads from, and the sheet notes that actual figures vary with make, model, condition, and mileage.
The dashboard: six numbers and two charts
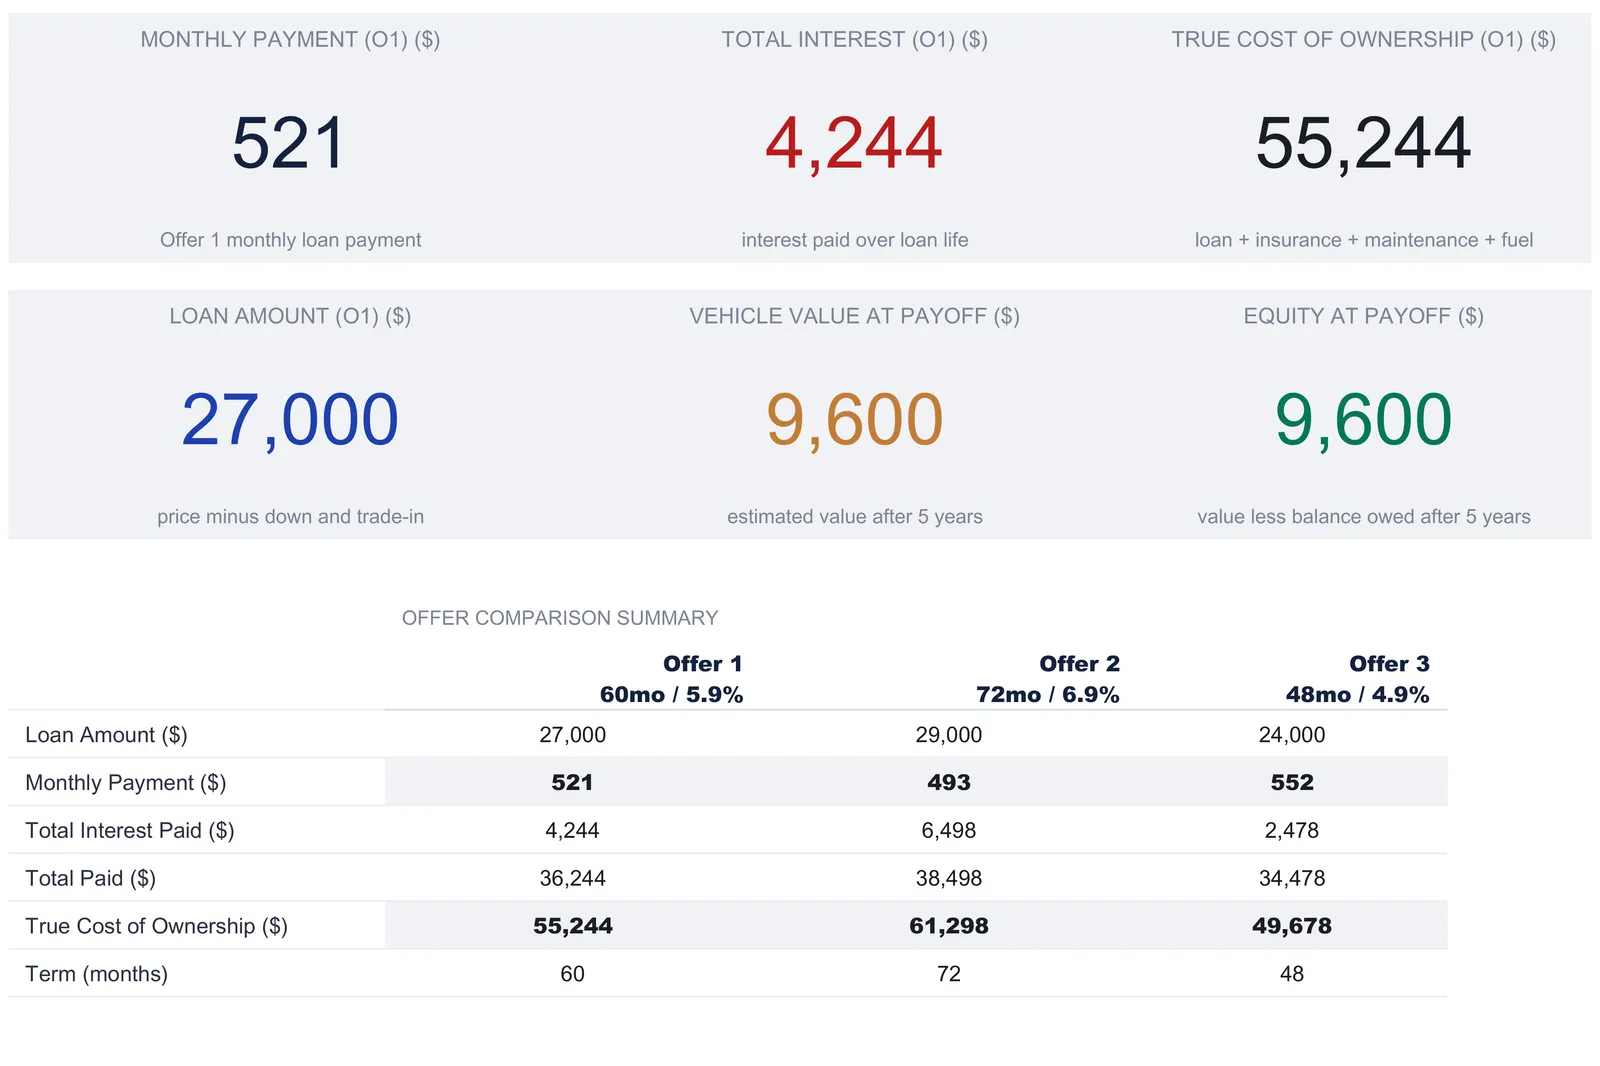
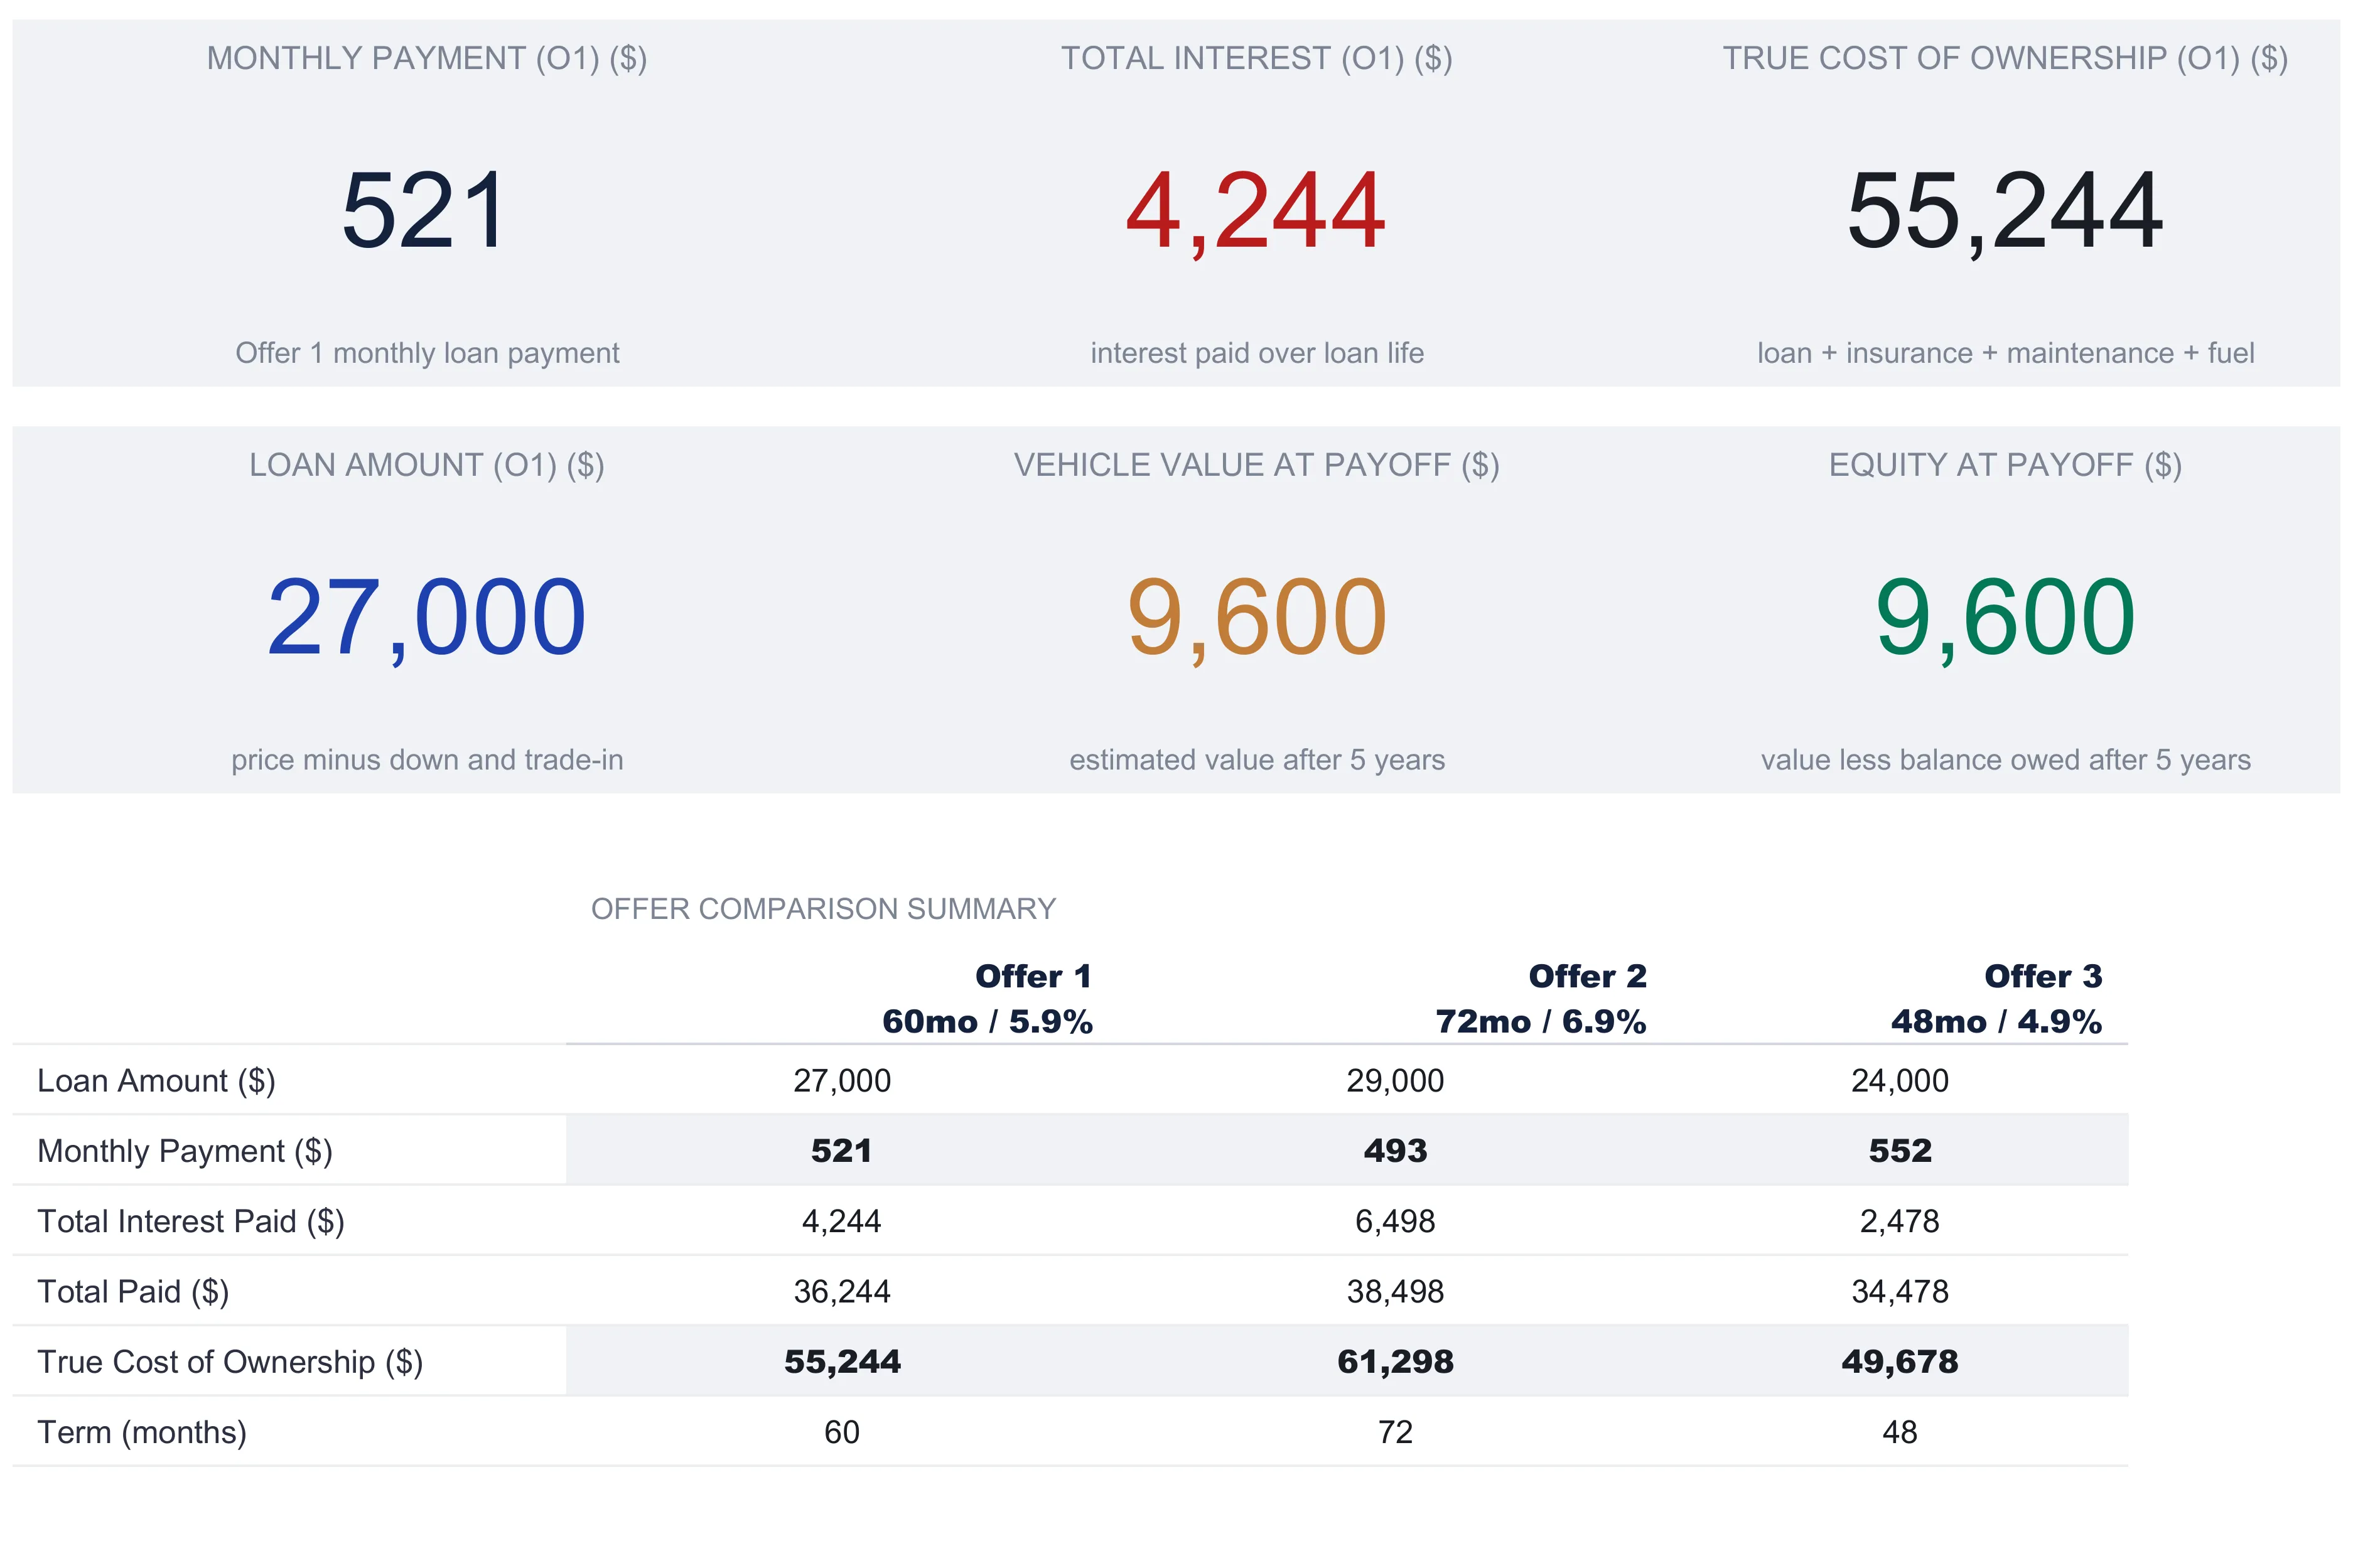
With three offers entered, the Dashboard reads the lead offer back at a glance. Six KPI tiles sit across the top, all for Offer 1.
| Tile | Sample value | What it reads |
|---|---|---|
| Monthly payment (O1) | $520.73 | Offer 1’s monthly loan payment |
| Total interest (O1) | $4,244 | Interest paid over the loan life |
| True cost of ownership (O1) | $55,244 | Loan plus insurance, maintenance, and fuel |
| Loan amount (O1) | $27,000 | Price minus down payment and trade-in |
| Vehicle value at payoff | $9,600 | Estimated value near the end of the term |
| Equity at payoff | $9,600 | That value less any balance still owed |
Two of these repay a second look. The True Cost of Ownership, $55,244, is the figure the whole workbook is built toward: it takes Offer 1’s $36,244 total paid and adds five years of running costs at $3,800 a year, which is $19,000, to show what the car really costs beyond the loan. That number reframes the choice, because the $520.73 payment is about three fifths of what the car draws from a budget each month once fuel, insurance, and upkeep are counted. The Vehicle Value at Payoff and Equity at Payoff tiles read the depreciation sheet at the year closest to the end of the term, five years for a 60-month loan. Both show $9,600 here because the loan is fully paid by then, so the equity equals the whole remaining value.
Below the tiles, an Offer Comparison Summary repeats the three offers so the lead figure never sits without its alternatives. Two charts turn the numbers into pictures. A Loan Balance Over Time chart for Offer 1 traces the balance from $27,000 at purchase down to zero at month 60, and a Vehicle Value vs Loan Balance chart draws the depreciation and payoff curves together so the equity gap between them is visible at a glance. A currency dropdown next to the title relabels every money header and KPI across the workbook, switching the symbol shown among dollars, euros, pounds, and many more without converting the underlying numbers.
Payment, interest, and true cost in plain terms
Three phrases carry most of the confusion in a car deal, and each is a plain step from the one before.
Monthly payment is what leaves your account each month, set by the loan amount, the APR, and the term through the standard PMT formula. It is the number dealers lead with because it is the easiest to make look small, and stretching the term is the usual way to shrink it.
Total interest is the price of borrowing across the whole loan, the sum of every interest slice in the amortization schedule. A smaller monthly payment usually means a larger total interest, because a longer term is more months of interest even at the same rate.
True cost of ownership is the total the car takes from a budget: the total paid on the loan plus every year of insurance, maintenance, and fuel across the term. It is the widest of the three figures and the one that most often reorders which offer looks best, since the deal with the smallest payment can carry the largest true cost.
Accepting a higher payment now to save on interest, or carrying more interest to keep the monthly payment low, are the two ends of one decision. The workbook puts both ends on the screen at once rather than one at a time.
Excel or Google Sheets for comparing auto loans
The template is an .xlsx file built on standard formulas, with no macros, VBA, or add-ins, and the How to Use sheet says it works in both Microsoft Excel and Google Sheets. Google Sheets suits comparing quotes from a phone at the dealership or sharing the file with a partner to look at together; Excel suits a local file kept on one machine. The structure described here, three offers feeding an amortization schedule, a true cost figure, and a depreciation view, is equally buildable in either, and nothing in this walkthrough depends on a feature only one of them has. The tinted cells mark the inputs, and the white formula cells warn before they are overwritten, so it is hard to break a calculation by typing in the wrong place.
Which template fits the job
- Auto Loan Calculator Ultimate Spreadsheet Template ($29) is the workbook this walkthrough follows: three offers side by side, the standard PMT payment for each, an 84-month amortization schedule for the lead offer, a true cost of ownership that folds in insurance, maintenance, and fuel, the rate-and-term sensitivity grids, and the seven-year depreciation table, all reading back to a six-KPI dashboard. The tier family starts smaller, with a free Auto Loan Calculator that works one loan on a single sheet, returning the monthly payment, total paid, and total interest, and an Auto Loan Calculator Essentials ($19) that adds a dashboard and an amortization schedule around one loan. The Ultimate version is the one that carries the three-offer comparison, the true cost figure, and the depreciation view.
- Lease Vs Buy Calculator Ultimate Spreadsheet Template ($29) answers the question one step earlier. Before comparing three loans to buy a car, some people are still deciding whether to buy at all or lease it; that workbook runs a five-year lease-versus-buy comparison with scenario analysis and break-even modeling, so the financing decision this template handles picks up where the ownership decision leaves off.
Related
- How to Build a Loan Amortization Schedule in a Spreadsheet - the general mechanics behind the month-by-month schedule, for any installment loan
- Auto Loan Payoff Calculator and Early Payment Strategies - what happens to interest and term when extra is put toward the balance
- Lease vs. Buy Calculator: Which Way to Get Your Next Car - the ownership decision that sits ahead of the financing one
- How to Calculate a Mortgage Payment in a Spreadsheet - the same PMT arithmetic on a much longer loan
Frequently asked questions
How is this different from a basic auto loan calculator?
A basic calculator returns one monthly payment for one set of inputs. This workbook holds three offers side by side, so a 60-month deal at 5.9 percent, a 72-month deal at 6.9 percent, and a 48-month deal at 4.9 percent line up in one view with their payment, total interest, total paid, and true cost of ownership. It then adds three things a single-payment calculator leaves out: a full 84-month amortization schedule for the lead offer, insurance, maintenance, and fuel folded into a true cost of ownership, and a seven-year depreciation table that tracks the car's value against the loan balance.
Which offer is the cheapest one in the sample?
It depends on which cost you read. Offer 2 has the lowest monthly payment at $493.03 because its 72-month term spreads the loan furthest, but it pays the most interest, $6,498, and the highest true cost of ownership, $61,298. Offer 3 has the highest payment at $551.62 over 48 months yet the least interest, $2,478, and the lowest true cost of ownership, $49,678. The workbook does not pick a winner; it lays the three numbers out so the trade-off between a lower payment and a lower total is visible rather than hidden.
How does the amortization schedule reach exactly zero at the end?
Each month the sheet charges interest on the remaining balance, then applies the rest of the fixed payment to principal. On Offer 1, month one carries $132.75 of interest on the $27,000 balance and $387.98 of principal, leaving $26,612.02. Interest shrinks and principal grows every month after that. The final month of the term settles whatever balance is left plus that month's interest instead of charging the standard payment, so month 60 clears the loan to zero rather than leaving a rounding remainder.
What does the depreciation sheet mean by being underwater?
Underwater means the loan balance is larger than the car is worth, so selling it would not cover what is still owed. The sheet compares an estimated vehicle value to the Offer 1 loan balance each year and flags each year row as Equity or Underwater, under a purchase row flagged Purchased. In the sample the car never goes underwater, because the $5,000 down payment keeps the balance below the depreciating value from the start. A smaller down payment or a longer term can flip early years to Underwater, which is the pattern the table is built to reveal.
Are the rates and depreciation figures in the template accurate for my car?
The loan figures are sample assumptions you replace. The vehicle price, down payment, APR, term, and the annual insurance, maintenance, and fuel figures are all input cells you overwrite with your own quotes. The depreciation rates, 20 percent in year one and then 15 and 10 percent, sit inside the value formulas rather than in input cells, and the sheet notes they are estimates that vary by make, model, condition, and mileage. The workbook does the arithmetic once your real numbers are in; the accuracy of the result is only ever as good as the offers and estimates you type.
Sources
- What is the difference between a loan interest rate and the APR? - Consumer Financial Protection Bureau
- Auto loans - Consumer Financial Protection Bureau
About this article
Sheet names, inputs, formulas, figures, dropdowns, and both dashboard charts checked on 2026-09-10 against the shipped Auto Loan Calculator Ultimate workbook (Dashboard, Loan Setup, Amortization Schedule, Offer Comparison, Total Cost Analysis, Depreciation, How to Use). Tier comparison checked on 2026-09-10 against the shipped free and Essentials Auto Loan Calculator workbooks. Consumer Financial Protection Bureau pages on interest rate versus APR and on auto loans rechecked live on 2026-09-10. Last reviewed September 2026.