A mortgage payment is more than principal and interest. This walkthrough builds the full PITI figure in a spreadsheet from a $350,000 sample home with 20% down, a $280,000 loan at 6.5%, and a $2,269.79 monthly total, then adds an amortization schedule, a three-scenario comparison, an extra-payment grid, and a refinance break-even. The Home Mortgage Calculator Ultimate ($29) ships the whole structure ready-made for Excel and Google Sheets.
Ask what a mortgage payment is and most people name one number, the amount that leaves the account each month. That number is real, but it hides at least four moving parts and sometimes five. Principal and interest repay the loan. Property tax and homeowners insurance ride alongside it. Private mortgage insurance joins in when the down payment is small. Change the home price, the rate, the term, or the down payment, and every one of those parts shifts, along with the total interest the loan will cost over its life. A spreadsheet is a natural place to pin all of that down, because the whole calculation follows from a short list of inputs.
That is the idea this walkthrough builds out. You type a handful of figures, the home price, the down payment, the rate, the term, and a couple of annual costs, and the sheet returns the monthly payment, the full PITI total, the interest over the life of the loan, and a payoff date. The examples below come from our Home Mortgage Calculator Ultimate Spreadsheet Template ($29), which ships the whole thing ready-made for Excel and Google Sheets. It carries three loan scenarios at once, a full amortization schedule, an extra-payment grid, a refinance break-even, and a dashboard on top. The layout is reproducible by hand if you would rather build your own.
What a mortgage payment adds up to
Strip a monthly housing payment down and there are two categories inside it: the cost of the loan, and the cost of owning the home the loan bought. The calculator keeps both visible rather than collapsing them into one figure.
The cost of the loan is principal and interest, usually written P&I. Principal is the slice that reduces the balance you owe. Interest is the lender’s charge on the balance that is still outstanding, calculated each month as the balance times the annual rate divided by twelve. Because the payment is a fixed amount, whatever is left after covering that month’s interest goes to principal, and the split between the two shifts a little every month.
The cost of owning is property tax and homeowners insurance, and often private mortgage insurance on top. These are not the lender’s charges for lending; they are bills that come with the property, which a lender frequently collects monthly alongside the loan. Add the four together, principal, interest, taxes, and insurance, and you have PITI, the acronym the industry uses for the real monthly number. When the down payment is under 20%, PMI is the fifth piece stacked on. The sheet computes each part separately and then sums them, so you can always see which part of the payment is which.
That separation is the whole reason to lay a mortgage out this way. A payment quoted as a single figure tells you what leaves the account. A payment broken into its parts tells you why, and it lets you see what happens to each part when an input changes.
Start with the inputs: the Loan Setup sheet
Loan Setup is where the small number of typed figures live, and it comes first because everything downstream reads from it. The sheet lays out three scenarios side by side in tinted input cells, so the same home can be modeled three ways at once.
In the sample, all three scenarios use a $350,000 home price. Scenario 1 puts 20% down, which is $70,000, leaving a $280,000 loan at a 6.5% annual rate over a 30-year term. Scenario 2 keeps the same home but puts only 10% down, so its loan is larger at $315,000, its rate is 6.75%, and because the down payment is under 20%, private mortgage insurance applies. Scenario 3 returns to 20% down and the $280,000 loan but shortens the term to 15 years. Each scenario also carries the annual property tax of $4,200, annual home insurance of $1,800, a PMI rate of 0.5%, and an extra monthly payment, which is left at zero in the sample. The down payment dollar figure and the loan amount are themselves computed, so typing a percentage fills in the rest.
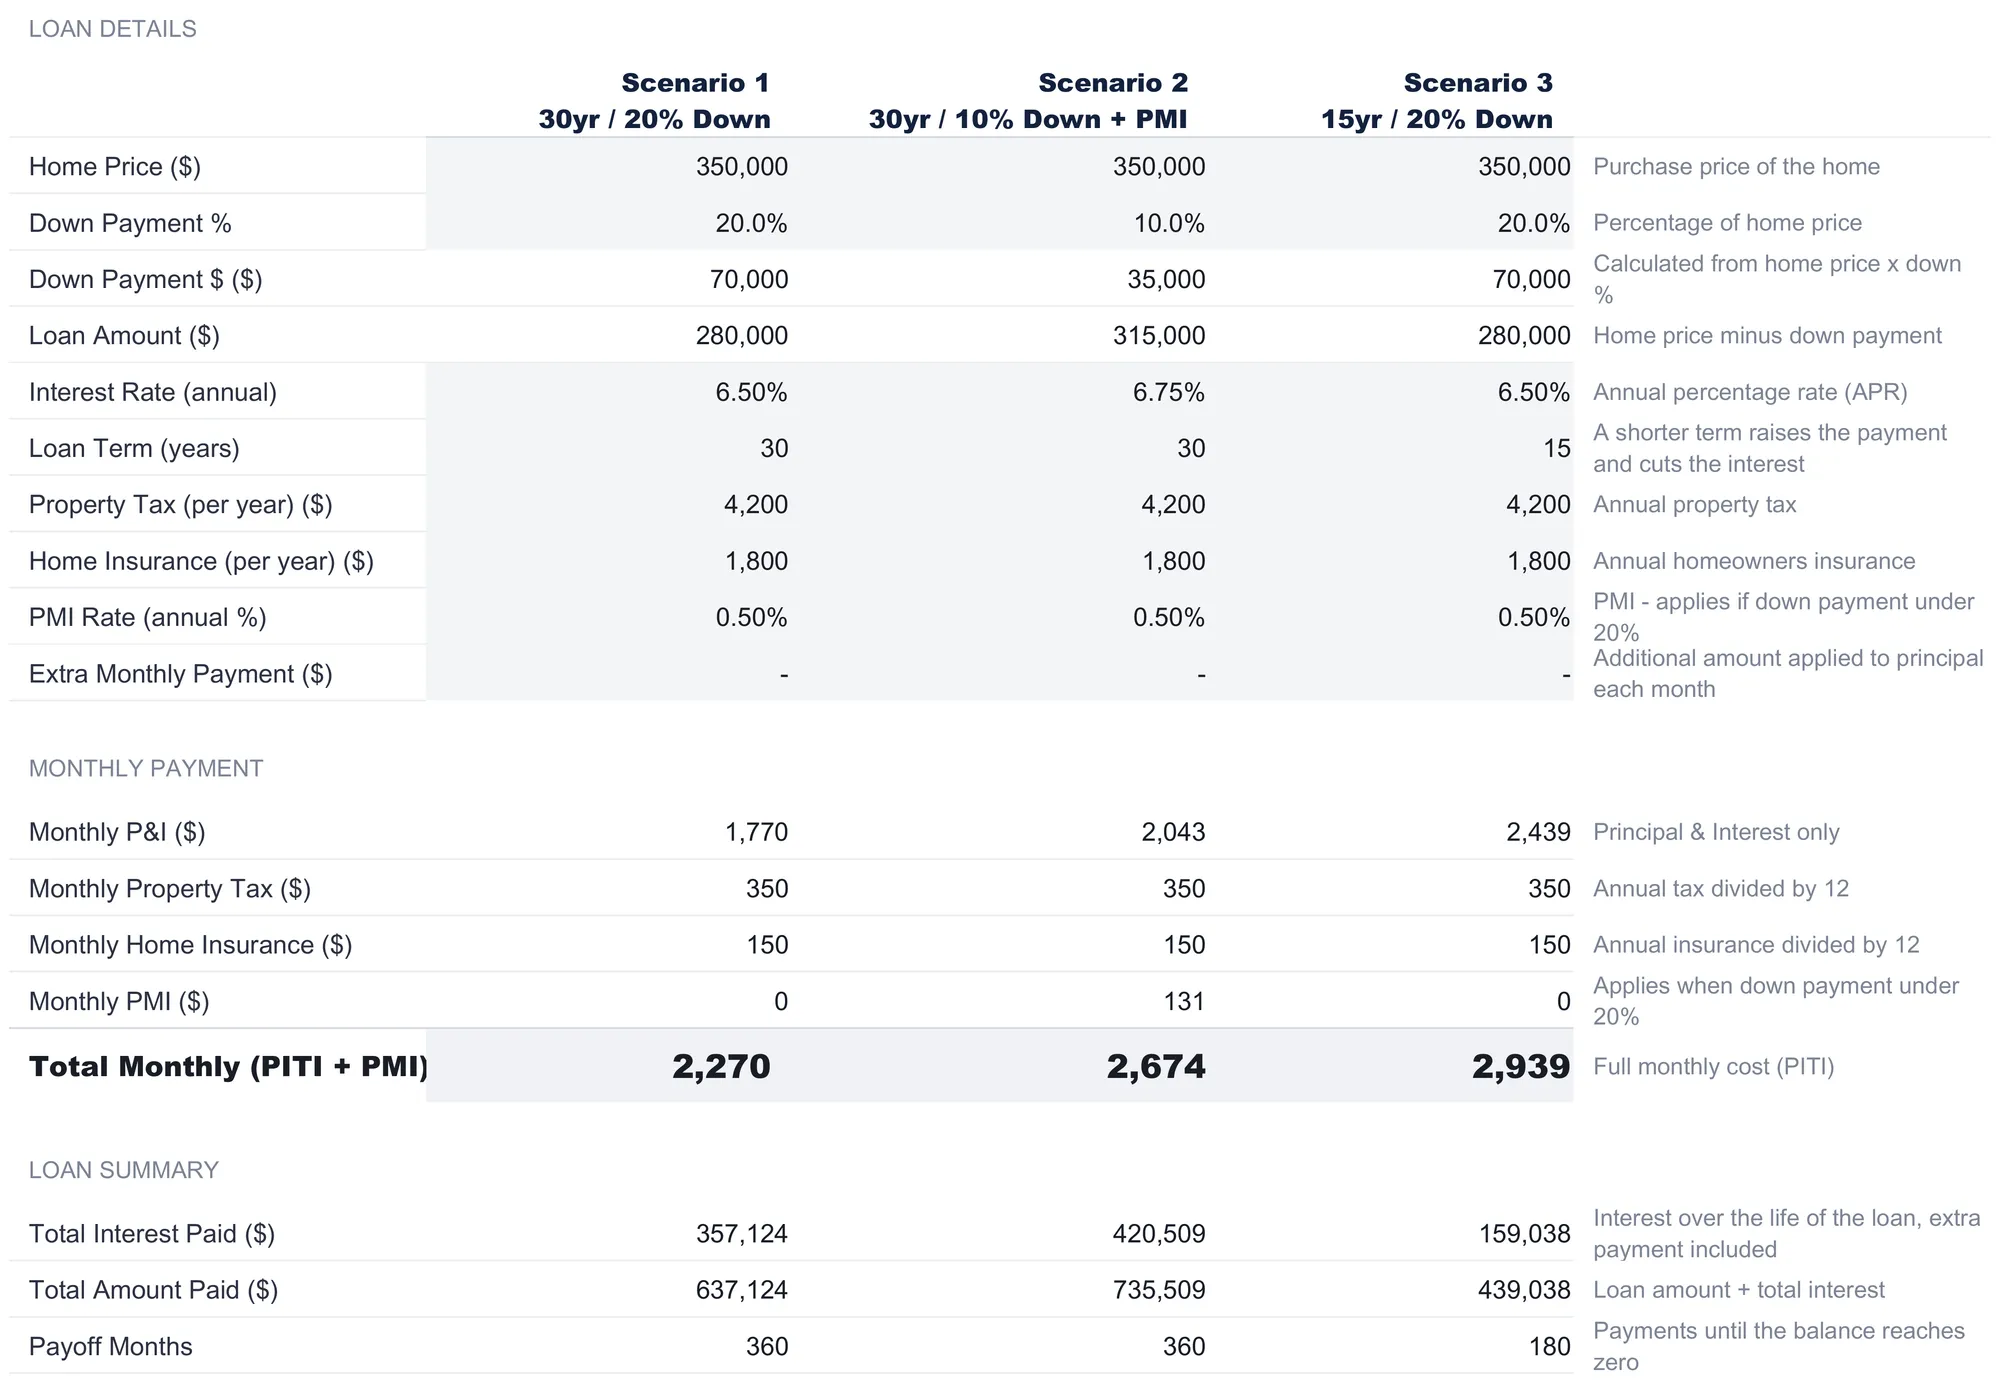
Below the inputs, the monthly payment block computes each part. The Monthly P&I is the one figure that looks like it needs a calculator, and in a spreadsheet it does not, because it is exactly what the PMT function returns. Written out, that is =PMT(rate/12, months, -loan), and the workbook uses the closed-form version of the same standard formula, the loan amount times the monthly rate, divided by one minus the compounding factor over the full term. For Scenario 1, $280,000 at 6.5% over 360 months resolves to $1,769.79 a month. Scenario 2’s larger loan at a higher rate resolves to $2,043.08, and Scenario 3’s 15-year term pushes the payment up to $2,439.10 even though the balance is the same as Scenario 1.
The tax and insurance rows are simpler: monthly property tax is the $4,200 annual figure divided by twelve, or $350, and monthly insurance is $1,800 divided by twelve, or $150. Monthly PMI is where the scenarios diverge. Scenario 1 and Scenario 3 both put 20% down, so their PMI is $0. Scenario 2 puts 10% down, so the sheet charges $131.25 a month, computed as the loan amount times the 0.5% annual rate, divided by twelve. The Consumer Financial Protection Bureau describes PMI as insurance that “protects the lender, not you, if you stop making payments,” typically required on a conventional loan when the down payment is under 20%, which is exactly the condition the sheet tests. Add the parts and the Total Monthly (PITI + PMI) row lands at $2,269.79 for Scenario 1, $2,674.33 for Scenario 2, and $2,939.10 for Scenario 3.
A loan summary block finishes the sheet. It reports total interest paid over the life of each loan, $357,124 for Scenario 1, $420,509 for Scenario 2, and $159,038 for Scenario 3, along with a total amount paid that adds the loan back on, and a payoff month count of 360, 360, and 180. Those payoff counts are the terms in months, which is where the 15-year Scenario 3 pays off in half the time. A currency dropdown on the Dashboard labels every money column across all the sheets. It relabels only, with no conversion of the underlying numbers, so switching the symbol changes how the figures read without touching what they are. Loan Setup is where the typed inputs behind the three scenarios live, and that is the discipline the rest of the file depends on. When the home price or a rate changes here, the schedule, the comparison, the grids, and the dashboard all follow from it.
The month-by-month schedule: the Amortization Schedule sheet
The Loan Setup sheet reports the loan’s totals. The Amortization Schedule sheet shows how it gets there, one payment at a time, for Scenario 1. Every cell here is computed from Loan Setup and from the row above it; nothing on the sheet is typed. The columns read across as month, payment, principal, interest, extra payment, total payment, and remaining balance.
The first row makes the mechanics concrete. Payment one is $1,769.79. Interest for the month is the $280,000 balance times the monthly rate of 6.5% divided by twelve, which comes to $1,516.67. Everything left after that interest, $253.12, reduces the principal, so the balance drops to $279,746.88. The extra payment column stays at zero because the sample leaves that input blank, and the total payment column repeats the $1,769.79. That is the entire rule, and it repeats down the sheet.
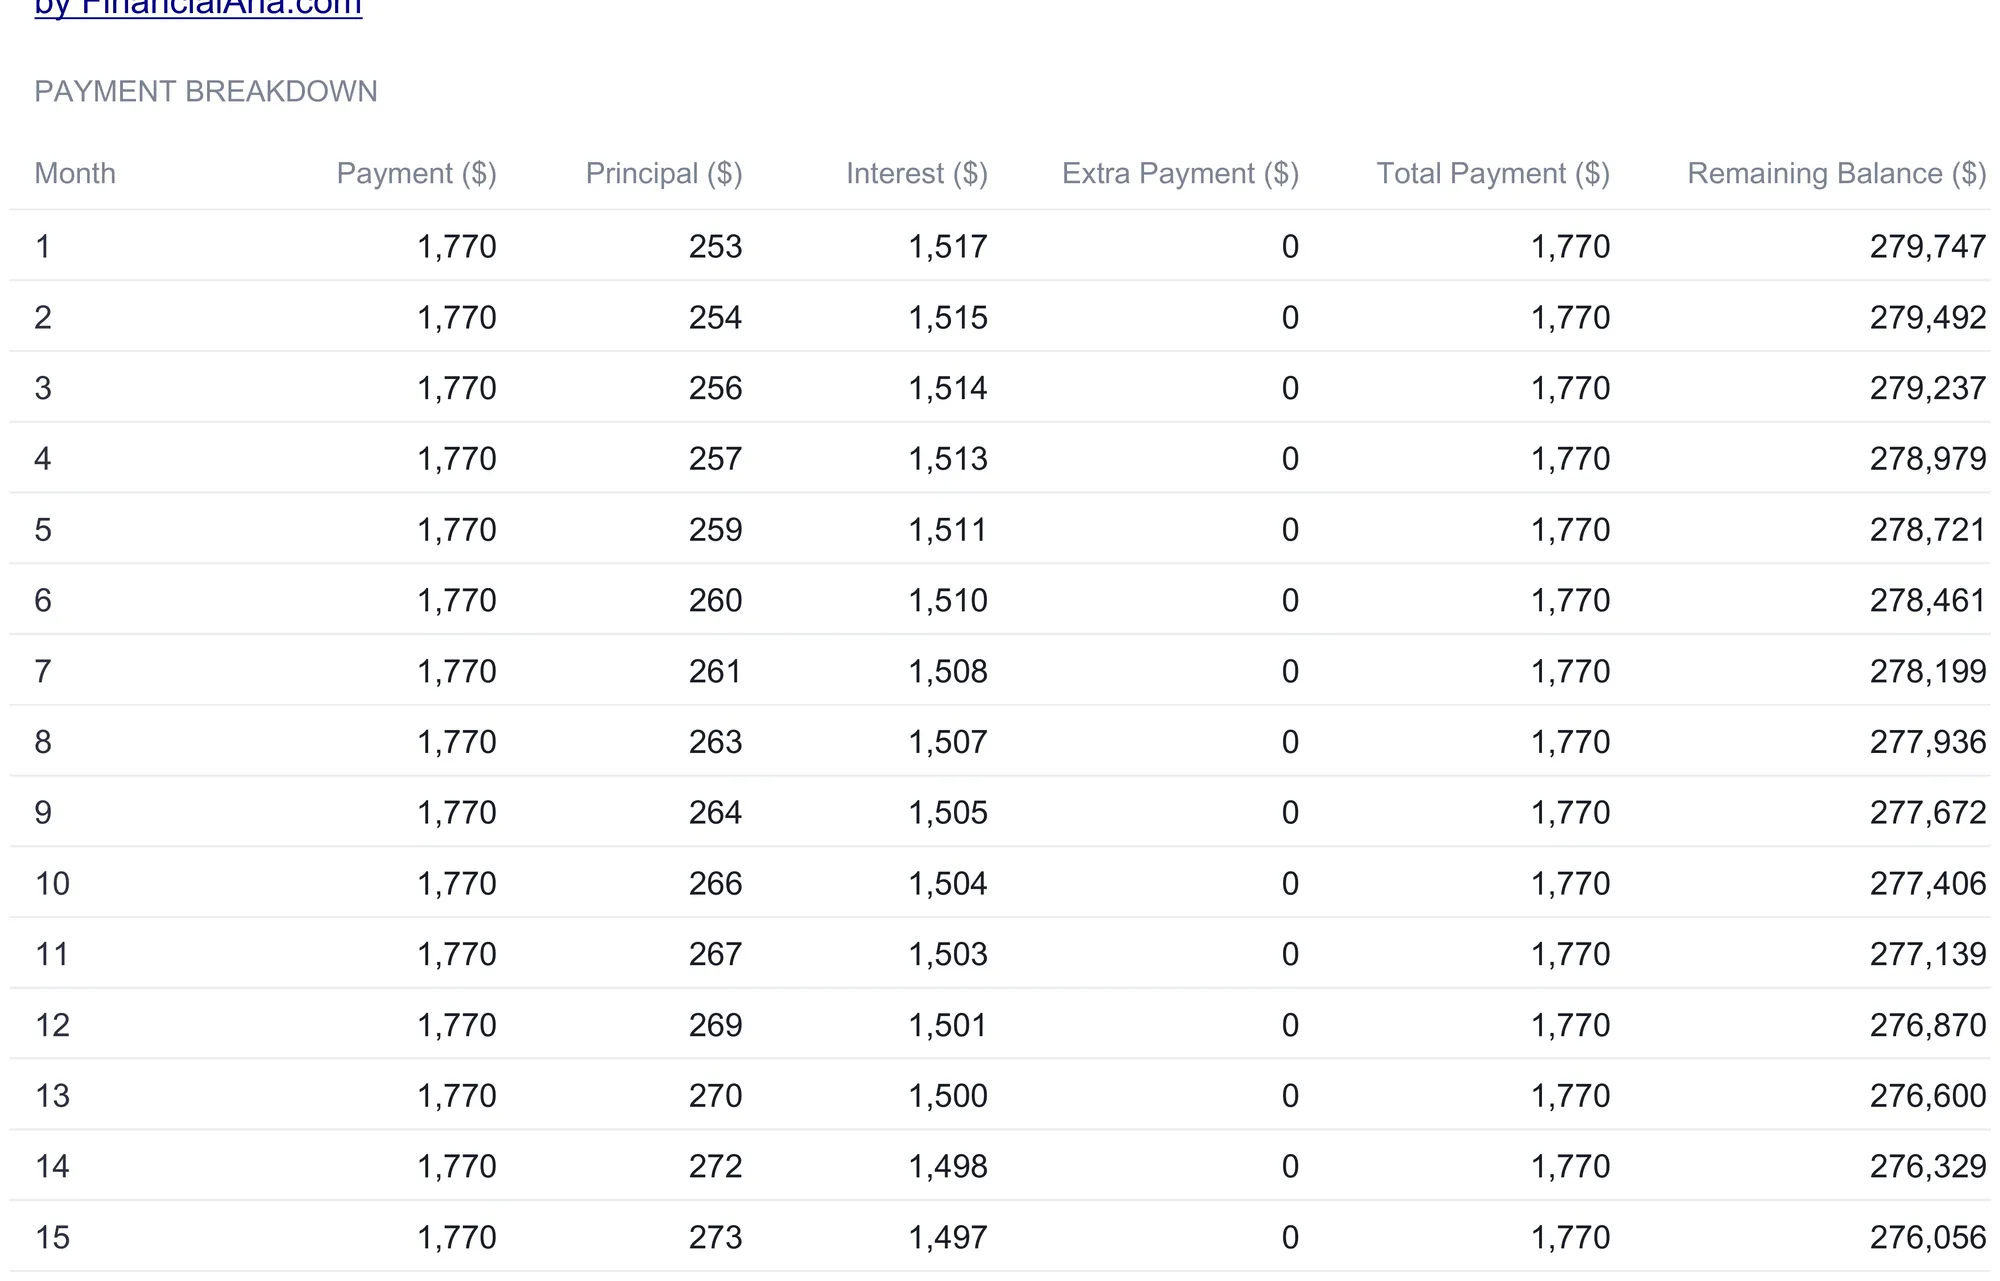
Watch the second row and the pattern reveals itself. With the balance now slightly smaller, month two charges a touch less interest, $1,515.30, so a touch more principal, $254.49, comes off. Nothing about the payment changed. The principal share grew purely because the balance shrank. By month fifteen, principal has climbed to about $273 and interest has slipped to about $1,497, and the balance has worked down to $276,056. Run that for the full 360 rows and the split tips all the way over: in the closing months the payment is almost entirely principal and the interest line is down to a few dollars. The final scheduled payment lands the balance on zero.
Two design details are worth copying into any hand-built version. First, the schedule runs on a fixed grid of up to 360 rows, and each row is gated: a month number only appears if the previous balance is still above zero and the term has not been exceeded. When a loan is paid off, the month number on the rows after it goes blank and their money columns sit at zero, rather than showing negative balances. Second, the extra payment column is wired in even though it is zero here. Entering an amount on Loan Setup would add it to principal every month, and because interest is charged only on what remains, that extra would shorten the schedule and cut the interest total. The next sheet quantifies exactly that effect without touching the schedule itself.
Model the trade-offs: the Extra Payment Analysis sheet
The dated schedule shows what one specific loan does. The Extra Payment Analysis sheet asks the broader question: how does the interest bill move as the extra payment and the interest rate both change? It answers with two grids, both built on Scenario 1’s loan amount and term, and both recompute the moment those inputs change.
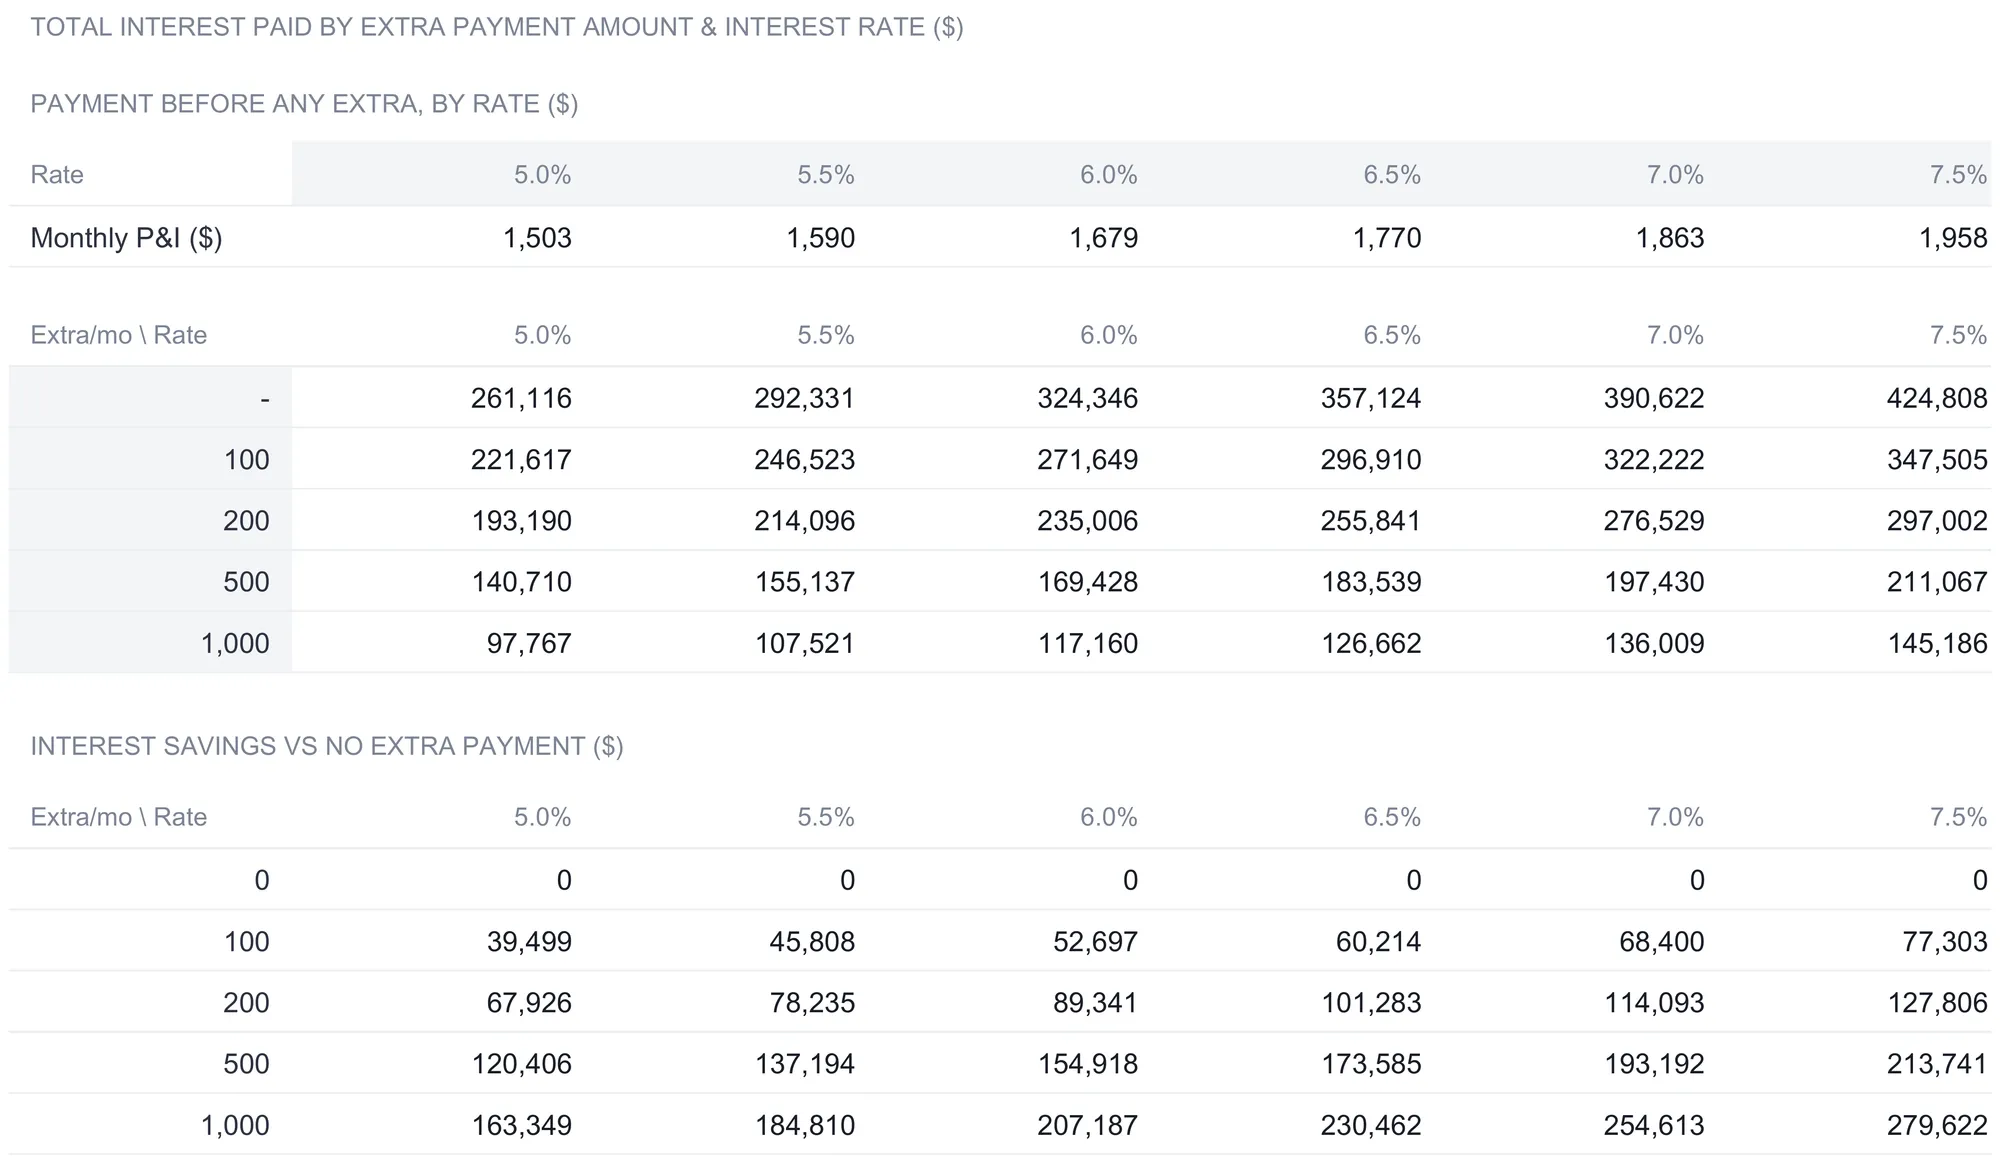
A short row at the top sets the baseline before any extra enters. It lists the plain monthly P&I at each rate, running from $1,503 at 5.0% up to $1,958 at 7.5% on the sample’s $280,000 loan, so you can see what the payment alone would be at each rate. The two grids below share the same axes. Down the side, each row is an extra monthly payment: nothing, then $100, $200, $500, and $1,000. Across the top, each column is an annual rate in half-point steps from 5.0% to 7.5%. Both grids read Scenario 1, so the middle-high column at 6.5% is the sample’s own rate.
The first grid reports total interest paid over the life of the loan. Read down the 6.5% column and the effect of the extra payment is stark: $357,124 with no extra, $296,910 with an extra $100 a month, $255,841 with $200, $183,539 with $500, and $126,662 with $1,000. The second grid restates the same scenarios as interest saved against making no extra payment at the same rate. At 6.5%, an extra $100 a month saves $60,214 in interest, $200 saves $101,283, $500 saves $173,585, and $1,000 saves $230,462. The saving does not scale one for one with the extra dollars, because interest saved compounds on the principal removed early. That non-linearity is a property of the loan math, not something the sheet invents, and reading the two grids side by side is what makes it visible. The extra payment is described here as arithmetic on the inputs, so the grid shows what different amounts would do rather than suggesting any particular one.
Compare the setups side by side: the Scenario Comparison sheet
Three scenarios on the Loan Setup sheet are laid out for entry, mixed in with input helpers and formula rows. The Scenario Comparison sheet restates the same three loans as a clean side-by-side table, pulling every figure live from Loan Setup so the two never drift apart. It is the sheet to read when the question is which setup produces which numbers.
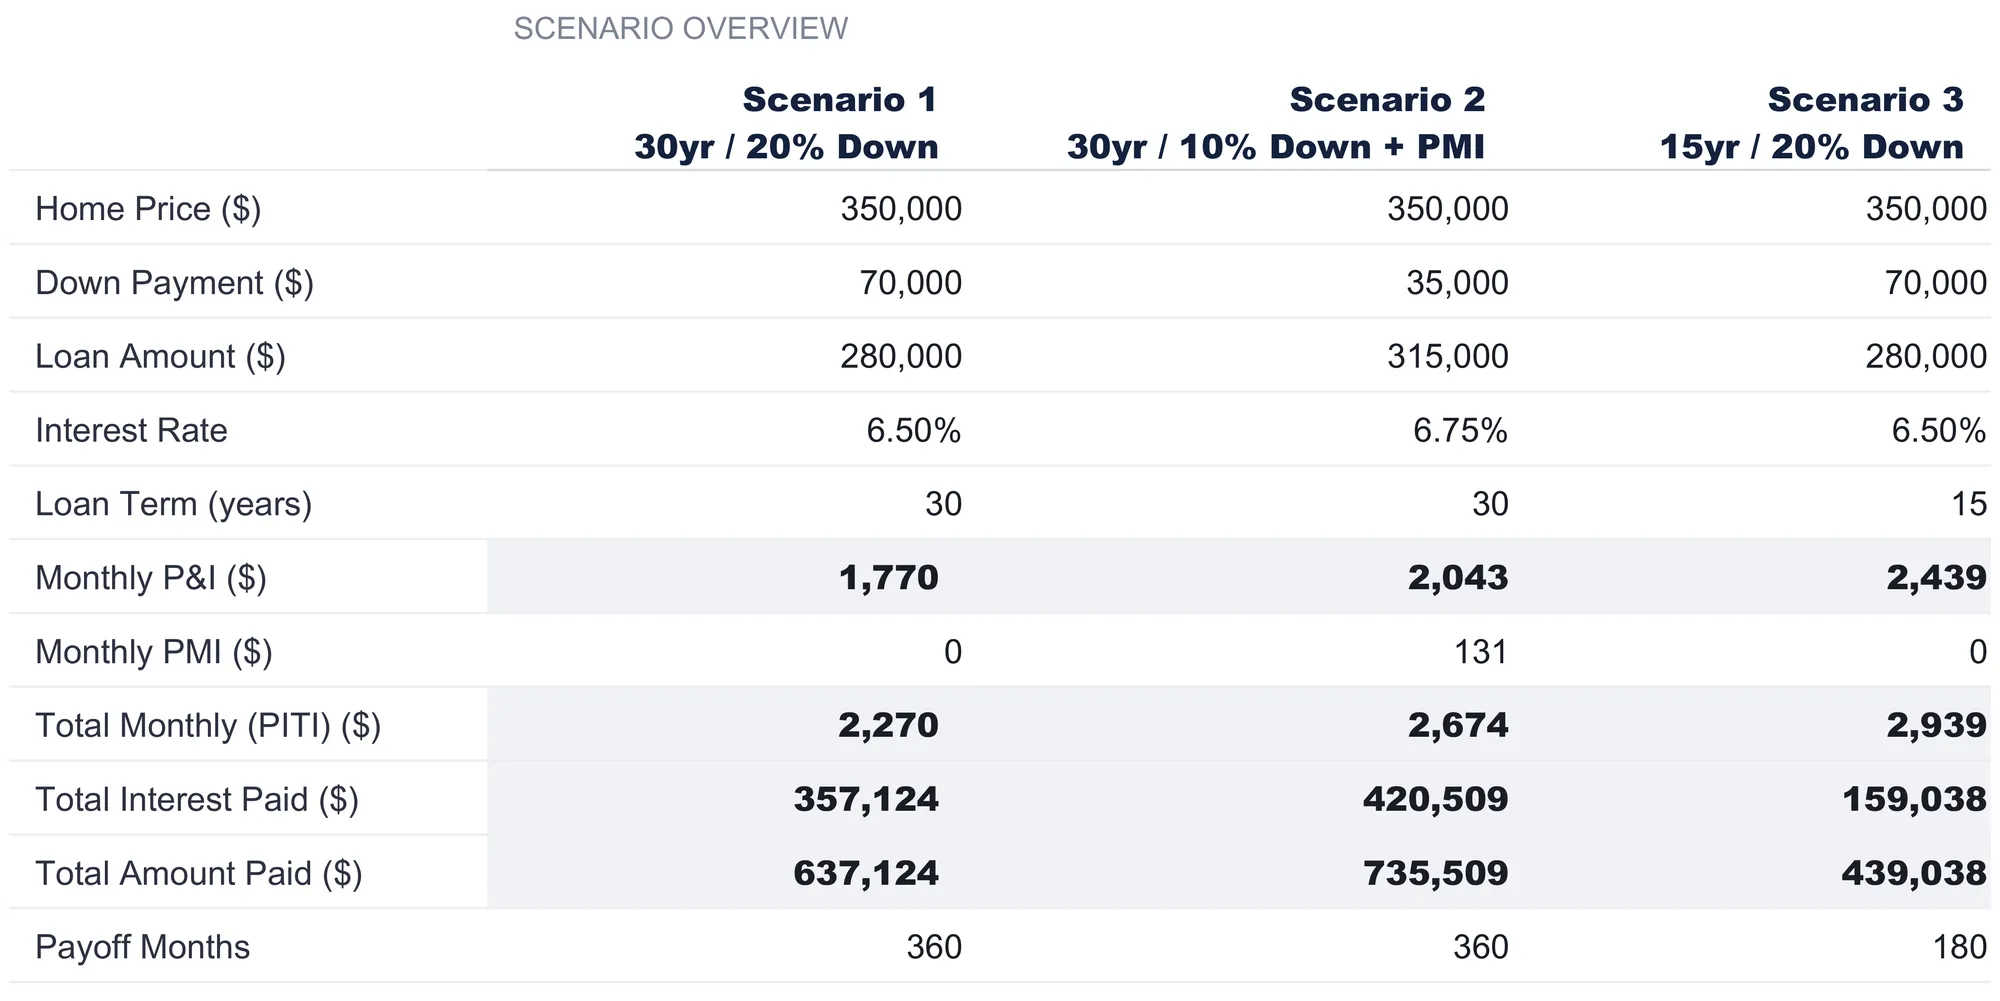
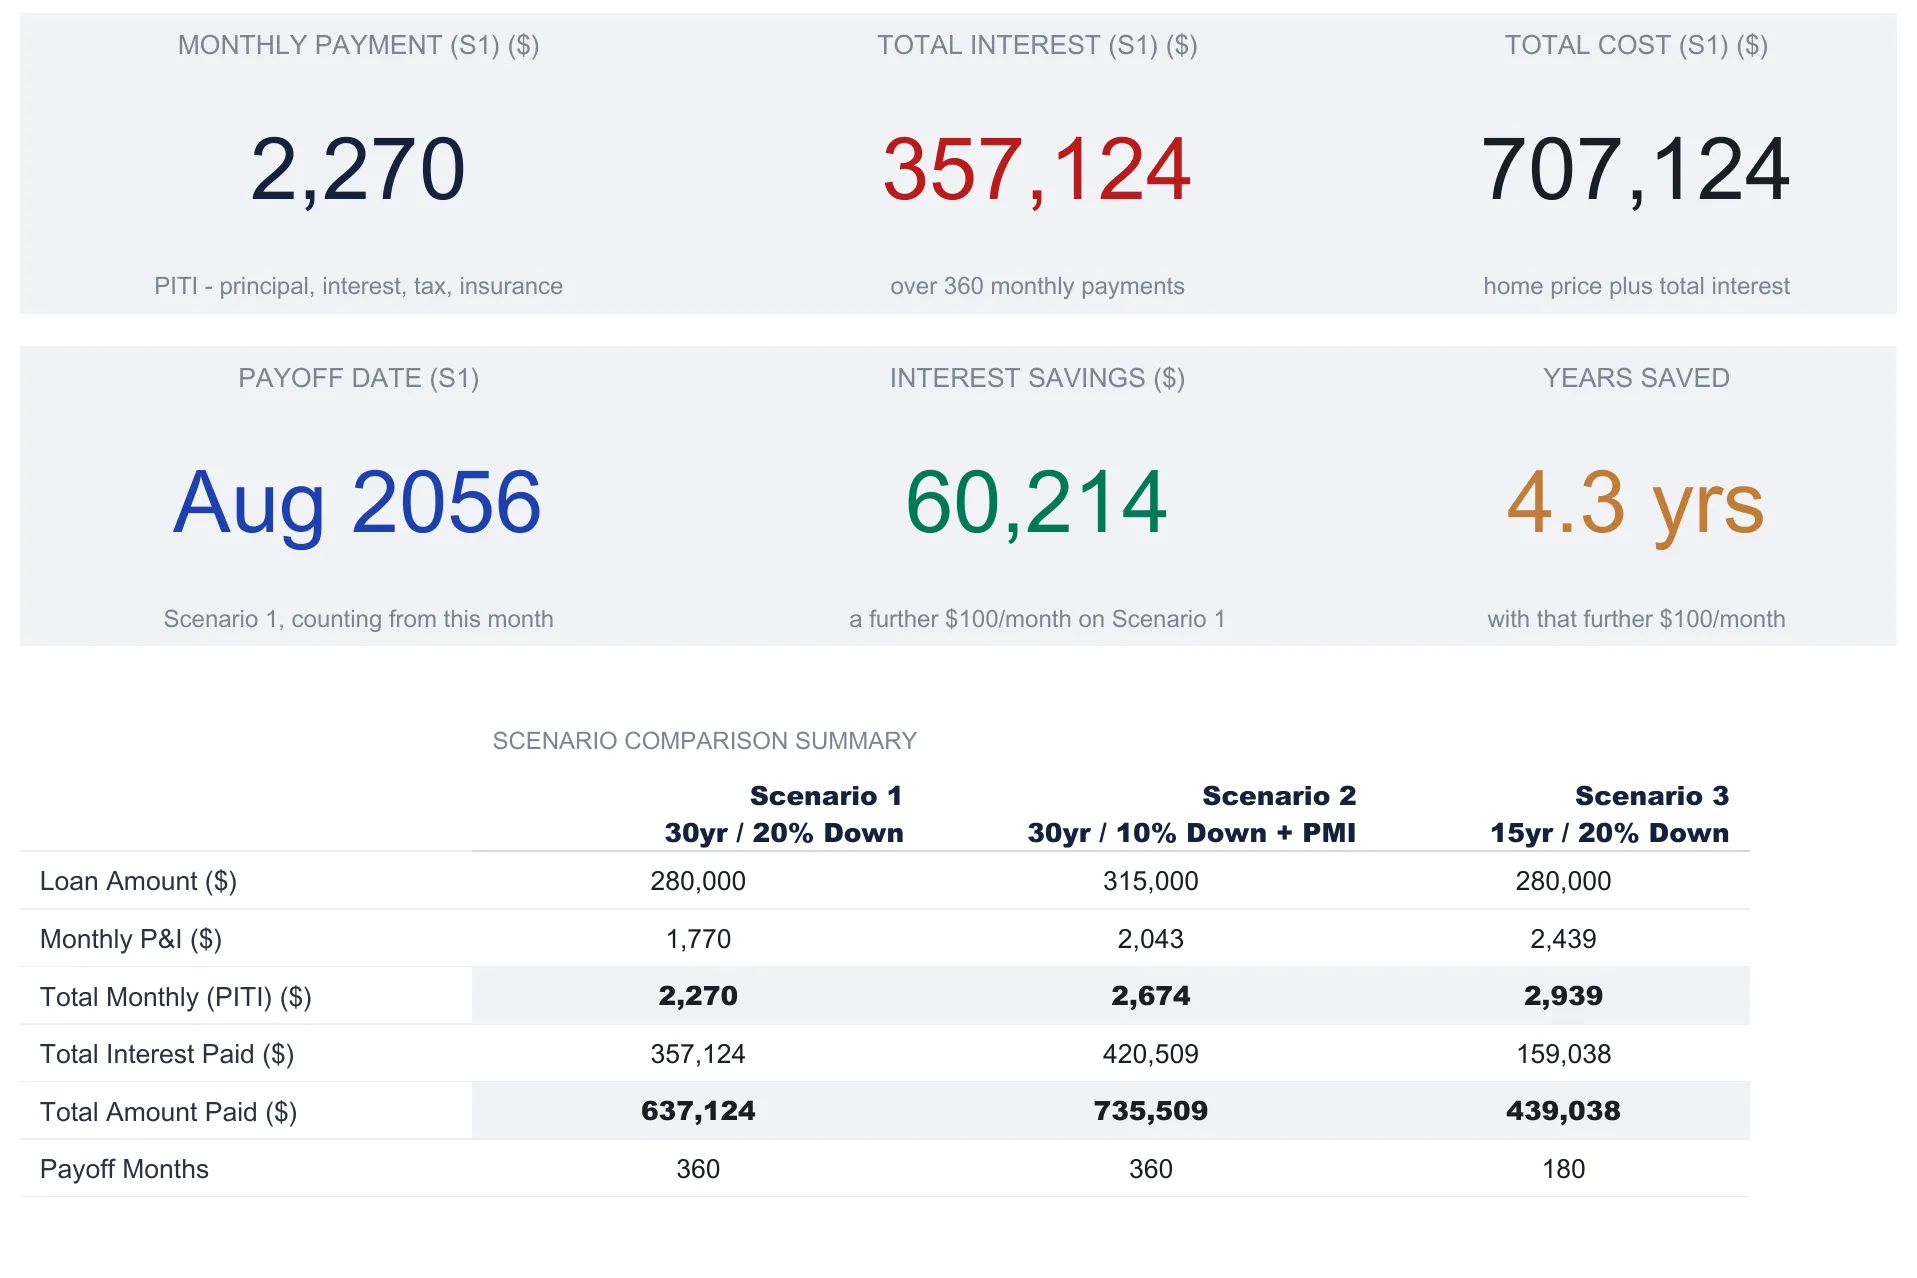
The column headers name each setup automatically, reading “30yr / 20% Down”, “30yr / 10% Down + PMI”, and “15yr / 20% Down”, with the PMI tag appearing on its own whenever a scenario’s down payment falls under 20%. Down the rows, the table stacks home price, down payment, loan amount, interest rate, term, monthly P&I, monthly PMI, total monthly PITI, total interest paid, total amount paid, and payoff months.
The comparisons that fall out are the useful part. Scenario 1 against Scenario 3 is the classic term question on an identical $280,000 balance: the 15-year loan raises the monthly P&I from $1,769.79 to $2,439.10, about $669 more each month, while cutting lifetime interest from $357,124 to $159,038, roughly $198,000 less. Scenario 1 against Scenario 2 is the down-payment question: putting 10% down instead of 20% keeps $35,000 in your pocket up front but borrows $35,000 more, adds a $131.25 monthly PMI charge, and carries a slightly higher rate, so total interest climbs from $357,124 to $420,509. The sheet presents both trade-offs as figures without weighing in on which one fits any particular buyer; the numbers are its arithmetic on the inputs you type.
The refinance question: the Refinance Calculator sheet
The sheets so far all describe a loan you are taking out. The Refinance Calculator sheet handles a loan you already have, comparing it against a new rate and term to find the break-even point on the switch. It stands apart from the three scenarios and uses its own inputs.
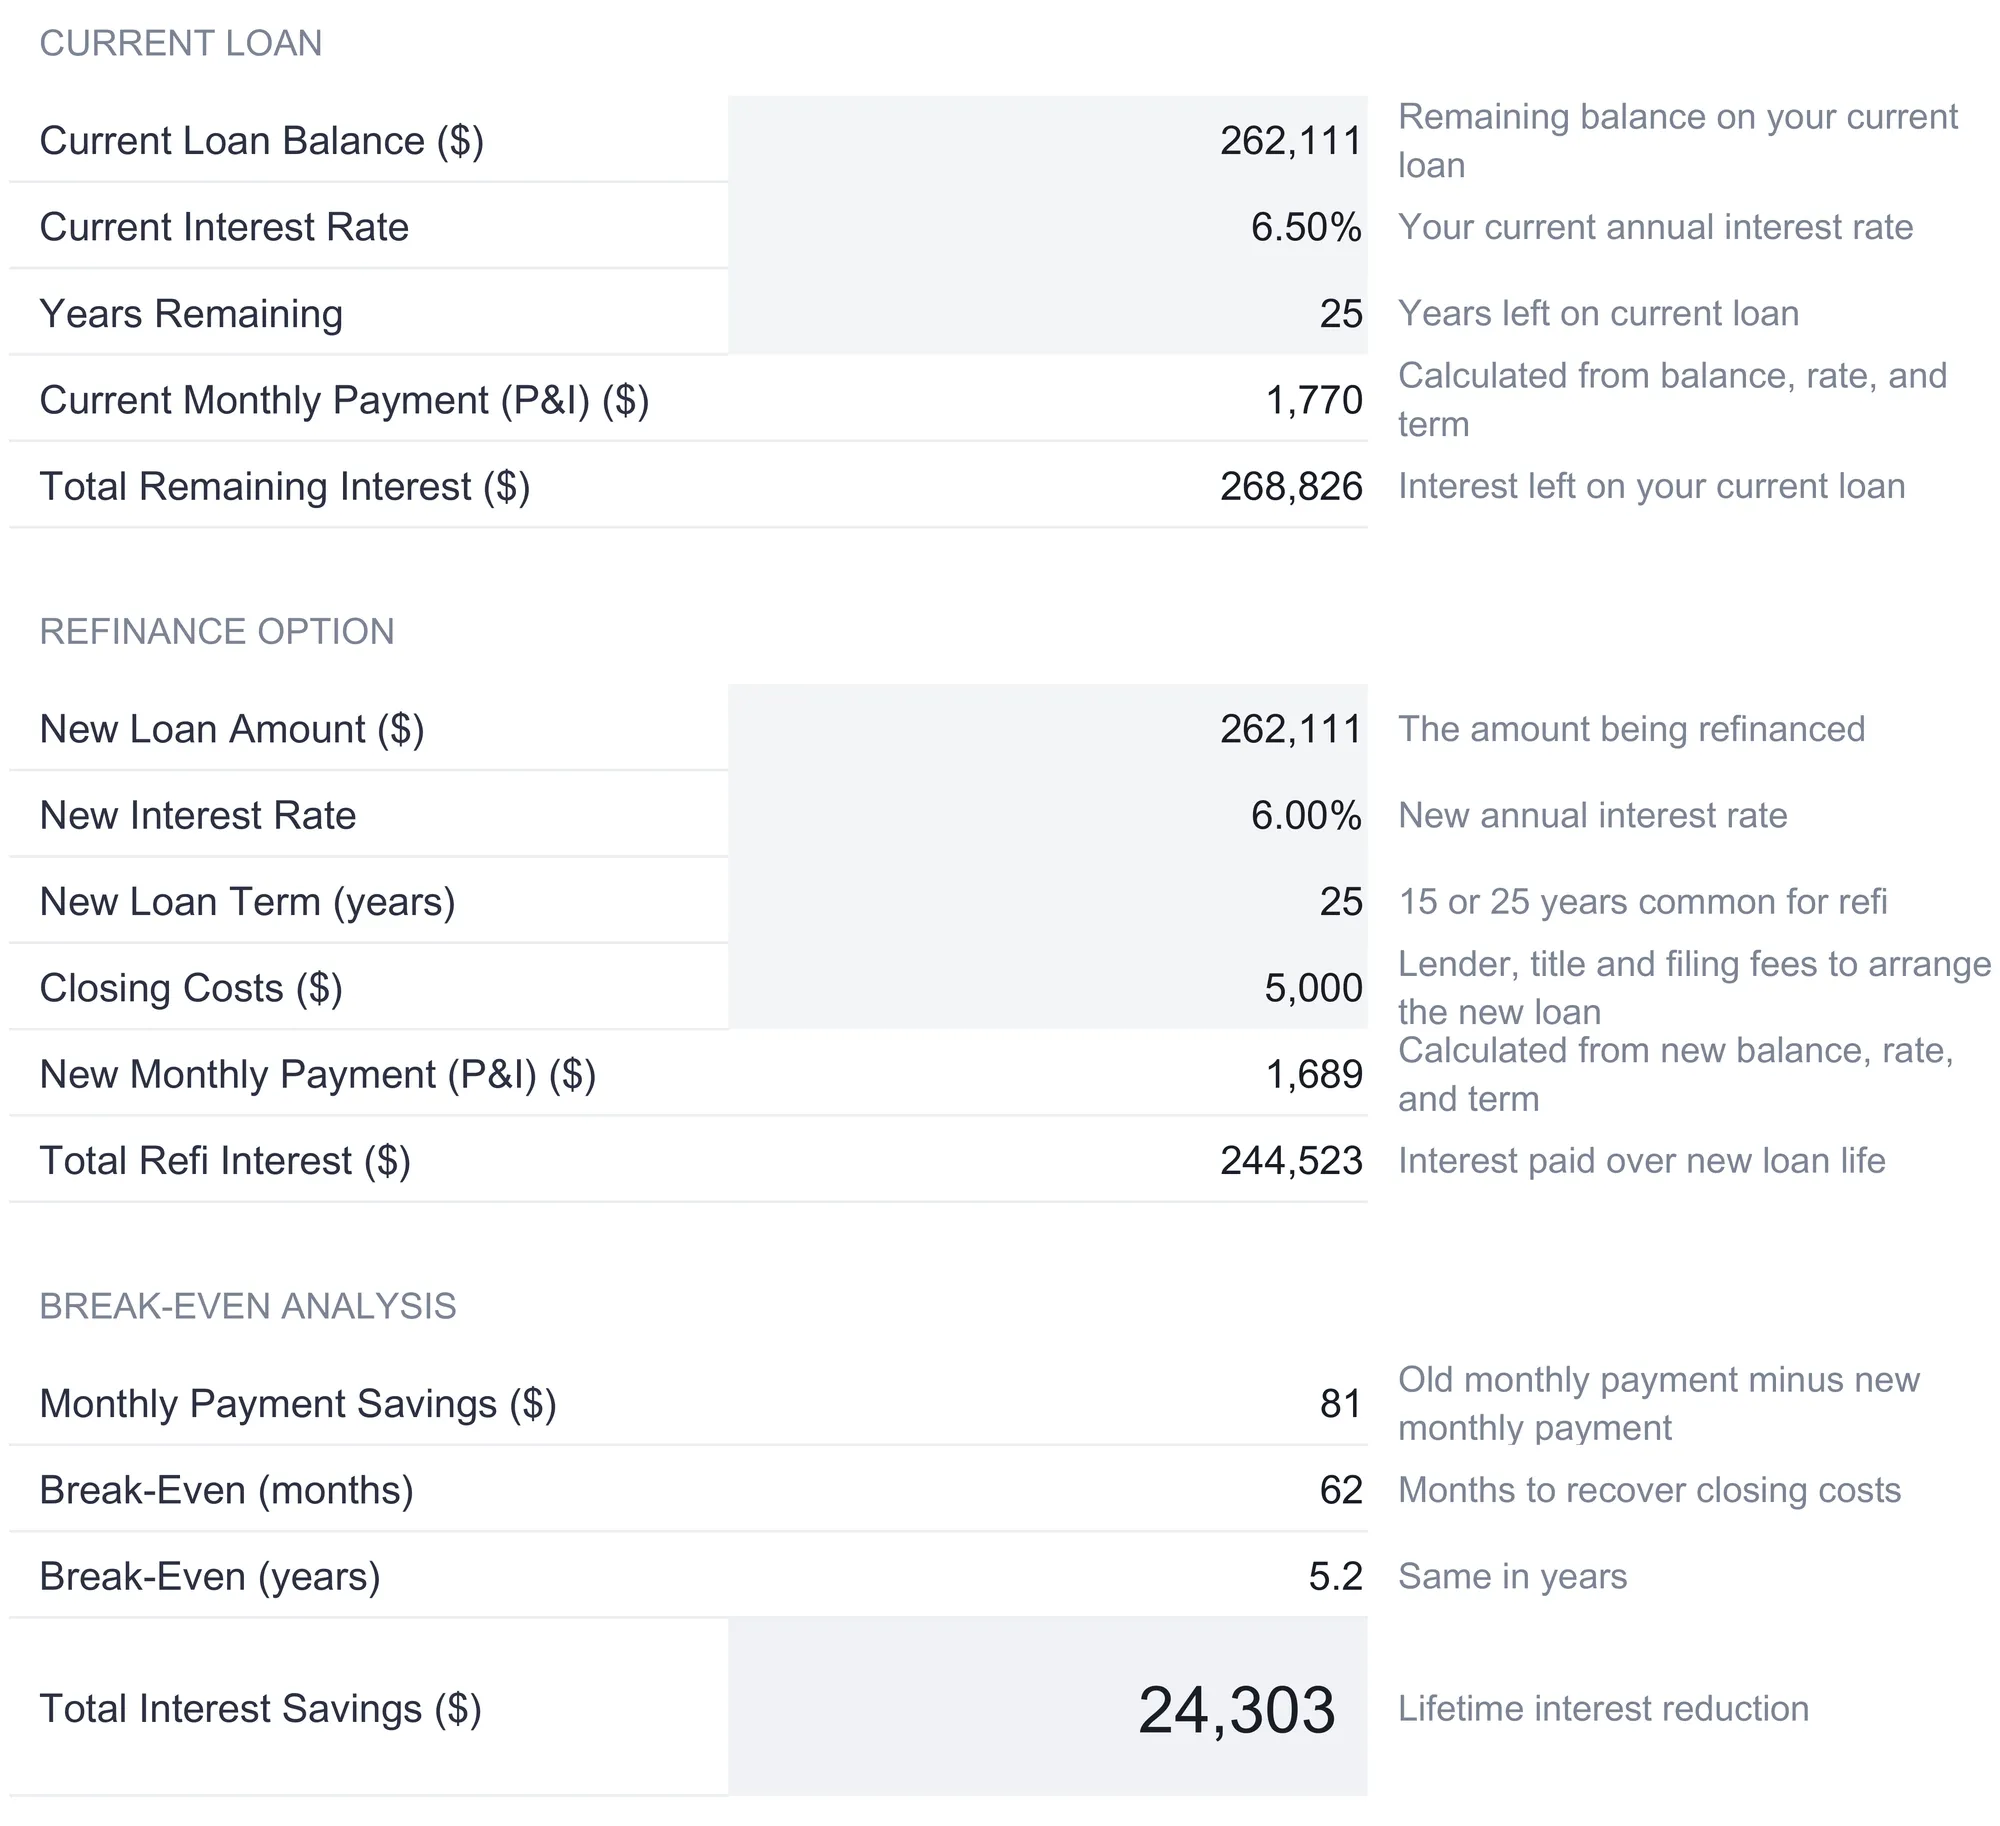
The current-loan block in the sample carries a balance of $262,110.74 at 6.5% with 25 years left, which the sheet reads as a monthly P&I of $1,769.79 and a total remaining interest of $268,826. The refinance-option block below it offers a new loan of the same $262,110.74 at a lower 6.0% rate over a fresh 25-year term, with $5,000 of closing costs. At the new rate, the monthly payment drops to $1,688.78 and the total interest over the new loan falls to $244,523.
The break-even block ties those together. The monthly payment saving is the difference between the two payments, $81.01. The break-even in months is the closing costs divided by that monthly saving, which the sheet rounds to 62 months, or about 5.2 years. The total interest saving over the life of the loan is the old remaining interest minus the new, $24,303. The sheet’s own notes point out the qualifications a break-even figure hides: that a lower rate on a longer term can still raise total interest, that rolling closing costs into the loan changes the math, and that PMI can reapply if the new loan-to-value ratio climbs above 80%. Those closing costs are the crux of the calculation, and as the CFPB notes, a refinance advertised with no closing costs generally recovers them another way, “charging you a higher interest rate and giving you a credit to cover the cost” or adding them to the balance. The sheet reports the break-even as arithmetic and leaves the decision to the reader.
The dashboard: the combined verdict
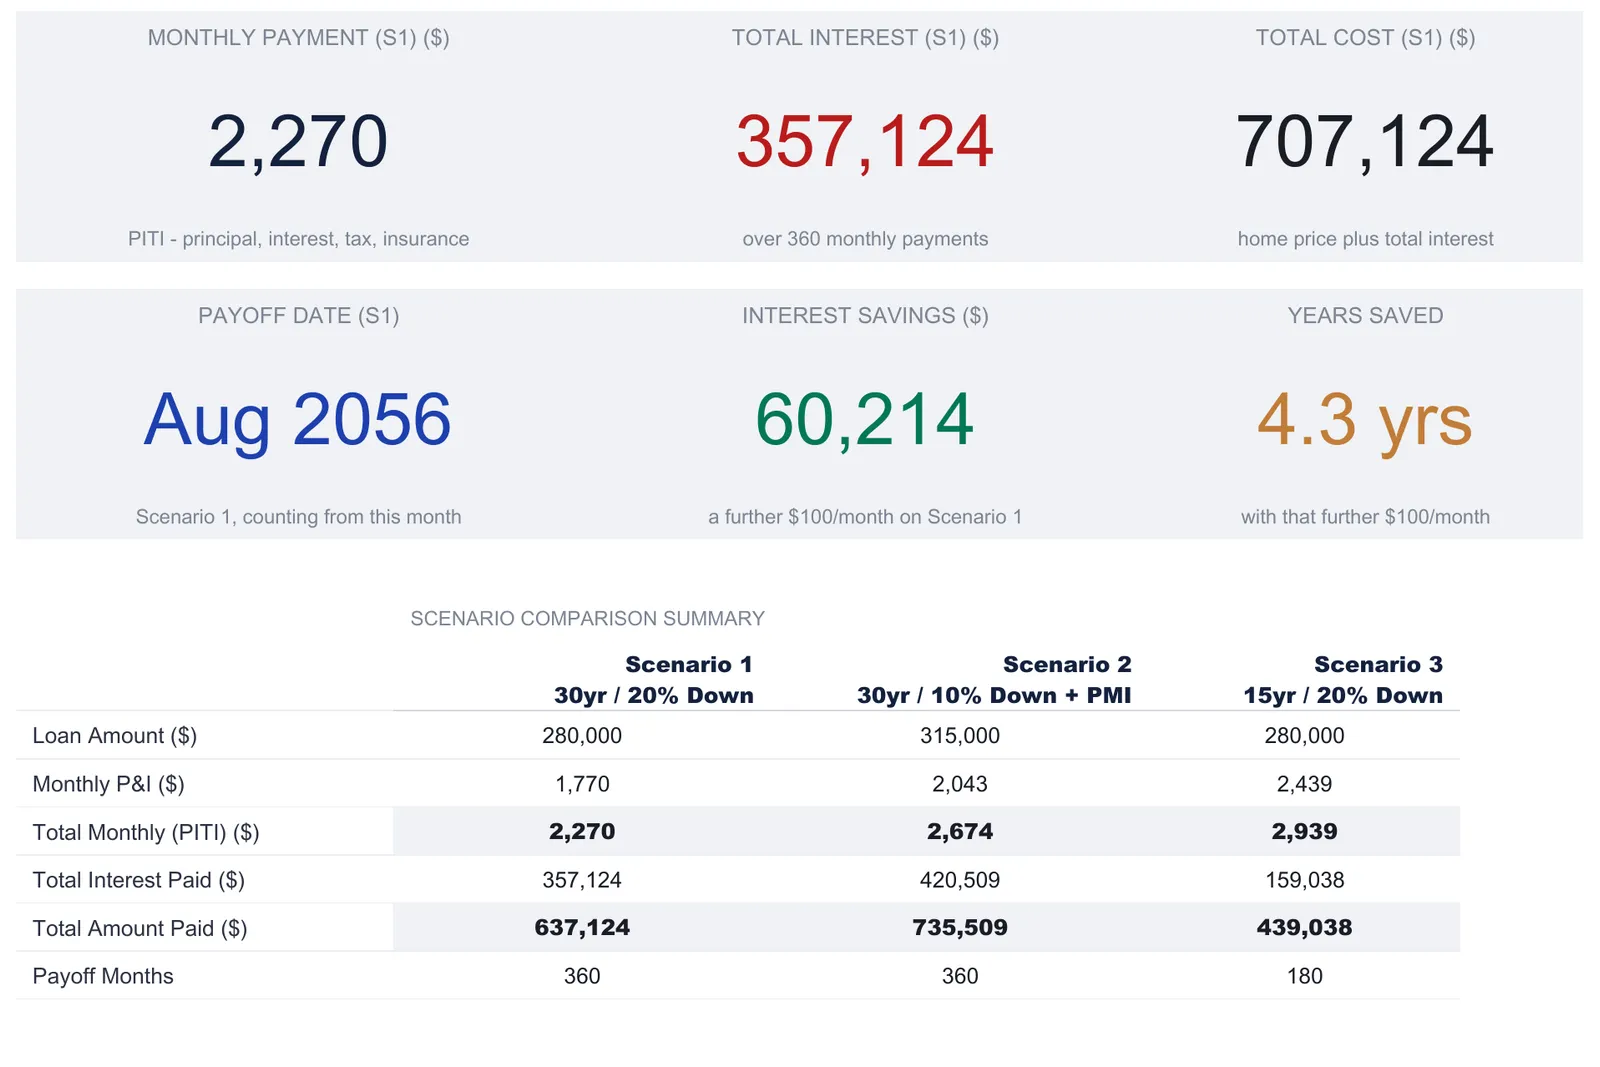
The dashboard sits on top and reduces Scenario 1 to six tiles and two charts. The tiles, and the comparison summary sitting under them, are what the cover image above shows. The tiles read a monthly payment of $2,270, which is the rounded PITI total; total interest of $357,124 over 360 payments; and a total cost of $707,124, which is the home price plus that interest rather than the loan-plus-interest total. Below them, a payoff date tile reads thirty years out, Aug 2056 in the sample render, because it counts 360 months forward from the current month and so moves with the calendar.
The last two tiles preview the extra-payment idea from the analysis sheet. The interest savings tile reads $60,214, and the years saved tile reads 4.3, both measured against a hypothetical of adding a further $100 a month to Scenario 1’s payment. Those two figures match the 6.5% column of the Extra Payment Analysis grid exactly, which is the cross-check that the dashboard and the grid are reading the same loan. Under the tiles, a scenario comparison summary restates the three loans, and two charts plot Scenario 1’s loan balance falling over time and, year by year, its cumulative principal against its cumulative interest. Because $280,000 at 6.5% over 30 years costs $357,124 in interest, the cumulative interest series stays above the cumulative principal one for the whole term.
PITI, PMI, and amortization in plain terms
Three pieces of mortgage vocabulary carry most of the weight here, and each is simpler than it sounds.
PITI is just the sum of the four parts of a monthly payment: principal, interest, taxes, and insurance. The calculator builds it from the bottom up rather than quoting it as one number, so the $2,269.79 Scenario 1 total is visibly $1,769.79 of P&I, $350 of tax, and $150 of insurance.
PMI, private mortgage insurance, is the extra charge that appears when the down payment is under 20%. It protects the lender rather than the borrower, and in the sample it is what separates Scenario 2’s $131.25 monthly charge from the $0 that Scenarios 1 and 3 carry with their larger down payments.
Amortization is the arrangement that lets a fixed payment cover a shrinking interest charge and a growing principal repayment at once, so the loan lands exactly on zero at the end of its term. The Amortization Schedule sheet is that arrangement written out in full, and it is why an extra payment early does so much: it removes principal now and all the future interest that principal would have generated.
Excel or Google Sheets for a mortgage calculator
The template is an .xlsx file built on ordinary formulas: the payment formula plus IF, MIN, ROUND, and a running-balance reference to the row above, with no macros and no add-ons. It behaves identically in Microsoft Excel and in Google Sheets after an upload. Change any input on Loan Setup and the amortization schedule, the scenario comparison, the extra-payment grids, and the dashboard all recalculate at once. Excel suits anyone who keeps a local file; Google Sheets suits anyone who wants the same workbook open on a phone while walking a property. The structure described here, one setup sheet feeding a schedule, a comparison, an extra-payment model, a refinance break-even, and a dashboard, is buildable in either.
Which mortgage template fits
- Home Mortgage Calculator Ultimate Spreadsheet Template ($29) is the workbook this walkthrough follows: three loan scenarios, the full PITI build, an amortization schedule, the extra-payment grids, a refinance break-even, and the dashboard, ready for Excel and Google Sheets.
- The tier family starts smaller. The free Home Mortgage Calculator covers a single payment calculation, and the Home Mortgage Calculator Essentials ($19) adds a dashboard, the full PITI breakdown, and a dated amortization schedule for one loan with an extra monthly payment on it. The Ultimate version is the one that carries the three scenarios, the refinance sheet, and the extra-payment grids.
- For a single loan viewed as a repayment table rather than a home-buying comparison, the Loan Amortization Ultimate Spreadsheet Template ($29) anchors on the month-by-month schedule itself and carries two loans at once, a mortgage and a car loan in its sample.
Related
- How to Analyze a Mortgage in a Spreadsheet - the wider set of numbers behind a home loan, from closing costs to total cost of ownership
- How to Build a Loan Amortization Schedule in a Spreadsheet - the interest-versus-principal split written out row by row, for one or two loans
- Loan Payment Calculator: Understanding Your Monthly Payment - the payment formula on its own, and where a single payment goes
- Mortgage Refinance Calculator: When Does Refinancing Make Sense? - the refinance break-even question on its own
- Mortgage Payoff Calculator: Extra Payments Impact - the extra-payment question isolated to a single mortgage
Frequently asked questions
How is a monthly mortgage payment calculated in a spreadsheet?
The principal-and-interest part comes from the standard payment formula. A spreadsheet can write it as =PMT(rate/12, months, -loan), and the Ultimate workbook writes the closed-form version of the same formula, which lands on the same figure. In the sample file a $280,000 loan at 6.5% over 360 months gives $1,769.79. The full monthly figure, PITI, then adds one-twelfth of the annual property tax and insurance, plus monthly PMI when it applies, so the sample's $1,769.79 becomes a $2,269.79 total once $350 of tax and $150 of insurance are included.
What does PITI mean?
PITI stands for principal, interest, taxes, and insurance, the four parts of a typical monthly housing payment. Principal and interest repay the loan itself; taxes and insurance are the property tax and homeowners insurance a lender often collects alongside the loan. The calculator adds private mortgage insurance (PMI) on top when the down payment is under 20%, which it labels as the full Total Monthly (PITI + PMI) figure.
When does PMI show up in the calculator?
The sheet applies PMI only when the down payment is below 20% of the home price, which mirrors how conventional loans work. Scenario 1 in the sample puts 20% down, so its monthly PMI is $0. Scenario 2 puts 10% down on the same $350,000 home, so the sheet charges $131.25 a month of PMI, computed as the annual PMI rate times the loan amount, divided by twelve.
How does the refinance break-even calculation work?
The Refinance Calculator sheet compares a current loan against a new rate and term, then divides the closing costs by the monthly payment saving to find how many months it takes to recover those costs. In the sample, a refinance that cuts the payment by $81.01 a month against $5,000 of closing costs breaks even at 62 months, about 5.2 years. The sheet reports it as arithmetic on the inputs, not as a recommendation to refinance.
Can one spreadsheet compare a 15-year and a 30-year mortgage?
Yes. The Loan Setup sheet holds three scenarios side by side, and the sample uses the difference directly: Scenario 1 is a 30-year loan and Scenario 3 is the same $280,000 balance over 15 years. The 15-year setup raises the monthly principal and interest from $1,769.79 to $2,439.10 while cutting total interest from $357,124 to $159,038. Both figures sit in the same table so the trade is visible at once.
Sources
- What is private mortgage insurance? - Consumer Financial Protection Bureau
- Is there such a thing as a no-cost or no-closing cost loan or refinancing? - Consumer Financial Protection Bureau
About this article
Every figure, sheet name, column, and formula rechecked on 2026-09-10 against the shipped Home Mortgage Calculator Ultimate workbook (Dashboard, Loan Setup, Amortization Schedule, Scenario Comparison, Extra Payment Analysis, Refinance Calculator, How to Use), with the free and Essentials mortgage workbooks read for the tier comparison. CFPB definitions of private mortgage insurance and of refinancing closing costs checked against the live Consumer Financial Protection Bureau pages at writing time. Last reviewed September 2026.