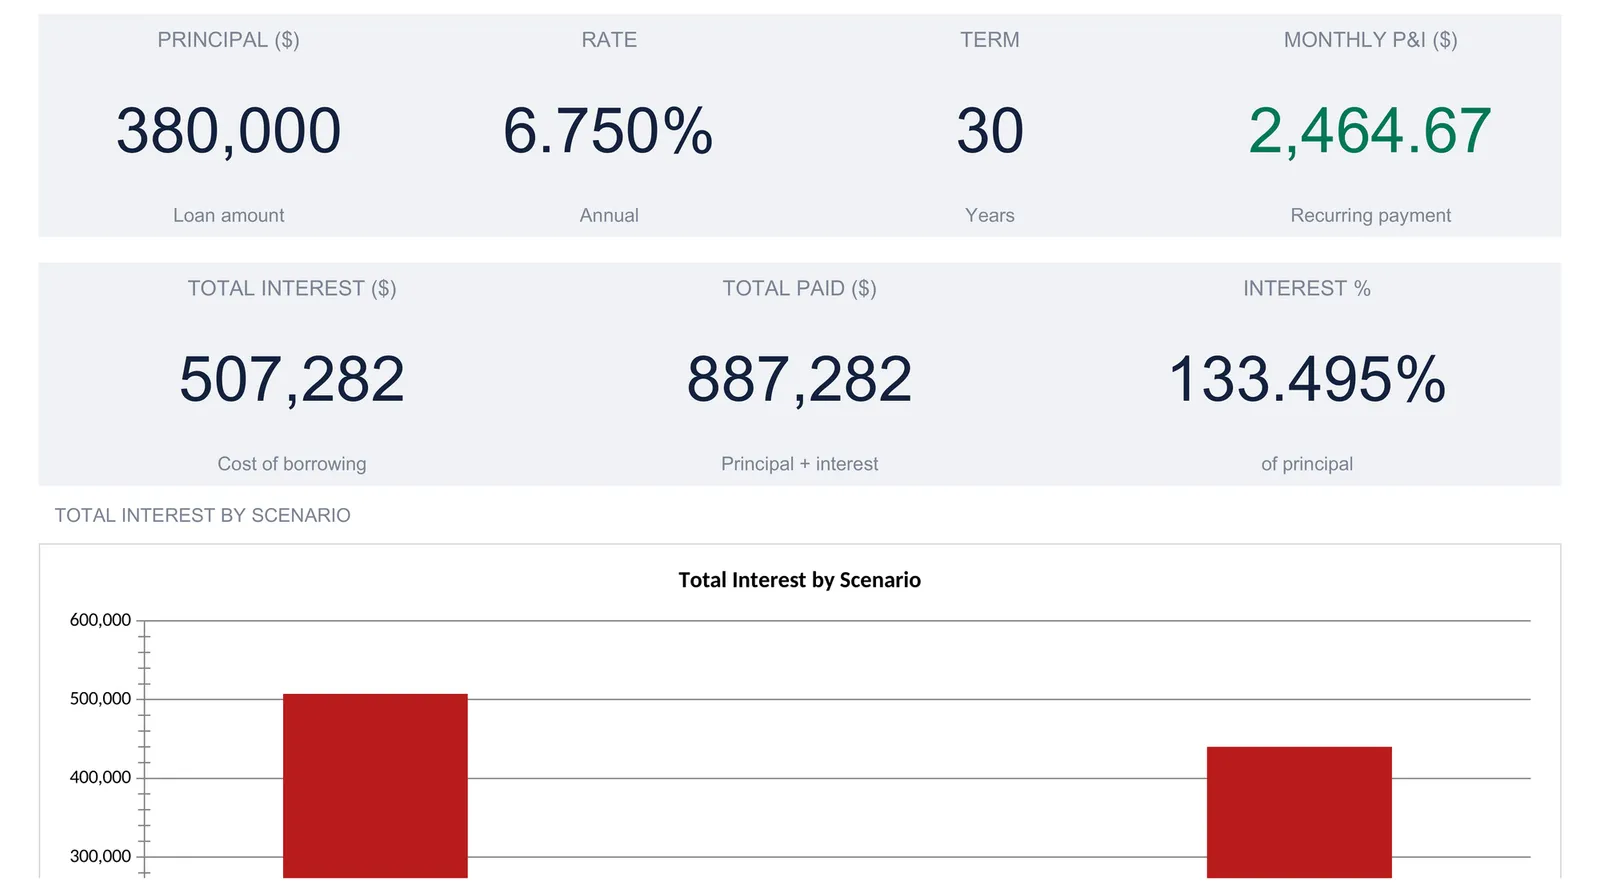
A mortgage analysis spreadsheet takes three inputs, the loan amount, the rate, and the term, and derives everything else: the monthly payment, a month-by-month amortization schedule, the total interest over the life of the loan, and a side-by-side comparison of alternative loan structures. This walkthrough follows the full model using a worked example, a $380,000 loan at 6.75% over 30 years that carries a $2,464.67 monthly payment and $507,282 in total interest. Our Mortgage Analysis Spreadsheet Template ($29) ships the same structure ready-made for Excel and Google Sheets.
A mortgage is the largest fixed-rate loan most households ever sign, and almost none of its real shape shows up on the monthly statement. The statement reports one number, the payment due. It does not show how much of that payment is interest, how slowly the balance actually falls, or what the loan costs in total once the last payment clears. Those answers are not hidden, they are just spread across 360 months of arithmetic, and a spreadsheet is built for exactly that kind of arithmetic.
The whole analysis comes down to three inputs and what they generate. Enter the loan amount, the interest rate, and the term, and a well-built model derives the monthly payment, a full month-by-month amortization schedule, the total interest over the life of the loan, and a comparison of one loan structure against another. The examples below come from our Mortgage Analysis Spreadsheet Template ($29), which ships the whole thing ready-made for Excel and Google Sheets. The layout is reproducible by hand if you would rather build your own.
The appeal of doing this in a spreadsheet rather than an online calculator is that every step is visible and editable. An online mortgage calculator returns a payment and, sometimes, a total; a spreadsheet shows the formula behind that payment, the full schedule underneath it, and the exact effect of nudging any input. Change the rate by an eighth of a point and the whole schedule and every headline figure update in front of you, so the model becomes a place to ask questions rather than a black box that answers one. That transparency is the reason the same structure has been rebuilt by hand in Excel for decades, and it is what the sections below trace through, sheet by sheet, in the order the workbook is meant to be used.
What a mortgage analysis spreadsheet has to hold
A mortgage model is small on the input side and large on the output side. There are only three numbers to type, and everything else is computed from them. The workbook gives each job its own sheet:
- Settings. The three loan inputs: principal, annual rate, and term in years, plus the asset name and a currency label.
- Amortization. The month-by-month schedule that splits every payment into interest and principal and tracks the falling balance.
- Scenarios. Three loan structures side by side, each with its own principal, rate, and term, compared on payment and total interest.
- Summary. The headline outputs on one screen: payment, total interest, total paid, interest as a share of principal, and a chart comparing the scenarios.
- How to Use. A reference sheet that lists what each tab does and states the formulas in plain language.
The order those sheets are worked in runs from input to output: set the loan terms, read the schedule they produce, compare that loan against alternatives, then take the summary. The sections below follow that path.
Start with the loan terms: the Settings sheet
Everything downstream reads from three cells, so they come first. On the Settings sheet the sample loan is a home called “Birch Hollow Residence” with these inputs:
- Principal: 380,000. The amount borrowed, which is the purchase price minus the down payment, not the price of the house.
- Interest rate: 6.750%. The annual rate. The workbook divides it by 12 to get the monthly rate it charges on the balance each month.
- Term (years): 30. The length of the loan. Multiplied by 12, this sets the 360 rows the schedule fills.
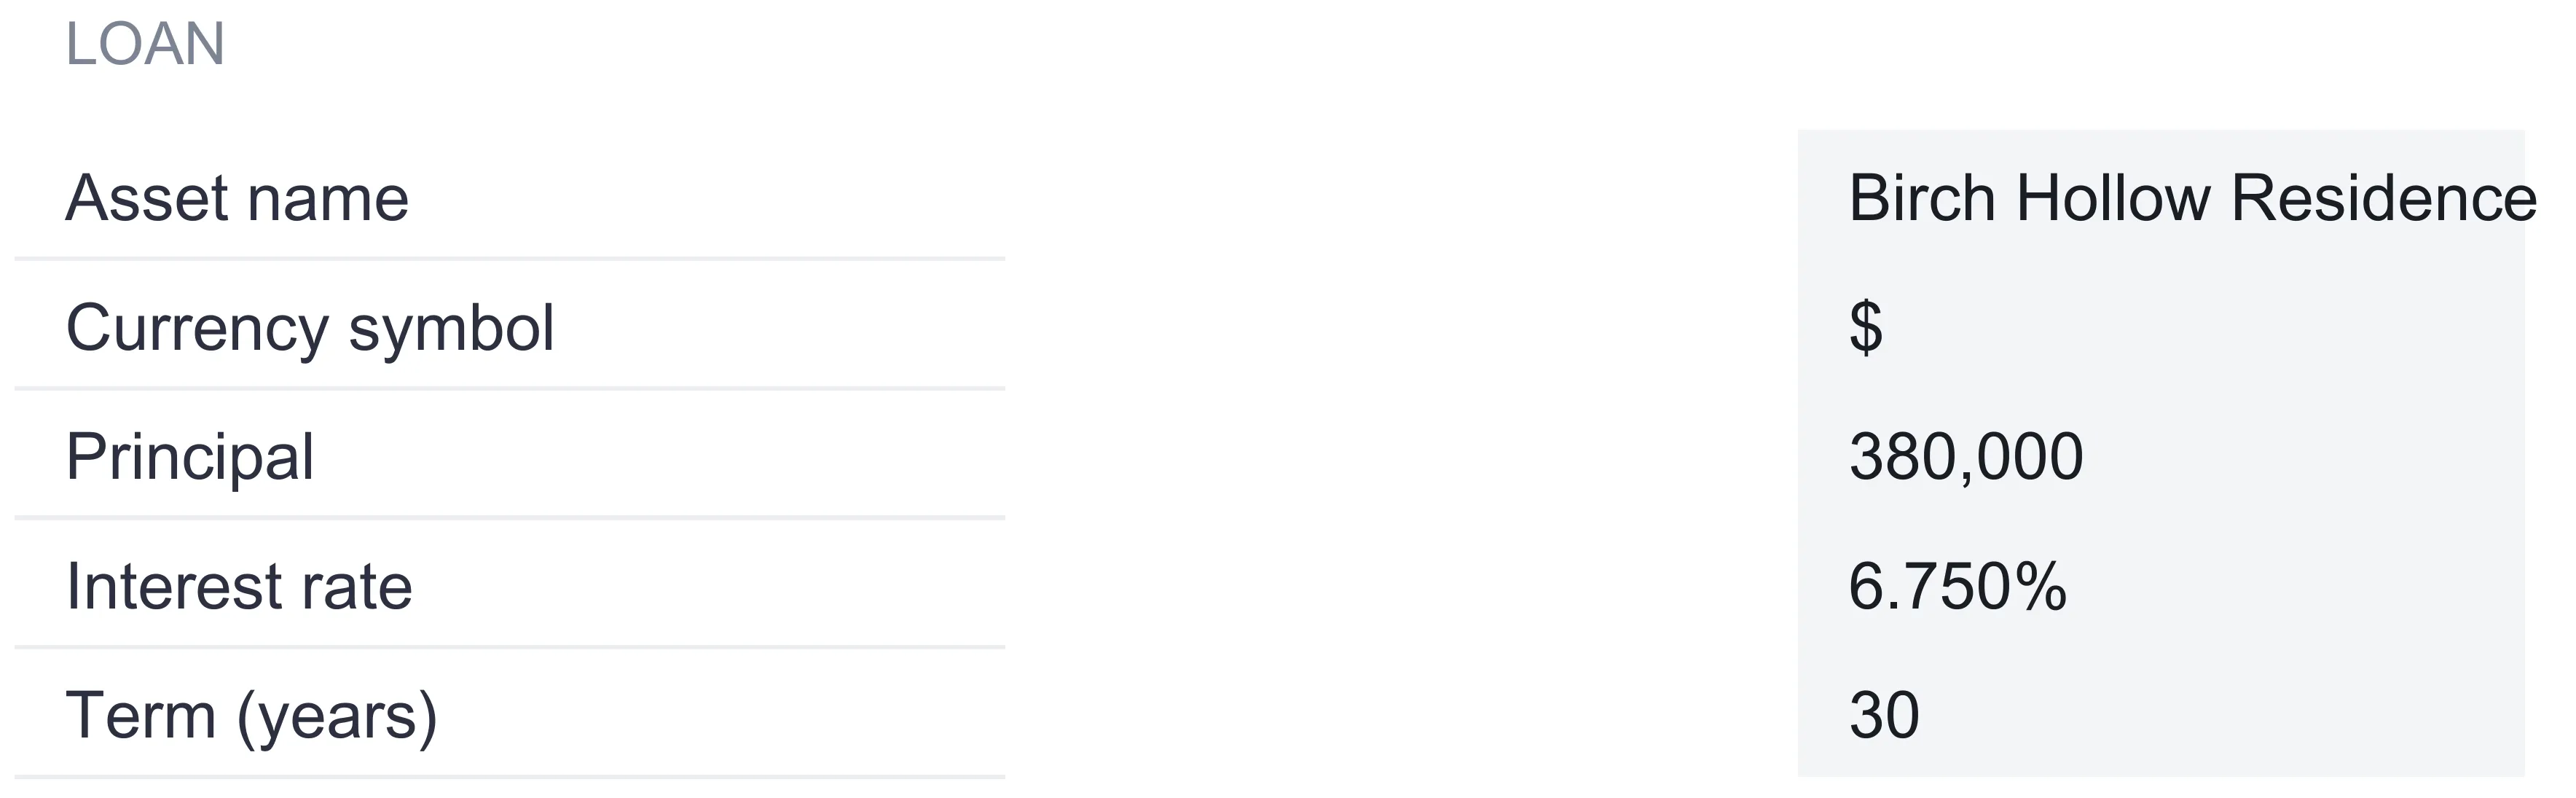
Two smaller fields sit alongside the loan inputs. The asset name is a label that repeats across the top of the Summary, Scenarios, Amortization and Settings sheets, so a file stays identifiable once several are saved side by side. The currency symbol is a dropdown of 35 options, and changing it relabels every money heading across the workbook at once, from the Amortization column titles to the Summary tiles. It relabels only, with no conversion of the numbers, so a payment of 2,464.67 reads the same whether the symbol says a dollar or a euro.
From those three inputs the model computes the recurring monthly payment, the figure lenders call P&I, for principal and interest. The formula is the standard fixed-rate mortgage calculation: the principal times the monthly rate, divided by one minus one plus the monthly rate raised to the negative number of months. In the sample that resolves to $2,464.67. The Consumer Financial Protection Bureau describes the same mechanism in plain terms, noting that a fixed-rate mortgage is set up so that keeping the loan for its full term and making every payment pays the balance off precisely at the end. The payment lands in a single cell on the Amortization sheet, and every figure on the Summary reads from that one cell, so nothing is ever entered twice.
The formula also has two guard rails worth knowing about. At a 0% rate there is no interest to divide by, so the model simply spreads the principal evenly across the months. With a term of zero there is no loan and the payment is zero. Neither case matters for a normal mortgage, but they keep the sheet from breaking if a scenario is set to an edge value.
Read the schedule: the Amortization sheet
The payment is one number. The amortization schedule is what that number does over time, and it is where a mortgage stops being abstract. Below the monthly P&I figure the sheet lays out one row per month, each with four columns: the month number, the interest charged, the principal repaid, and the balance remaining.
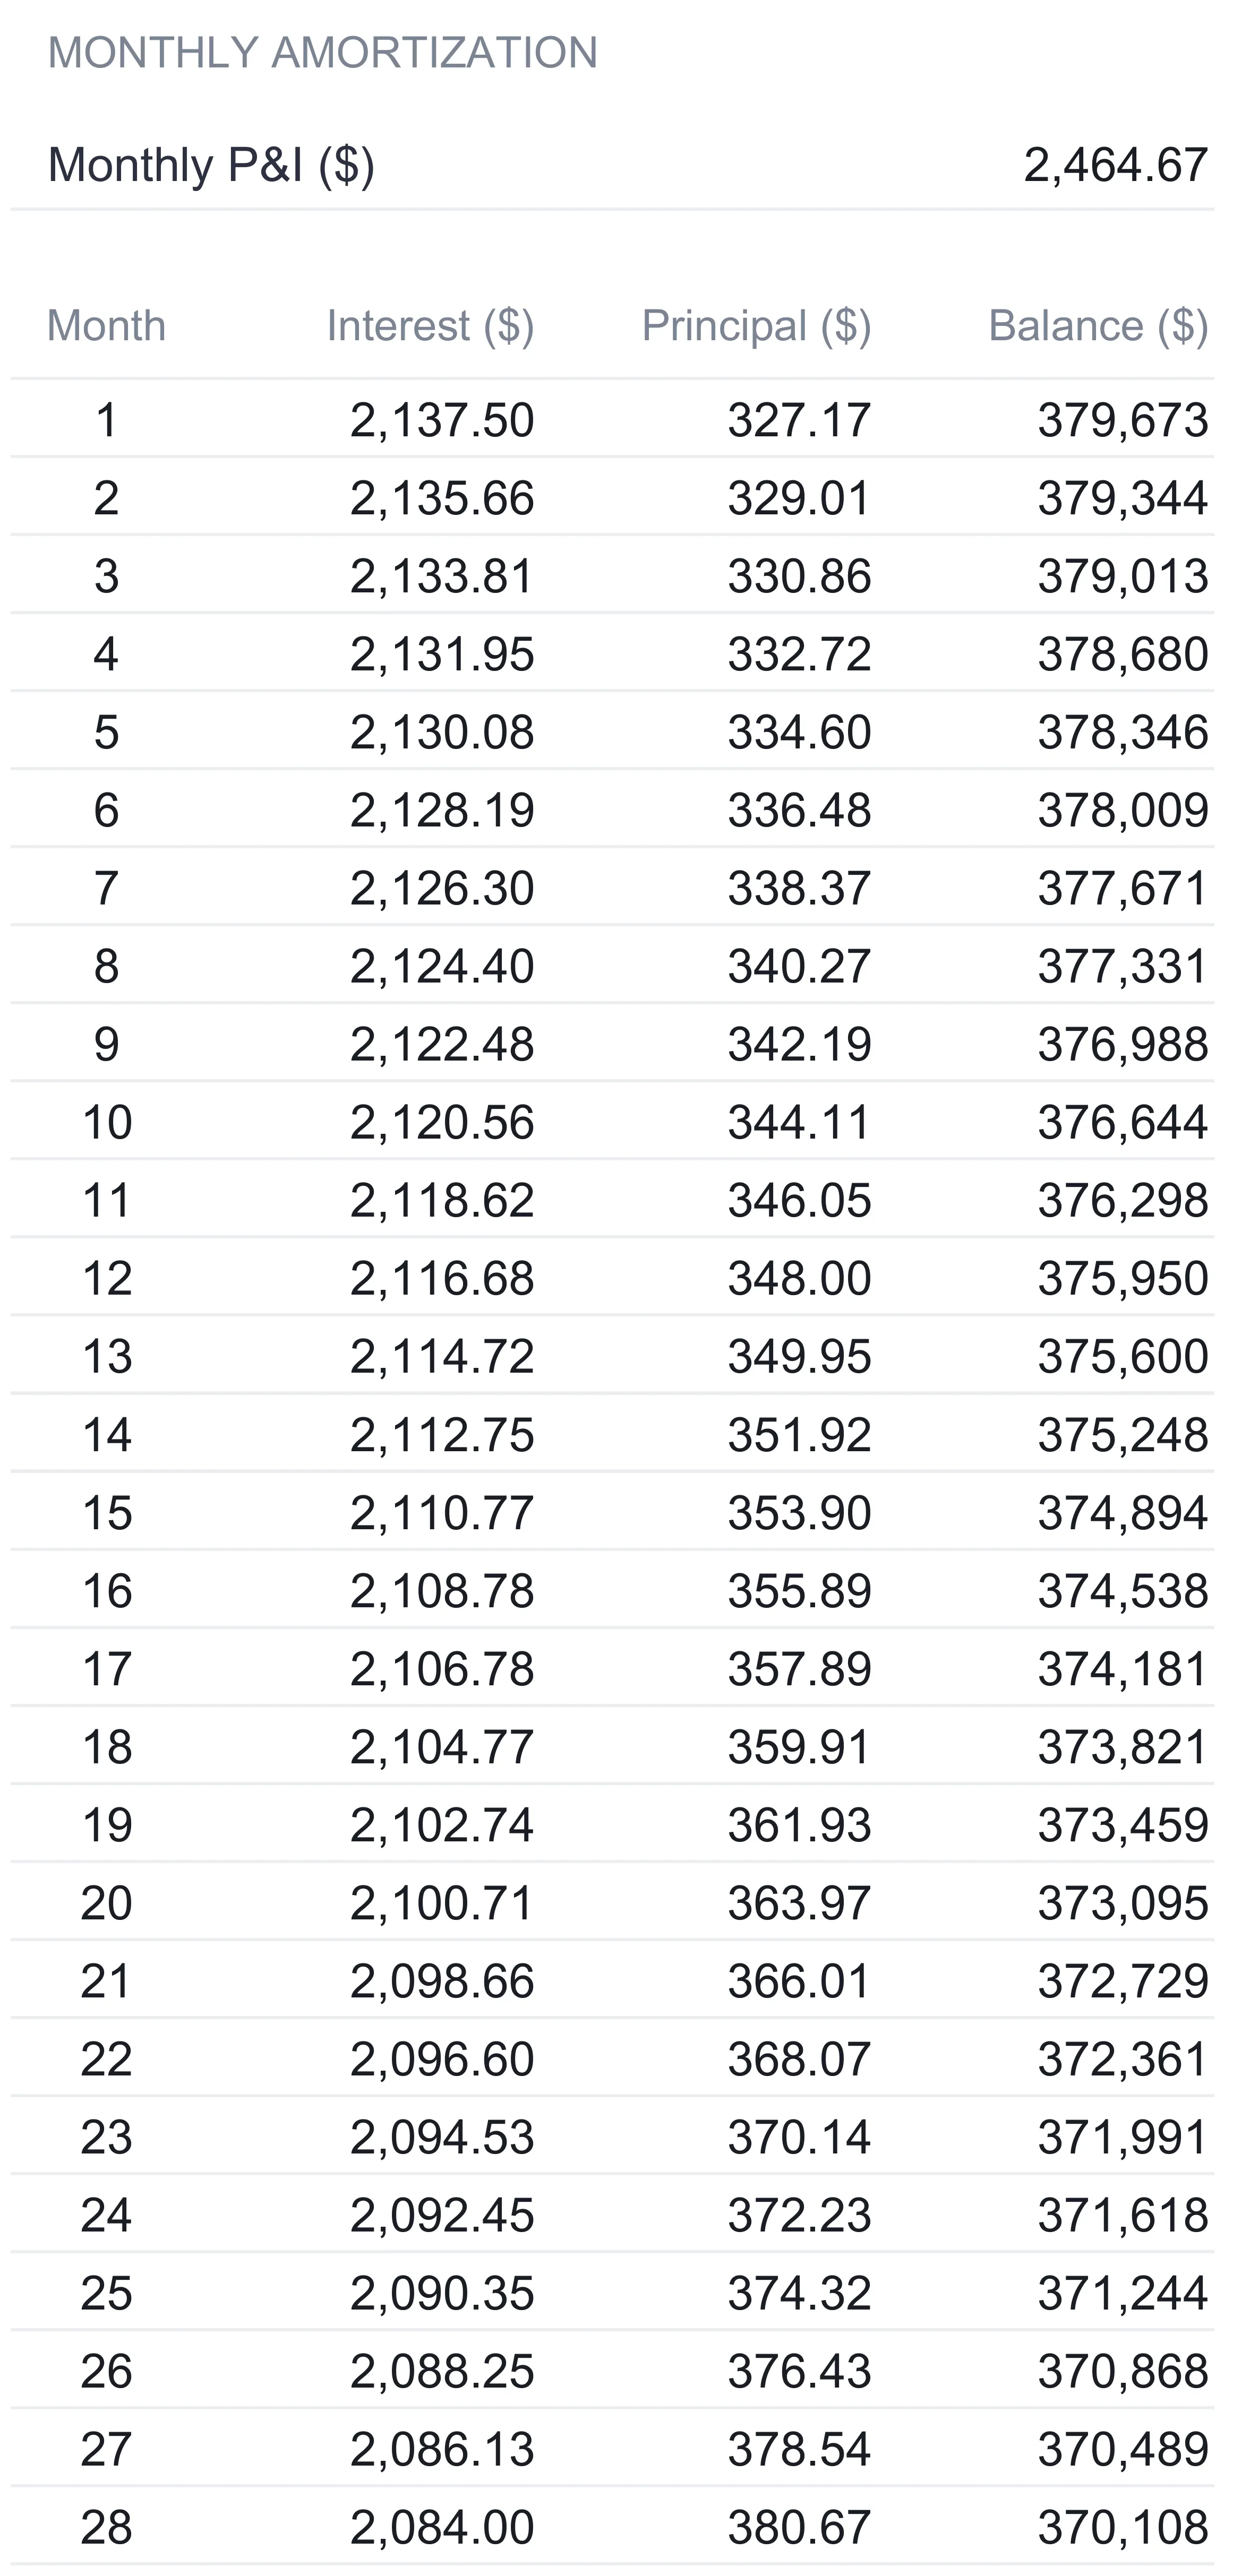
Each row is built from the row above it by a rule that is easy to state:
- Interest for the month is the previous balance times the monthly rate. Month one uses the starting principal: $380,000 times 6.75% divided by 12 is $2,137.50.
- Principal for the month is the fixed payment minus that interest. In month one, $2,464.67 minus $2,137.50 leaves $327.17, capped so the final payment never overshoots the balance still owed.
- Balance is the previous balance minus the principal just repaid. After month one it is $379,672.83.
The striking part of that first row is the split. A payment of $2,464.67 moved the balance down by only $327.17, because $2,137.50 of it was rent on the money still owed. This is the fact the monthly statement never spells out, and it is the reason a mortgage feels like it barely moves in its early years. Interest is charged on the balance, and early in the loan the balance is nearly the whole amount borrowed.
The split shifts, but slowly. By month 12 the balance has fallen only to $375,950, having repaid about $4,050 of principal; of the $29,576 paid across that first year, roughly $25,526 went to interest. The halfway point in time, month 180, is more revealing still: 15 years into a 30-year loan the balance is $278,523, meaning only about $101,477 of the $380,000 has been repaid, a bit over a quarter of the loan after half the term. The interest and principal portions do not draw level until month 238, where the principal share ($1,236.30) first edges past the interest share ($1,228.37). From there principal accelerates, and by the last payments almost the entire amount goes to principal: month 360 charges just $13.79 of interest and retires $2,450.89 of balance, landing the balance at zero.
Reading the Balance column at each five-year mark shows the curve rather than describing it. Tracking the sample loan down the schedule gives this:
| Elapsed | Balance remaining | Principal repaid so far | Share of loan repaid |
|---|---|---|---|
| 5 years | $356,728 | $23,272 | 6.1% |
| 10 years | $324,144 | $55,856 | 14.7% |
| 15 years | $278,523 | $101,477 | 26.7% |
| 20 years | $214,648 | $165,352 | 43.5% |
| 25 years | $125,215 | $254,785 | 67.0% |
| 30 years | $0 | $380,000 | 100% |
The repayment is heavily back-loaded. After the first third of the term only 6.1% of the principal is gone, and it takes until somewhere past the 20-year mark for the loan to be even half paid off. The last third of the term does more than the first two thirds combined. This is not a quirk of the sample rate, it is the shape of every amortized loan, and the schedule is the only place it is laid out payment by payment rather than folded into a single monthly figure.
Two mechanics make the schedule robust to editing. Because every row reads from Settings, changing the rate or the term rebuilds the whole schedule automatically. And a row goes blank once the balance reaches zero or the month passes the term, so a 15-year term fills 180 rows and leaves the rest empty rather than running negative. The sheet lists the first 360 months, which covers any term up to 30 years in full.
Principal, interest, amortization, and total interest in plain terms
Four words carry most of the confusion around a mortgage, and each one is a plain idea underneath.
Principal is the amount borrowed, and later the amount still owed. It starts at $380,000 and is the number the schedule drives toward zero.
Interest is the charge for borrowing, calculated on the principal still outstanding, one month at a time. It is largest at the start, when the outstanding principal is largest, and smallest at the end.
Amortization is the method of paying a fixed-rate loan off in equal installments, where each installment covers that month’s interest first and puts the rest toward principal. Because the interest portion falls as the balance falls, the principal portion rises to match, which is why the payment stays flat while its makeup changes completely from the first month to the last.
Total interest is the sum of every interest charge across the life of the loan. It is the true cost of borrowing, separate from repaying the amount borrowed, and it is the figure the Summary sheet leads with.
Compare loan structures: the Scenarios sheet
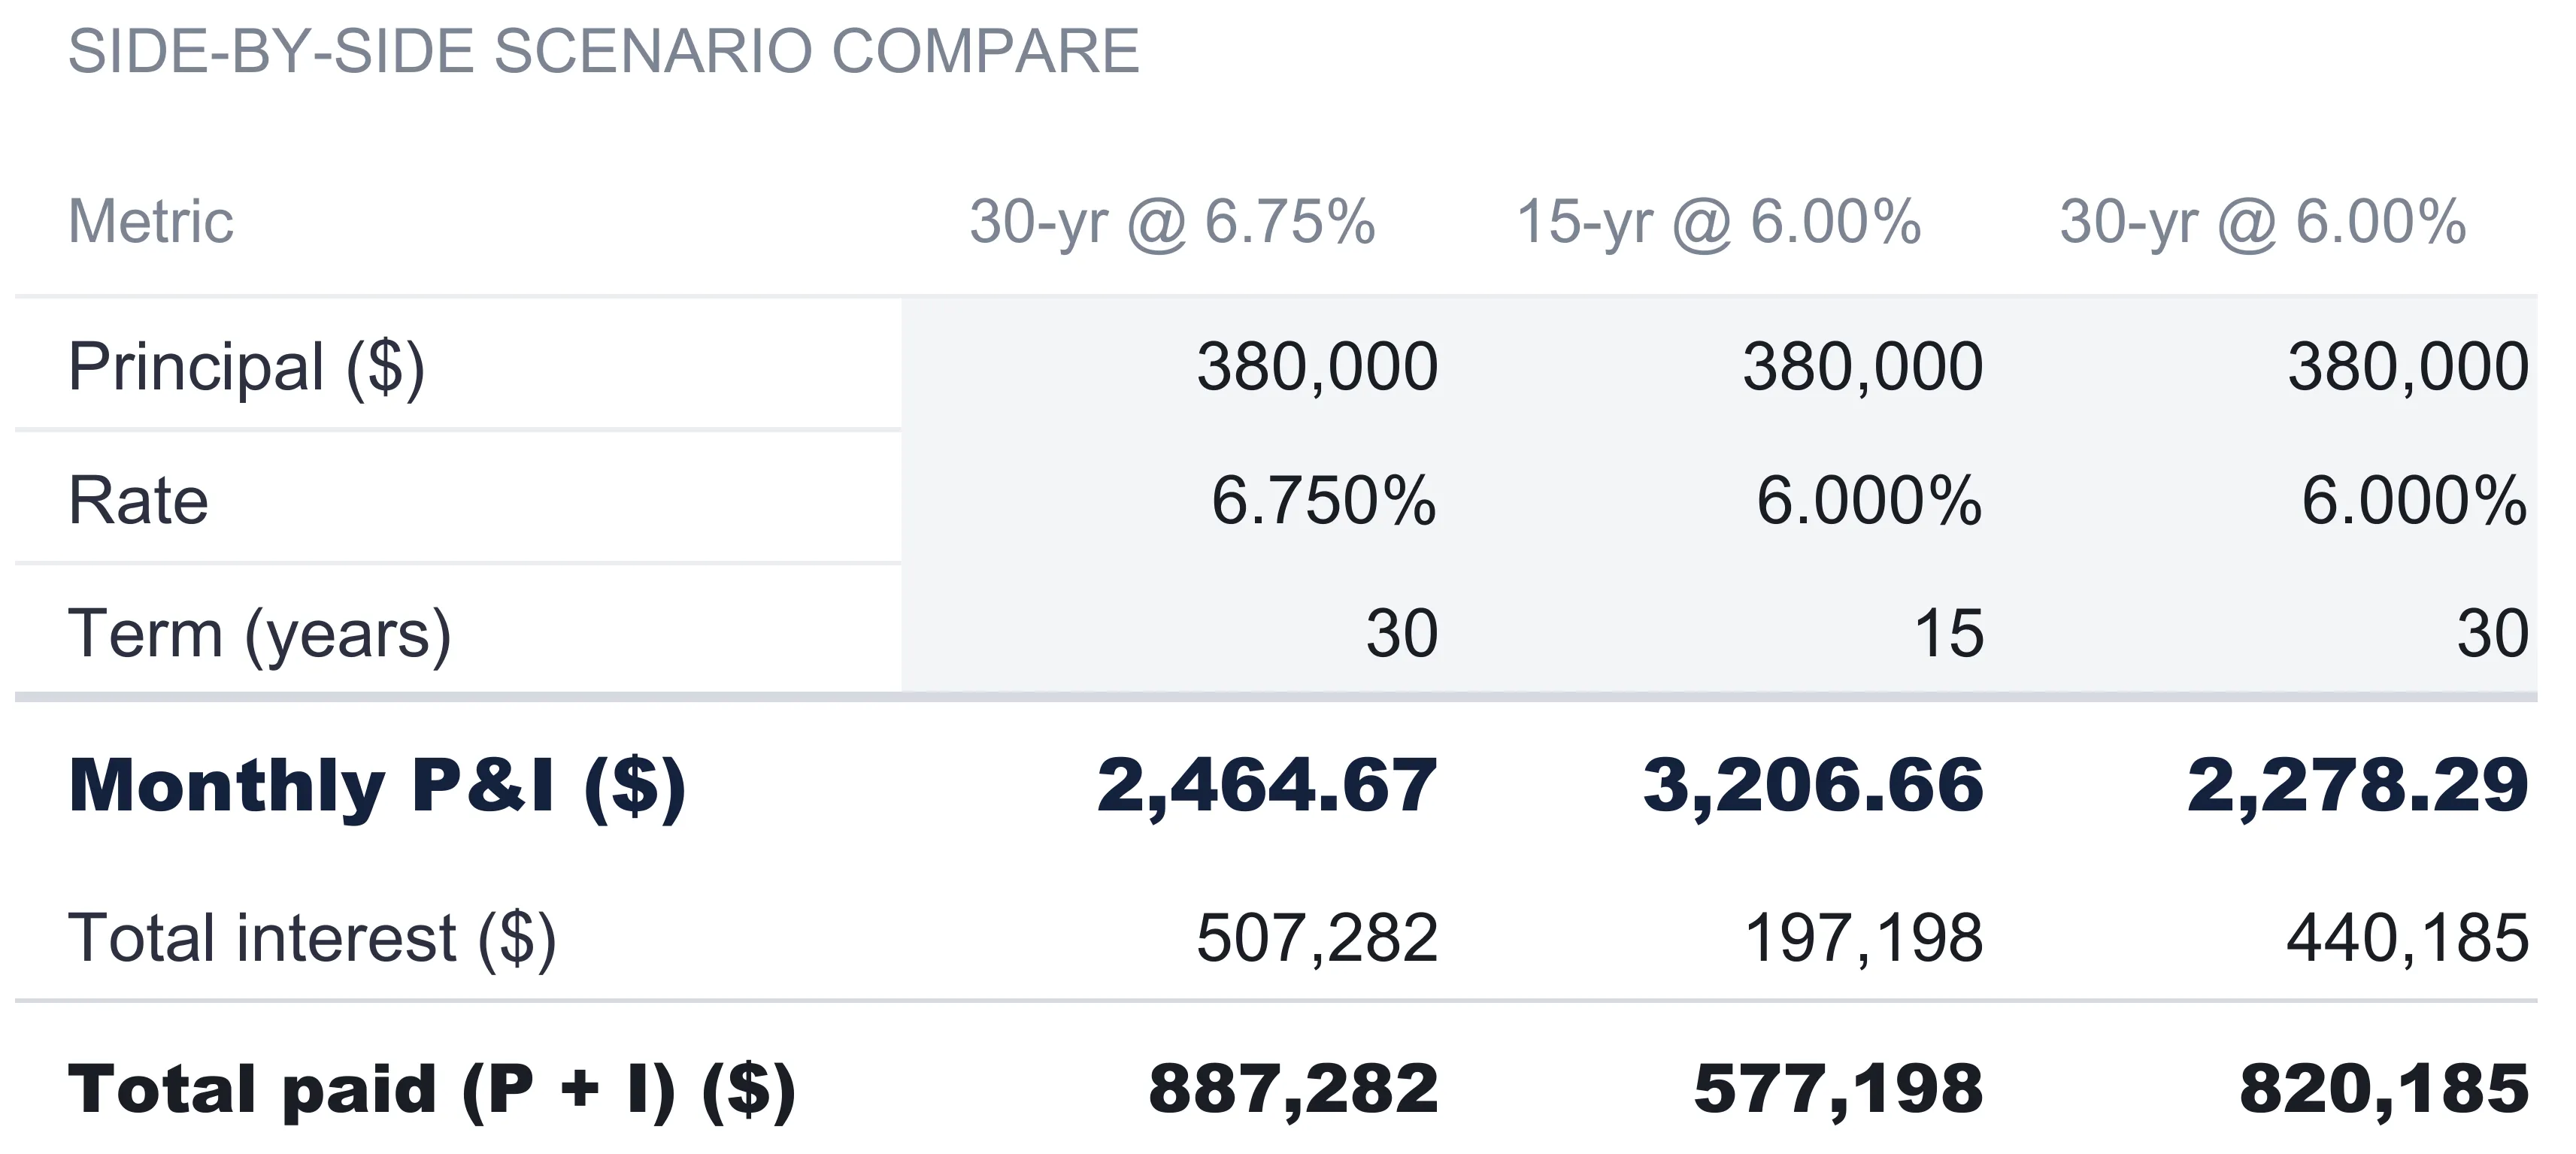
A single amortization schedule answers what one loan does. The question that usually comes next is how it stacks up against a different loan, and that is a separate sheet. The Scenarios sheet holds three columns side by side, each an independent loan with its own principal, rate, and term, and lays out six rows for all three: the principal, rate and term as entered, then the monthly payment, the total interest, and the total paid computed from them.
The sample keeps the principal at $380,000 across all three columns and varies the rate and term:
| Scenario | Monthly P&I | Total interest | Total paid |
|---|---|---|---|
| 30-yr @ 6.75% | $2,464.67 | $507,282 | $887,282 |
| 15-yr @ 6.00% | $3,206.66 | $197,198 | $577,198 |
| 30-yr @ 6.00% | $2,278.29 | $440,185 | $820,185 |
Reading across the columns separates the two levers. Dropping the rate from 6.75% to 6.00% on the same 30-year term takes the monthly payment from $2,464.67 to $2,278.29 and the total interest from $507,282 to $440,185. Shortening the term from 30 years to 15 does something larger to total interest: the 15-year loan at 6.00% pays $197,198 in interest, against $440,185 for the 30-year at the same rate, but it does so by raising the monthly payment to $3,206.66. That trade is the general shape of loan terms, and the Consumer Financial Protection Bureau states it the same way, that shorter loan terms generally save money overall but carry higher monthly payments, because interest is paid for a shorter time. The sheet does not recommend one column over another. It puts the numbers next to each other so the trade is visible, and the choice of which loan suits a given situation is one for a lender or a financial professional.
The Total paid row ties the comparison back to the schedule. It is simply the monthly payment multiplied by the number of months, the full amount handed over across the life of the loan, and it always splits cleanly into the principal, which is the same $380,000 in every column, plus the total interest. The 30-year loan at 6.75% repays $887,282 in all, of which $507,282 is interest; the 15-year loan at 6.00% repays $577,198, of which $197,198 is interest. Seeing total paid and total interest on the same row makes the cost of a longer term concrete, because the extra years show up entirely as extra interest rather than as extra principal, the principal being fixed by the amount borrowed.
Because each column is fully independent, the comparison is not limited to rate and term. Editing the principal in any column models a different loan size, so the same sheet can weigh a larger loan at a lower rate against a smaller one, or any other pairing, as long as the question is which whole loan structure to hold.
The Summary: seven outputs and a chart
The Summary sheet is the model read from the top down. It repeats the three inputs as headline tiles, then adds the four figures that only the full calculation can produce:
| Output | Sample value | What it means |
|---|---|---|
| Principal | $380,000 | The amount borrowed |
| Rate | 6.750% | The annual interest rate |
| Term | 30 years | The length of the loan |
| Monthly P&I | $2,464.67 | The recurring principal-and-interest payment |
| Total interest | $507,282 | The cost of borrowing over the full term |
| Total paid | $887,282 | Principal plus interest, the full amount repaid |
| Interest % | 133.495% | Total interest as a share of the principal |
The two figures at the bottom are the ones worth sitting with. Total paid of $887,282 against a $380,000 loan means the borrower repays the amount borrowed and then a further $507,282 on top of it. That second number, the total interest, is larger than the loan itself, which is what the interest-percentage tile is stating when it reads 133.495%: over 30 years at this rate, the interest comes to about one and a third times the amount borrowed. None of these figures is a judgment about the loan. They are the arithmetic the payment schedule implies, gathered onto one screen.
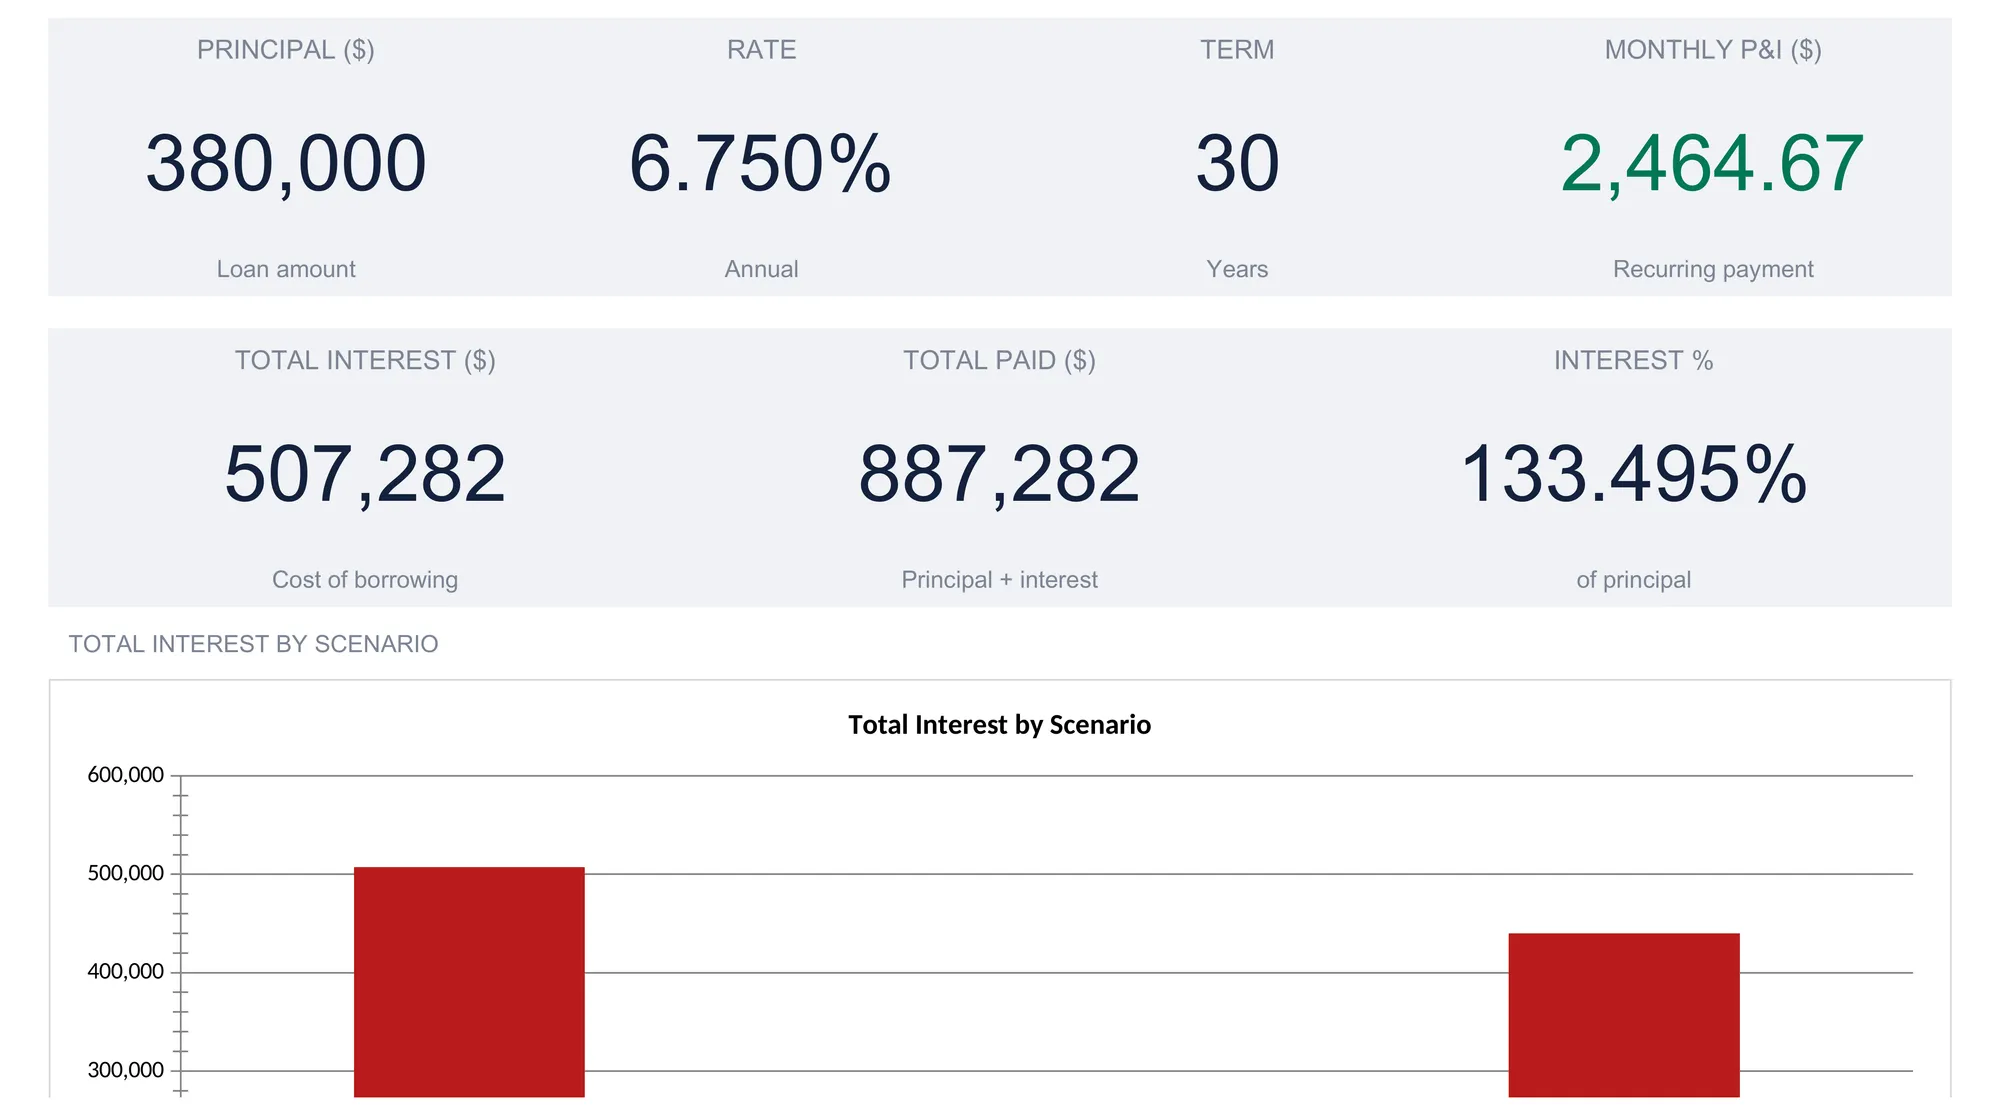
Below the tiles a “Total Interest by Scenario” bar chart plots the total interest from the three Scenarios columns against each other, so the $507,282, $197,198, and $440,185 comparison reads at a glance rather than as a row of numbers. In the cover render above, the chart is cropped at the bottom, so the tall 30-year bars are visible while the short 15-year bar sits below the frame. A status line across the top of the sheet restates the headline in one sentence, “Monthly P&I 2,464.67, total interest 507,282,” so the two numbers that matter most are the first thing the file shows on open.
What the model covers, and what it leaves out
A clear model is defined as much by its edges as by its contents, and this one draws a tight boundary around a single idea: the amortization of one fixed-rate loan and the comparison of whole loan structures. Knowing what falls outside that boundary is what keeps the outputs honest.
The payment it computes is P&I, principal and interest only. A real monthly mortgage bill is often larger, because lenders commonly collect property taxes and homeowners insurance in the same payment and hold them in escrow, and the Consumer Financial Protection Bureau notes that the total monthly payment sent to a mortgage company is frequently higher than the principal-and-interest figure for that reason. Private mortgage insurance can sit on top of that as well. None of those items appear in this workbook, so the $2,464.67 here is the loan’s own cost and not a forecast of the full amount that leaves a bank account each month. Treating the two as the same number is the most common way a mortgage estimate goes wrong.
The schedule also assumes the contract runs exactly as written. It carries no extra-payment column, so it does not model paying the loan down ahead of schedule, and no rate-change logic, so it reads a fixed rate for the whole term rather than an adjustable one. Those are deliberate omissions that keep the amortization unambiguous. The question of how adding to each payment would shorten the term and cut the total interest is a genuinely different calculation, and it is the subject of a separate walkthrough linked at the end of this article.
Finally, the model starts from a loan that already exists. It takes the principal, rate, and term as given and reads what they cost. It does not work backward from an income to a payment a borrower could carry, which is the affordability question that comes before a loan is signed rather than after. Keeping those two jobs on separate tools is what lets each one stay simple.
The How to Use sheet
The workbook ships with a reference tab that documents itself, which is worth a look before editing anything. The How to Use sheet lists every other sheet with a one-line description of what it holds, then states the model’s math in plain sentences rather than leaving it buried in cell formulas. It spells out the monthly payment formula, the rule that month-one interest is the principal times the monthly rate while each later month uses the prior balance, the fact that a month goes blank once the balance clears or the term ends, and the identity the Summary relies on, that total interest equals the monthly payment times the number of months minus the principal. That last identity is why the Summary can report the total interest for any term correctly even though the visible schedule stops at 360 rows. Having the arithmetic written out in words on its own sheet means the model can be checked and trusted rather than taken on faith, which matters more for a number the size of a mortgage than for almost anything else in a household budget.
Excel or Google Sheets for a mortgage analysis
The template is an .xlsx file built on plain formulas, with no macros and no add-ons, so it runs identically in Microsoft Excel and in Google Sheets after upload. The payment calculation uses only arithmetic plus the POWER and LN functions, all of which behave the same in either program, so the schedule and the scenario comparison rebuild the same way whichever one opens the file. Google Sheets suits anyone who wants the model in a browser and shared by link, while Excel suits those who prefer a local file. The structure described here is equally buildable in either.
Which template fits the question
- Mortgage Analysis Spreadsheet Template ($29) is the workbook this walkthrough follows: the three loan inputs on Settings, the full amortization schedule, the three-way scenario comparison, and the summary of payment, total interest, and total paid, ready for a single loan in Excel or Google Sheets.
- Rental Property Analysis Spreadsheet Template ($59) answers a different question. Where mortgage analysis reads the cost of the loan on a home, rental property analysis weighs whether a property works as an investment, bringing in rent, operating costs, NOI, and cash-on-cash return alongside the financing. The mortgage on an investment property is one input there rather than the whole picture.
Related
- Mortgage Payoff Calculator: Extra Payments Impact - the companion question this model does not cover, how adding to each payment shortens the term and cuts total interest
- How Much House Can I Afford Spreadsheet (Rules + Reality) - the step before a mortgage exists, sizing a payment against income
- How to Analyze a Rental Property in a Spreadsheet - the same discipline applied to an income property, with cash flow and return metrics
Frequently asked questions
What is an amortization schedule?
It is a month-by-month table of a fixed-rate loan. Each row shows how one payment splits into interest and principal, and the balance left after it. The interest portion is the balance still owed times the monthly rate, the principal portion is whatever is left of the fixed payment after that interest, and the balance falls by the principal portion each month until it reaches zero at the end of the term.
Why is so much of an early mortgage payment interest?
Interest is charged on the balance still owed, and early in a loan that balance is close to the full amount borrowed. In the worked example, month one charges $2,137.50 of interest against a $380,000 balance and puts only $327.17 toward principal. As the balance shrinks the interest shrinks with it, so a larger share of each fixed payment goes to principal. In this loan the principal portion first overtakes the interest portion at month 238.
How does the spreadsheet calculate the monthly payment?
It uses the standard fixed-rate payment formula: principal times the monthly rate, divided by one minus (one plus the monthly rate) raised to the negative number of months. The monthly rate is the annual rate divided by 12 and the number of months is the term times 12. The result sits in one cell on the Amortization sheet, and the Summary tiles for total interest, total paid, and interest as a share of principal all read from it. At a 0% rate the formula divides the principal evenly across the months instead.
Can it compare a 15-year and a 30-year mortgage?
Yes. The Scenarios sheet holds three columns, each with its own principal, rate, and term, and computes the monthly payment, total interest, and total paid for all three side by side. The sample compares a 30-year loan at 6.75%, a 15-year loan at 6.00%, and a 30-year loan at 6.00%, so the effect of a shorter term and a lower rate both show up in the same view.
Does the schedule handle extra payments toward principal?
No. The model schedules the standard fixed payment for every month and does not carry an extra-payment column, so it shows the loan running its full contractual term. It is built to read the amortization of a set loan and to compare whole loan structures against each other, rather than to model paying a loan down early.
Sources
- How do mortgage lenders calculate monthly payments? - Consumer Financial Protection Bureau
- Understand the different kinds of loans available - Consumer Financial Protection Bureau
About this article
Every figure, column name, formula, and feature description checked on 2026-09-10 against the shipped Mortgage Analysis Premium workbook (Summary, Scenarios, Amortization, Settings and How to Use sheets in the exact .xlsx customers download), with the payment and amortization split recomputed from the standard fixed-rate formula. Mortgage payment and loan-term references checked against the live Consumer Financial Protection Bureau pages at writing time. Last reviewed September 2026.