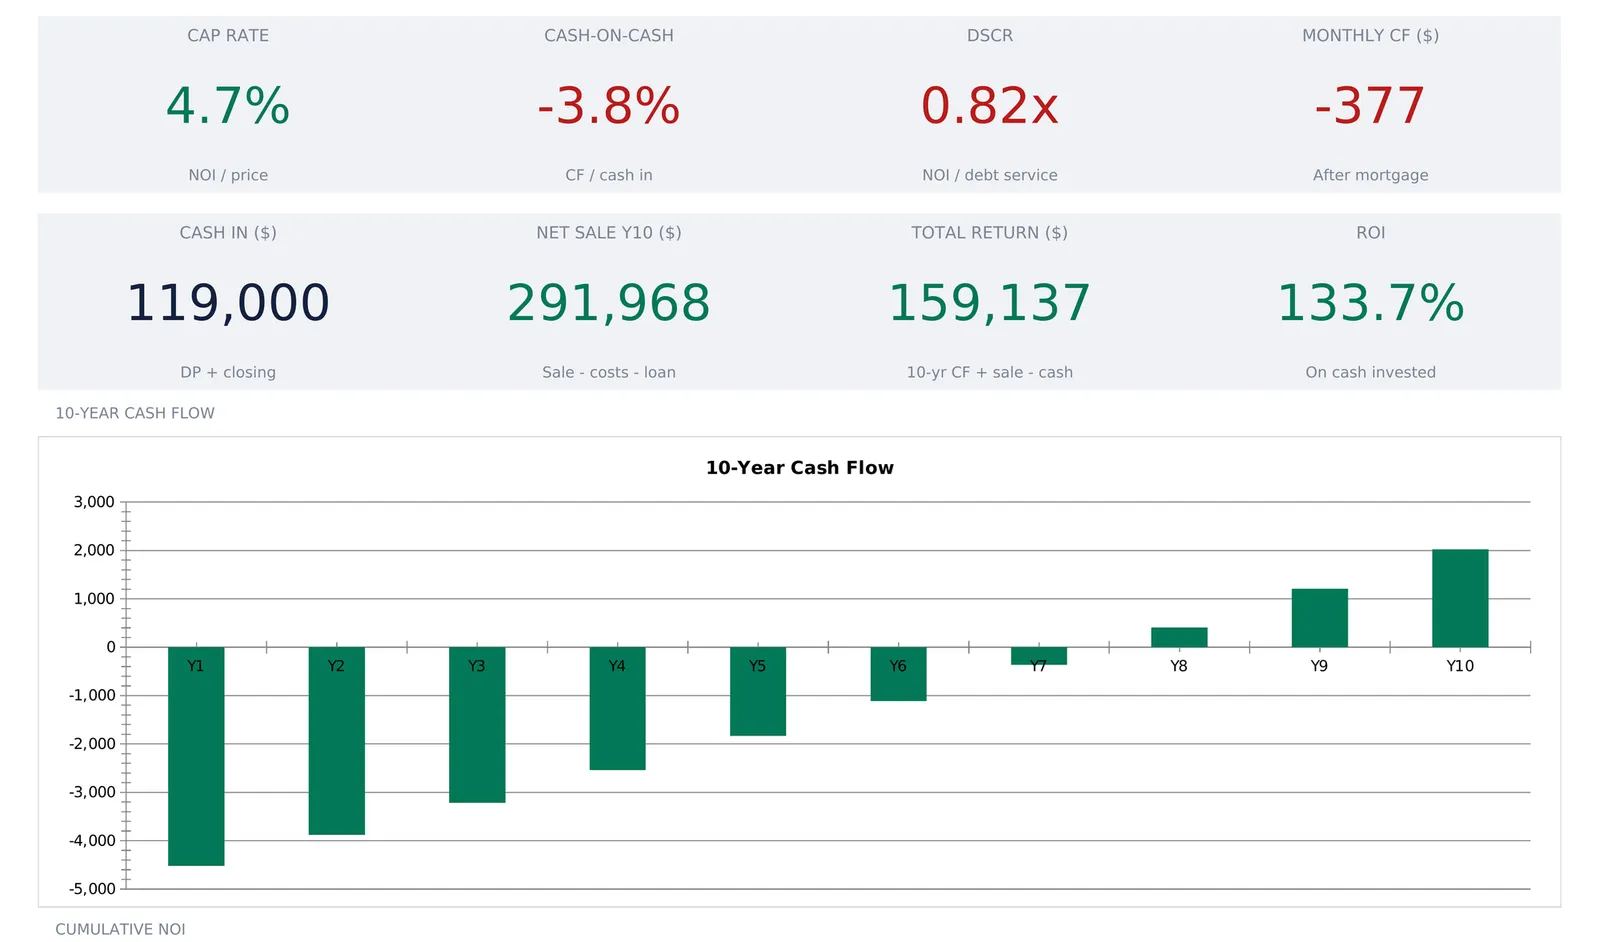
Underwriting a rental purchase means turning estimates into comparable numbers before the money moves. A rental property analysis spreadsheet does that with three input sheets, purchase and financing, operating income and expenses, and growth assumptions, then computes NOI, cap rate, cash-on-cash, DSCR, a ten-year projection, and the sale at exit. This walkthrough follows a worked example: a $425,000 duplex with $119,000 of cash in, 4.7 percent cap rate, 0.82x DSCR, and monthly cash flow of minus $377. Our Rental Property Analysis template ($59) ships the same structure ready-made for Excel and Google Sheets.
A rental purchase is a one-shot decision made almost entirely out of estimates. The rent is an estimate, the vacancy allowance is an estimate, the repair budget is an estimate, and the mortgage payment is the only figure in the whole deal known to the cent. Underwriting turns that pile of guesses into a small set of comparable numbers. Two listings with different prices, different rents, and different loans then sit side by side on the same terms.
That is a different job from tracking a property already owned. Recording what a rental actually did, month by month, is covered in the rental property cash flow spreadsheet walkthrough. The ideas behind the return figures are unpacked in how to calculate ROI on a rental property. What follows is the model itself: which cells get typed, which get computed, and how an asking price chains through to a ten-year outcome.
The examples come from our Rental Property Analysis Spreadsheet Template ($59), which ships the whole structure ready-made for Excel and Google Sheets. The sample file underwrites a duplex at $425,000, and that deal does not cash flow in year one. The choice is deliberate. A model that only ever shows green tiles is not telling you much.
What a rental property analysis spreadsheet has to hold
Strip out the presentation and an underwriting model is only four kinds of information:
- Purchase and financing facts. Price, down payment, closing costs, interest rate, and term. These decide how much cash leaves your account on day one and how much leaves it every month afterwards.
- Operating assumptions. Rent, a vacancy allowance, and the annual bills the property generates whether or not a tenant is in place.
- Growth assumptions. How fast rent rises, how fast expenses rise, what the property might be worth later, and what selling it costs.
- Derived ratios and projections. Cap rate, cash-on-cash, DSCR, gross rent multiplier, the year-by-year cash flow, and the sale at exit. None of these are ever typed.
The template gives each group its own sheet. Purchase and Operating hold the deal, Settings holds the growth assumptions, Annual Projection and Returns compute the outcome, a Dashboard sits on top, and a How to Use sheet carries the definitions. Seven sheets in total, and across all of them exactly seventeen numbers are entry cells, plus a property name and a currency symbol. Everything else that carries a number is a formula, and every entry cell is shaded so it is obvious at a glance which is which.
Start with Settings: the four assumptions that compound
Four percentages on the Settings sheet never appear in year one and quietly decide the whole ten-year answer, which is why they come first.
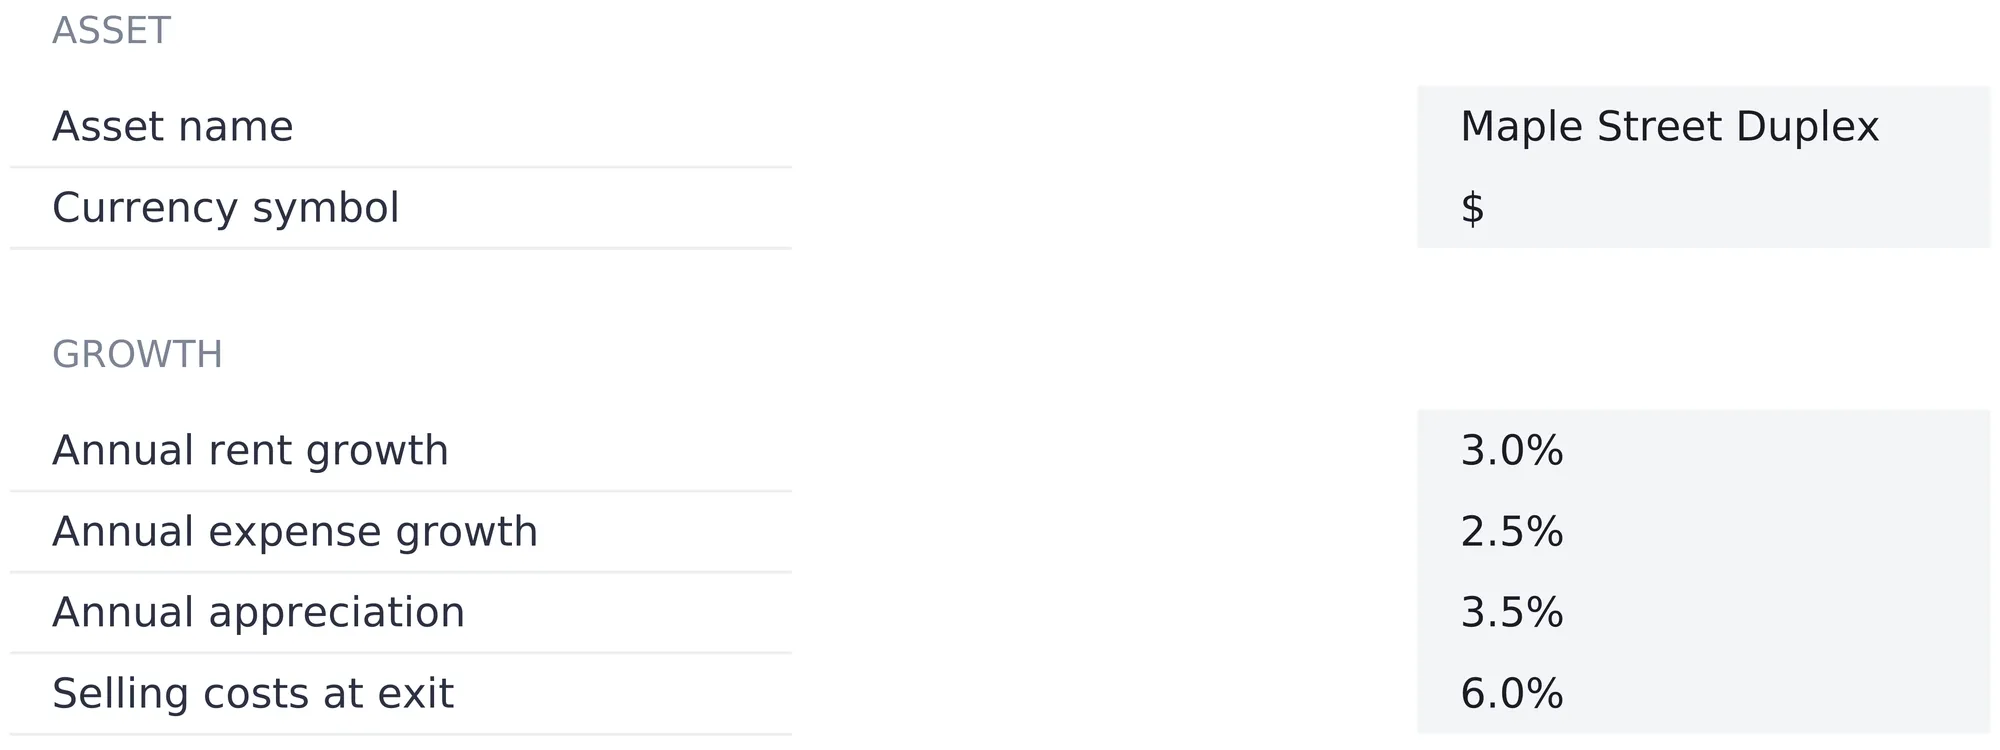
Annual rent growth, 3.0 percent in the sample, escalates gross rent in every year after the first.
Annual expense growth, 2.5 percent, escalates property tax, insurance, HOA, and utilities. Maintenance and management are not escalated by this rate because they are percentages of rent already, so they rise with the rent instead.
Annual appreciation, 3.5 percent, is applied to the purchase price for ten years to produce the sale figure at exit. It has no effect on any cash flow number.
Selling costs at exit, 6.0 percent, comes off that sale price.
The half point between rent growth and expense growth is doing more work than it looks. Rent compounds at 3.0 percent while the fixed bills compound at 2.5 percent, and that gap is why net operating income pulls ahead of costs over the decade. Reverse the two and the same property tells a different story by year five, without a single other cell changing.
Settings also holds the asset name, which appears under the title on each of the six working sheets, and a currency symbol chosen from a dropdown of 35 options. Changing it relabels every money header and KPI tile across the workbook. It relabels only, with no conversion of the underlying numbers.
The Purchase sheet: price, loan, and cash in
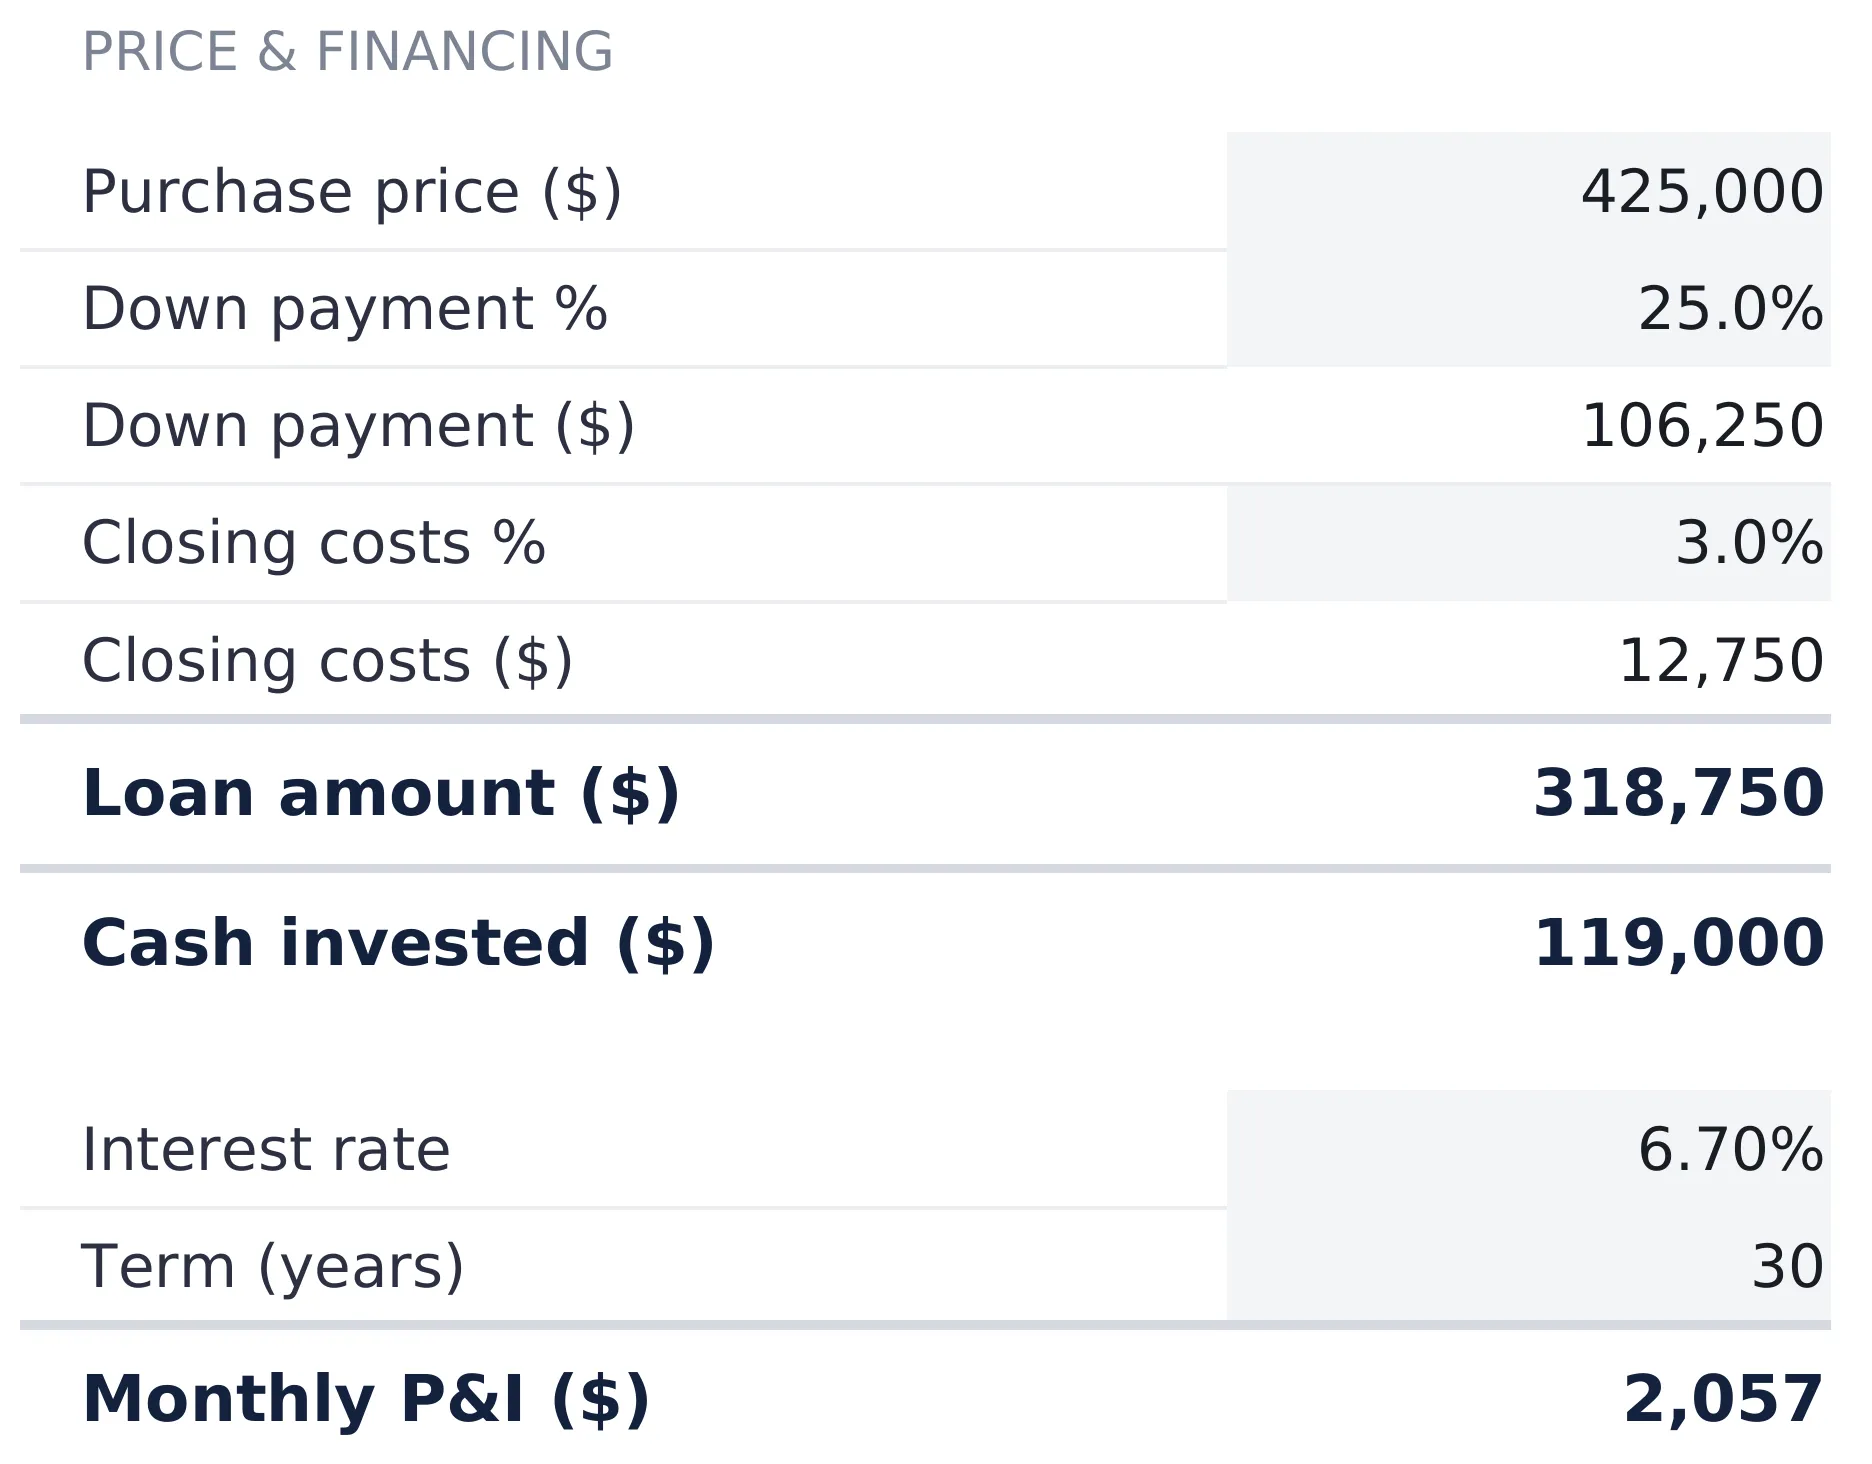
Five typed numbers here produce everything about the financing side.
The sample duplex is priced at $425,000 with 25 percent down, which is $106,250, and closing costs at 3 percent of price, which is $12,750. From those the sheet computes a loan amount of $318,750 and cash invested of $119,000. That cash figure is the denominator of the cash-on-cash return later, so it matters that it is down payment plus closing costs rather than down payment alone.
The loan is 6.70 percent over 30 years, and the monthly principal and interest works out to $2,057. One cell holds the standard amortization payment:
Monthly P&I = loan × monthly rate ÷ (1 - (1 + monthly rate)^-payments)Two edge cases are handled rather than left to produce errors: a zero interest rate repays the loan in equal instalments, and a blank or zero term leaves the payment at nothing. A cash purchase runs through the same cells, entered as 100 percent down. The loan amount falls to zero, the payment falls to zero, cash invested becomes price plus closing costs, and DSCR reads N/A because there is no debt service to divide by.
One thing the sheet does not have is a line for initial repairs. Cash invested is down payment plus closing costs, so a property that needs work before it can be rented carries that cost outside the model unless it is folded into the closing costs percentage.
The Operating sheet: rent down to NOI
Eight typed numbers turn a rent figure into net operating income and then into cash flow.
Income first. Monthly rent of $2,850 becomes $34,200 of annual gross rent, and a 6 percent vacancy allowance brings that to $32,148 of annual effective rent. Vacancy is modeled as a haircut on income rather than as specific empty months, which keeps the sheet compact at the cost of some realism about when the gap falls.
Then the annual expenses. Property tax at $5,400 and insurance at $1,800 are typed as annual amounts. Maintenance and management are typed as percentages of gross rent, 6 percent and 8 percent, which compute to $2,052 and $2,736. HOA and utilities are typed as monthly figures, zero in this sample, and the sheet multiplies them by 12, so each bill is entered in the unit it arrives in. Total annual expenses come to $11,988.
Net operating income is effective rent minus operating expenses, $32,148 minus $11,988, or $20,160 a year and $1,680 a month. Debt service is deliberately not in that subtraction, which is what makes NOI comparable between a cash buyer and a leveraged one.
The last two rows are where the deal gets honest. Monthly cash flow is monthly NOI minus the monthly payment from the Purchase sheet, $1,680 minus $2,057, which is minus $377. Annualized, that is minus $4,522.
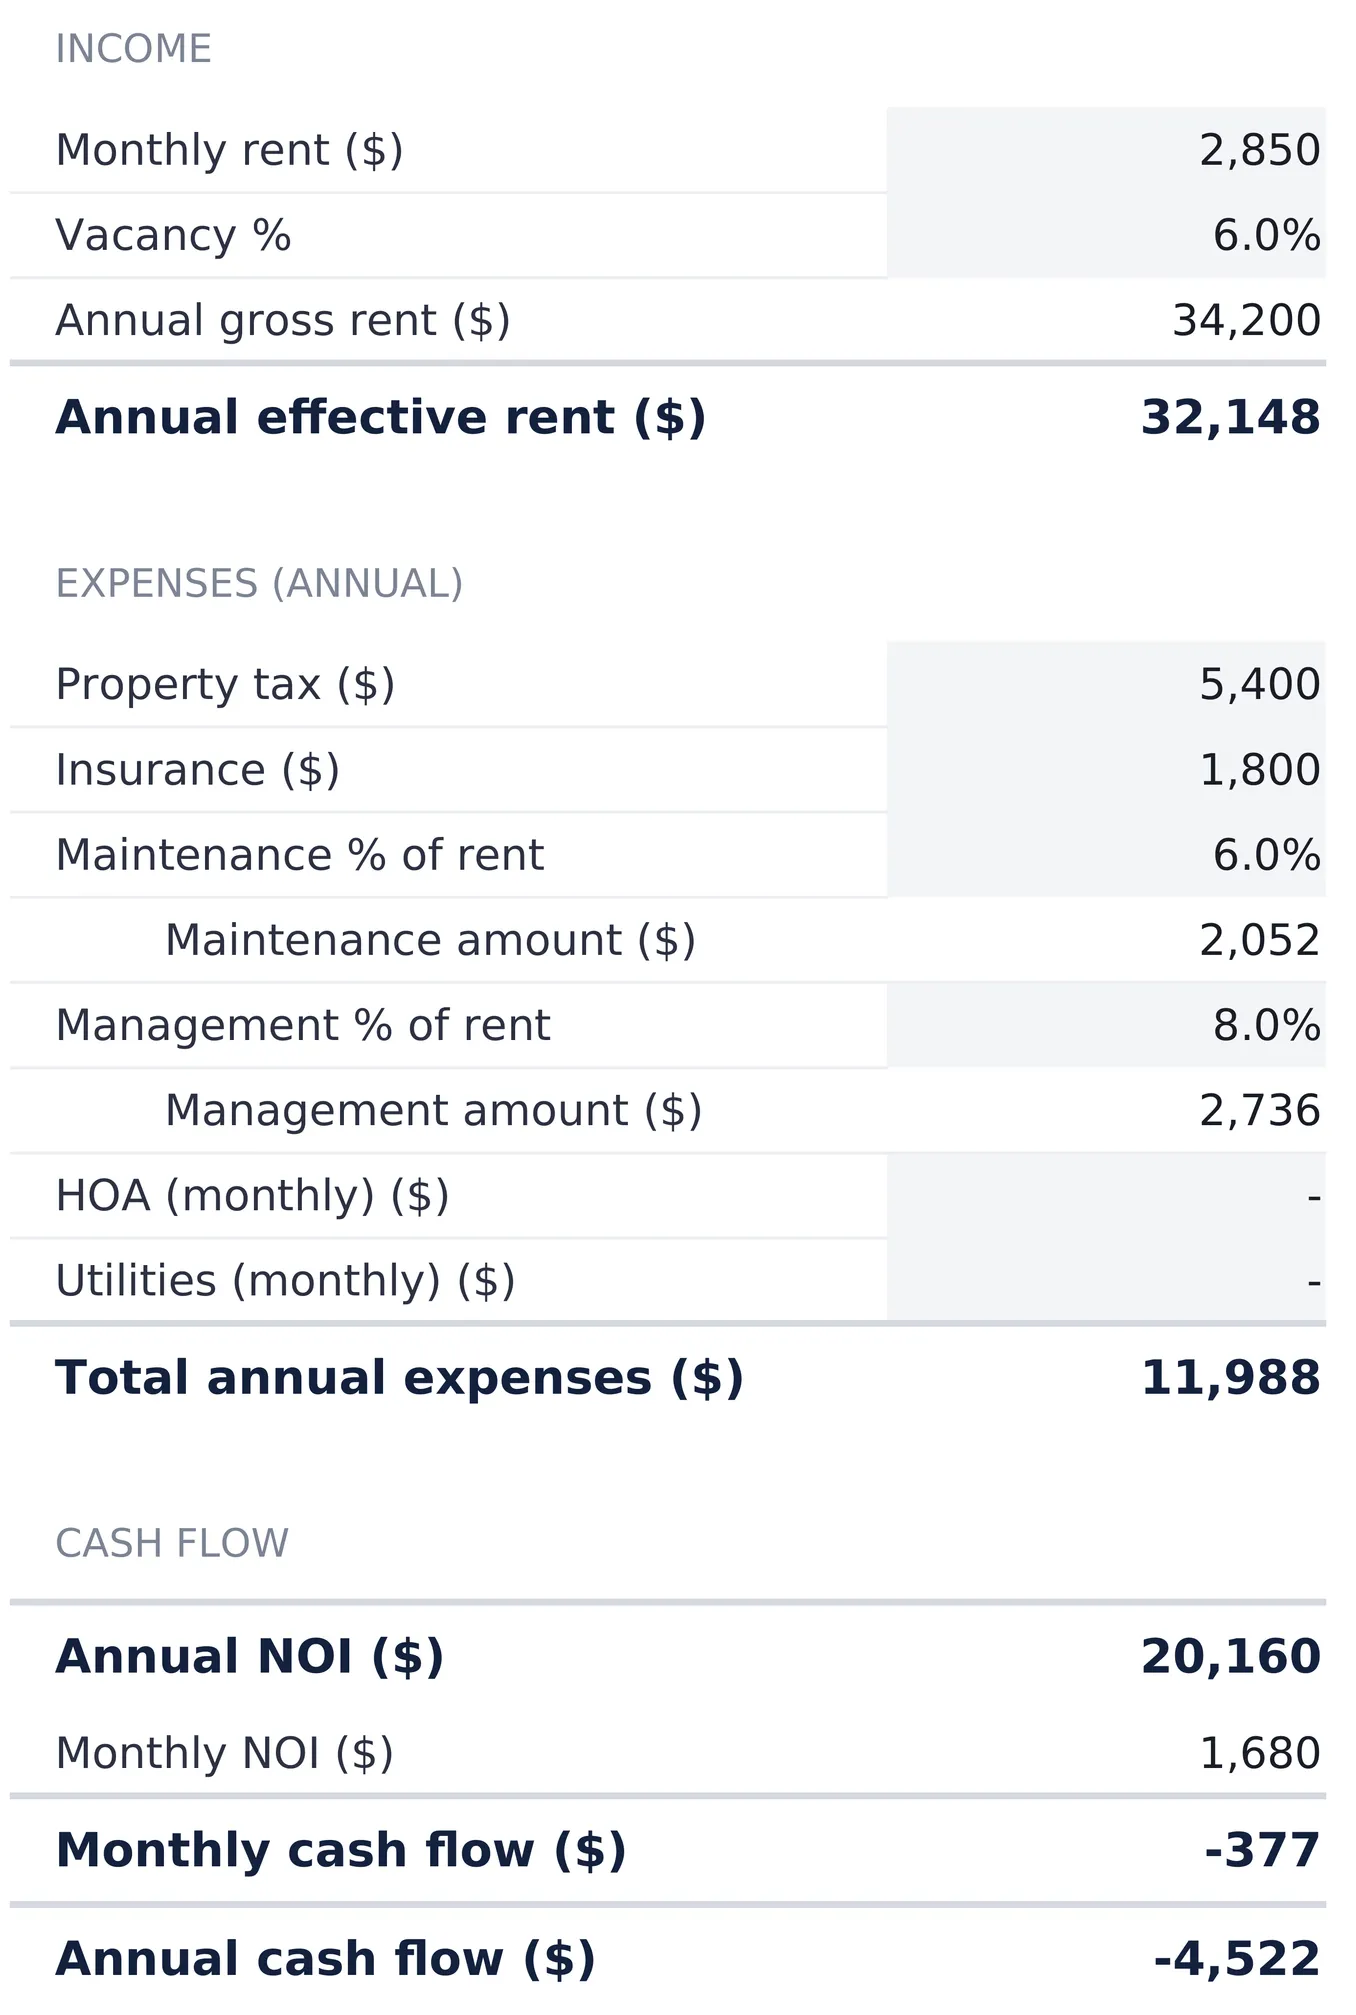
Two structural choices on this sheet shape the output more than their size suggests, and a hand-built version that skips them behaves differently.
Maintenance and management scale with rent. Because both are percentages of gross rent rather than flat amounts, raising the rent assumption raises them too. Where those two are typed as flat figures instead, an optimistic rent runs straight through to NOI with nothing pushing back.
There is no separate capital expenditure row. One maintenance percentage covers repairs, so a roof or a furnace has to live inside the same 6 percent of gross rent that covers a leaking tap. Whether it stretches that far depends on the age and condition of the building, which the model knows nothing about beyond the figure typed into that cell.
Cap rate, DSCR, and two more ratios on the Returns sheet
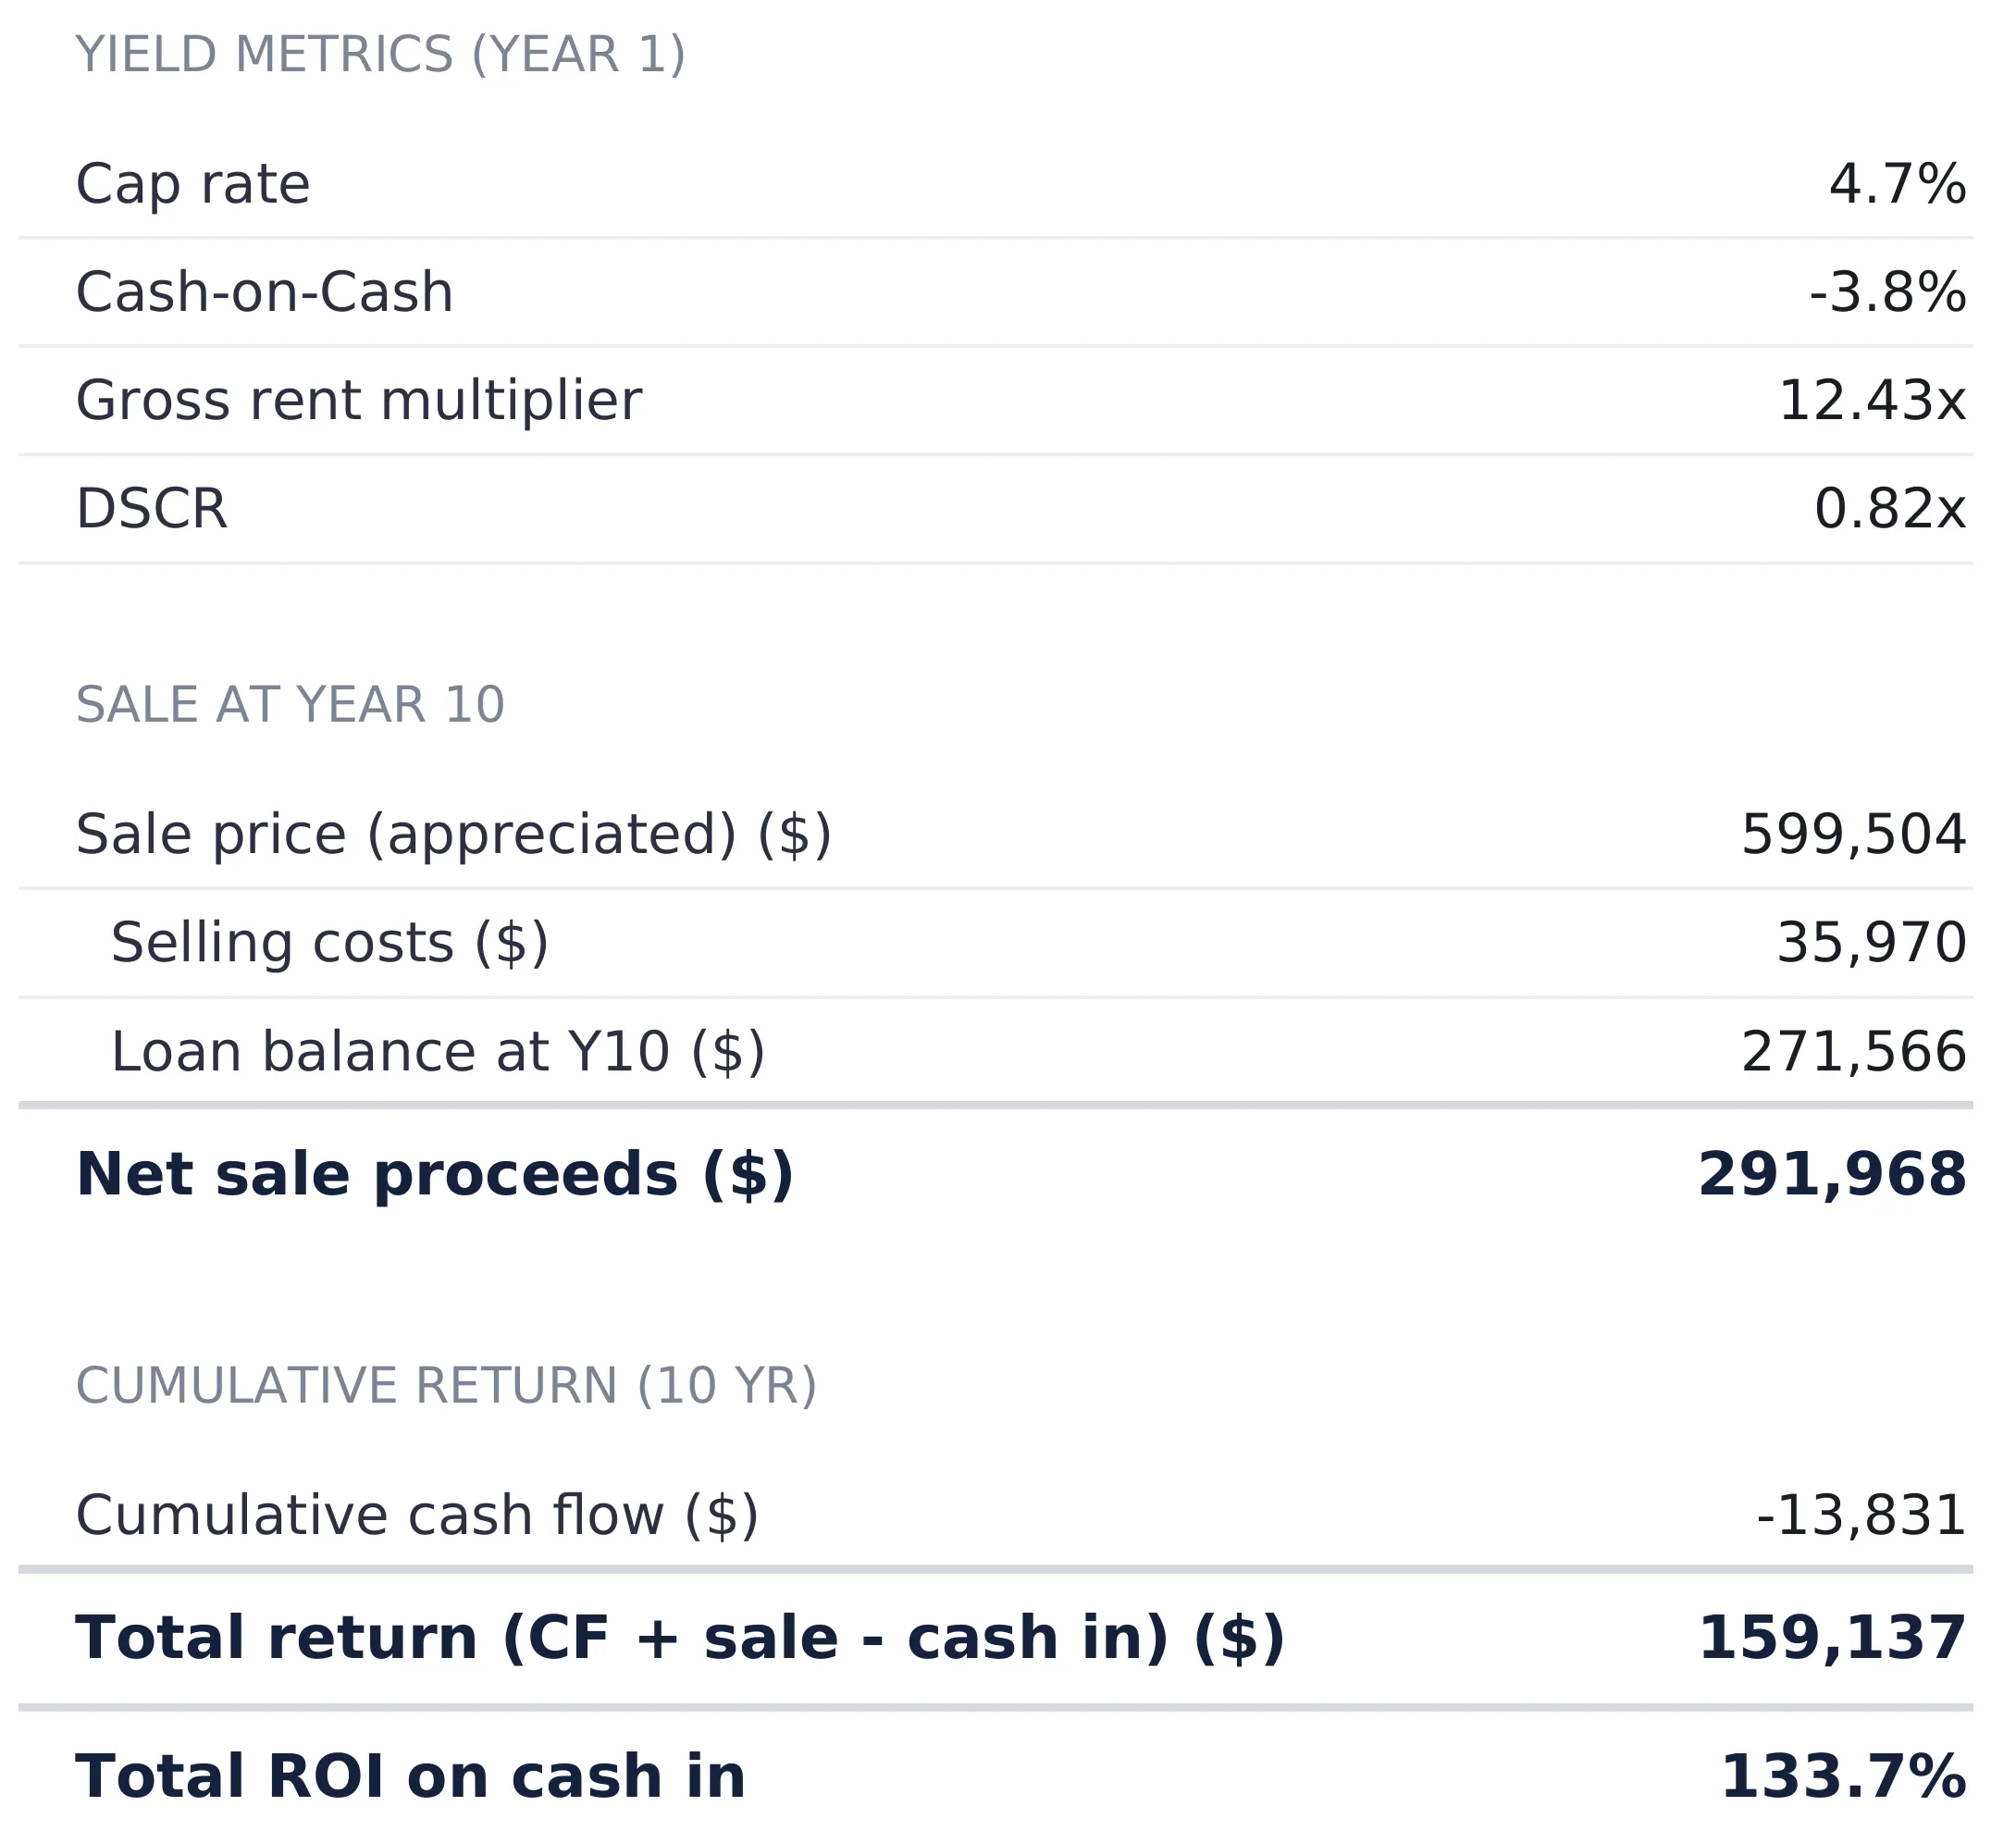
The four ratios at the top of the Returns sheet invent nothing. Each divides numbers the Purchase and Operating sheets already produced, which is why they agree with each other and with the dashboard.
| Ratio | Sample value | How it is derived |
|---|---|---|
| Cap rate | 4.7% | Annual NOI ÷ purchase price |
| Cash-on-cash | -3.8% | Annual cash flow after the mortgage ÷ cash invested |
| Gross rent multiplier | 12.43x | Purchase price ÷ annual gross rent |
| DSCR | 0.82x | Annual NOI ÷ annual debt service |
Look at the first two together. Cap rate reads a positive 4.7 percent and cash-on-cash reads minus 3.8 percent, on the same property in the same year. Nothing has gone wrong. Cap rate excludes financing by design, so it describes the building, while cash-on-cash is the only ratio here that reflects the loan. The distance between them is the mortgage, and a rate change moves one of them and not the other.
DSCR is the ratio lenders set minimums against, and at 0.82x the sample property’s operating income covers 82 percent of its own debt service. Gross rent multiplier is the crudest of the four: price against gross rent, with no expenses considered at all. That makes it useful for a first-pass sort through a listing page and not much else.
Each ratio reads N/A rather than an error when the figure it divides by is blank or zero, so a half-filled file stays readable while the rest of the numbers go in.
The sale at year 10
Below the ratios, the sheet models the exit. The $425,000 price grown at 3.5 percent for ten years gives a sale price of $599,504. Selling costs of 6 percent take $35,970. The loan balance is amortized forward 120 payments to $271,566, and the balance calculation stops at the end of the loan term rather than running past it. Net sale proceeds land at $291,968.
Buried in those figures is a return that never lands in a bank account. The loan comes down from $318,750 to $271,566 over the decade, so about $47,000 of principal is repaid inside payments that the cash flow row only ever records as money going out. It shows up once, in the loan balance subtracted from the sale.
The cumulative return
Three rows close the sheet. Cumulative cash flow across the ten projection years is minus $13,831. Total return is that figure plus net sale proceeds minus cash invested, which is $159,137. Total ROI on cash in is $159,137 against $119,000, or 133.7 percent.
That last number is cumulative across the whole ten-year hold rather than an annual rate, and it leans heavily on an appreciation assumption typed by hand on Settings. Both facts are worth holding in mind whenever a headline ROI figure looks large.
The ten-year projection and the year it crosses over
The Annual Projection sheet is a ten-column grid, Y1 through Y10, with six computed rows: gross rent, effective rent, operating expenses, NOI, debt service, and cash flow. Nothing on it is typed.
Year one matches the Operating sheet exactly, which is the check that tells you the two sheets are wired to the same assumptions. Every later year applies one more year of growth: rent climbs by 3.0 percent, the fixed bills climb by 2.5 percent, and maintenance and management are recomputed against the new rent.
Debt service does not move. It sits at $24,682 in all ten columns, because a fixed-rate mortgage does not index to anything. That single flat row is the entire plot of the projection: NOI rises from $20,160 to $26,707 while the payment stays put, and the gap between them closes one year at a time.
| Year | Annual cash flow |
|---|---|
| Y1 | -$4,522 |
| Y2 | -$3,881 |
| Y3 | -$3,220 |
| Y4 | -$2,538 |
| Y5 | -$1,835 |
| Y6 | -$1,110 |
| Y7 | -$362 |
| Y8 | +$409 |
| Y9 | +$1,204 |
| Y10 | +$2,025 |
Seven years of feeding the property, then a crossover in year eight. No year-one tile can convey that; ten columns convey it at a glance. The grid also shows how much rides on a rent growth figure someone typed into Settings, because lowering that rate pushes the crossover later or off the grid entirely.
The debt service row also handles a loan shorter than the hold, multiplying the monthly payment by the number of payments still due in that year. A fifteen-year term still shows a full payment in year ten. A five-year term drops to zero from year six onward, and the cash flow row jumps by the whole payment.

The rental property analysis dashboard: eight tiles and a status line
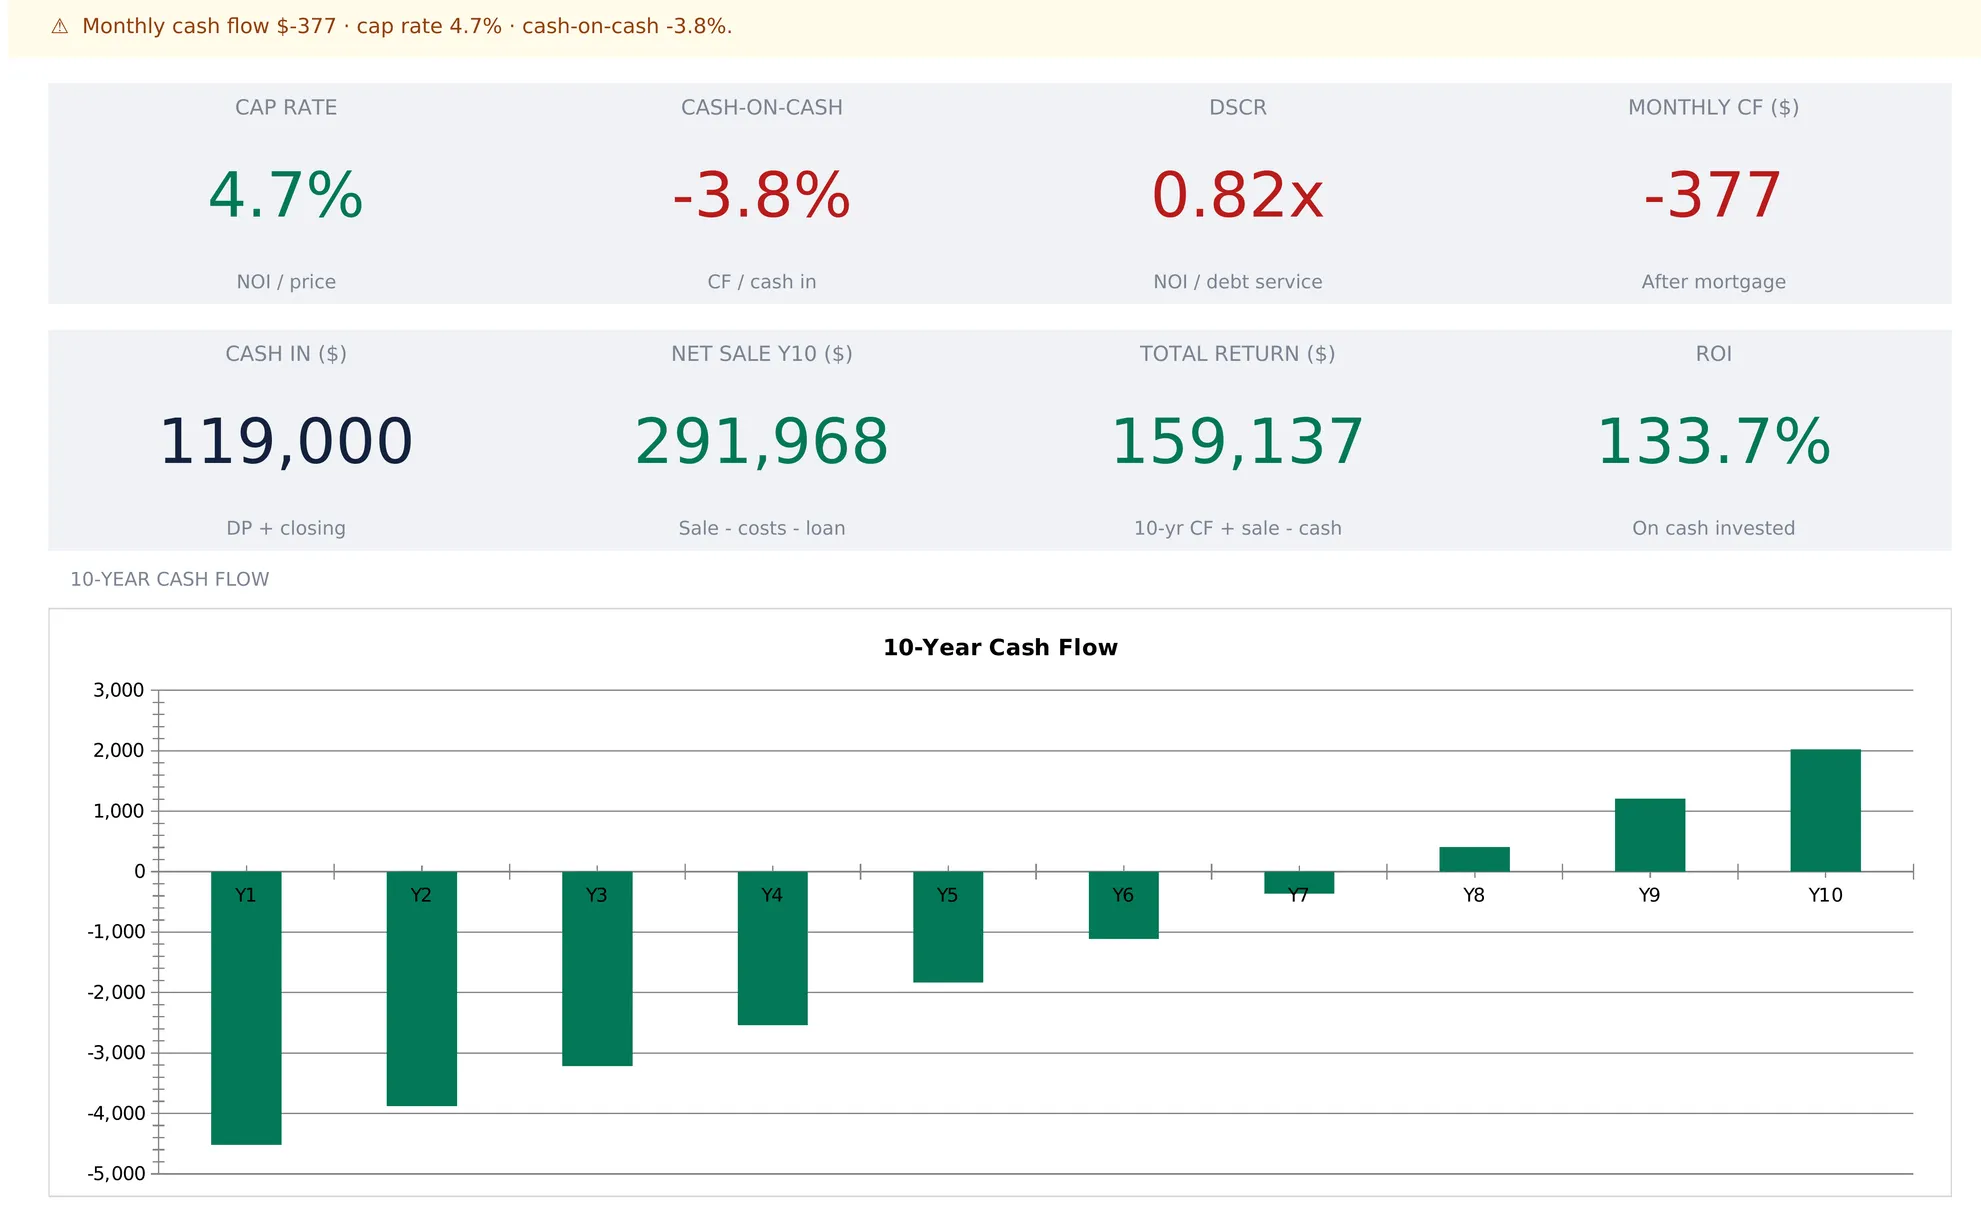
With the three input sheets filled, the Dashboard states the deal. A status line across the top gives the year one position in one sentence: monthly cash flow of $-377, a cap rate of 4.7%, a cash-on-cash of -3.8%. It carries a warning icon on an amber background because monthly cash flow is below zero, and flips to a checkmark on green the moment that figure turns positive.
The top row of tiles is the year one view: cap rate 4.7 percent, cash-on-cash minus 3.8 percent, DSCR 0.82x, monthly cash flow minus $377. The bottom row is the ten-year view: cash in $119,000, net sale at year 10 $291,968, total return $159,137, and ROI 133.7 percent. Below them, a bar chart plots the ten annual cash flows climbing out of the red, and a line chart plots cumulative NOI reaching $232,987 by year ten.
The tiles take their color from the figures themselves, green above zero and red below, rather than from a benchmark the workbook invented. DSCR is the exception, turning red below 1.00x instead of below zero, and cash in stays navy because it is neither good news nor bad.
The two rows disagree, and putting them on one screen is the point. The top row describes a property that costs its owner money every month for seven years. The bottom row describes $159,137 of total return on $119,000 of cash. Both come from the same seventeen inputs. Which one carries more weight depends on the holding period, on how much confidence the appreciation assumption deserves, and on whether a particular buyer can carry a negative monthly figure that long. A spreadsheet does not answer that. It puts both numbers where neither one can be quietly ignored.
What this model leaves out
No underwriting model is complete, and knowing the gaps is part of using one.
Everything in the workbook is pre-tax. There is no depreciation deduction, no income tax on rental profit, and no depreciation recapture at the sale. The cash flow row is pre-tax cash flow, and the 133.7 percent is a pre-tax return. IRS Publication 527 covers residential rental property including depreciation, and a tax professional can work out the after-tax picture for a specific situation.
The financing is one fixed-rate mortgage. Purchase holds a single loan amount, one rate, and one term, so an interest-only period, an adjustable rate, or a second lien has no cell to live in. The file also holds one property and one hold length: a single asset name, a single rent figure, and ten years. And the growth rates are assumptions rather than forecasts, which is a limitation of the exercise rather than of the spreadsheet, because nobody knows what rents do in year seven.
One more gap sits outside the file. The seventeen entry cells are estimates sourced elsewhere: a listing sheet for the price, local tax records for the property tax, a broker’s quote for insurance, comparable listings for the rent. The workbook computes a cap rate to one decimal place whether the rent figure came from a signed lease or a guess, and it cannot tell the two apart. Two deals are only as comparable as the sourcing behind their inputs.
Excel or Google Sheets for rental property underwriting
The template is an .xlsx file built on plain formulas, with no macros and no add-ons, so it behaves identically in Microsoft Excel and in Google Sheets after upload. That matters more here than for most spreadsheet templates, because underwriting is often a conversation. Google Sheets suits sharing a model by link with a partner, an agent, or a lender who wants to see the assumptions. Excel suits keeping a file of past deals on one machine. The structure described above is buildable by hand in either.
Which rental spreadsheet template fits which job
- Rental Property Analysis Spreadsheet Template ($59) is the workbook this walkthrough follows: purchase and financing, operating income and expenses, growth assumptions, the four ratios, a ten-year projection, and the sale at exit, for a single property before it is bought.
- Mortgage Analysis Spreadsheet Template ($29) takes the financing on its own, with a month-by-month amortization schedule and three loans compared side by side, which is the question that sits underneath the DSCR and cash-on-cash figures above.
- Once a property is owned, the job changes from projecting to recording. The free Rental Property Cashflow template covers a basic monthly log, with Essentials ($19) and Ultimate ($29) versions in the same family for more detail.
- Airbnb / STR Tracker Spreadsheet Template ($39) is the short-term rental equivalent on the tracking side, built around a bookings ledger and occupancy rather than a single monthly rent.
Related
- How to Calculate ROI on a Rental Property - the concepts behind cap rate and cash-on-cash, and the expense assumptions that drive them
- Rental Property Cash Flow Spreadsheet (Excel, Per-Unit Tabs) - tracking a property you already own, with a tab per unit
- How to Track Airbnb Income and Expenses in a Spreadsheet - the short-term rental version, with occupancy, ADR, and RevPAR
Frequently asked questions
What does cap rate tell you that cash-on-cash does not?
Cap rate is annual net operating income divided by purchase price, and it ignores financing. Two buyers paying the same price for the same rent get the same cap rate whatever their loans look like. Cash-on-cash divides annual cash flow after the mortgage by the cash invested, so it moves with the loan terms. In the sample duplex the two read 4.7 percent and minus 3.8 percent on the same property in the same year, and the distance between them is the mortgage. Cap rate is a per-deal calculation rather than a benchmark, and the workbook computes it without measuring it against any target figure. What counts as an ordinary cap rate differs by market and by property type, which is information a local source supplies rather than a spreadsheet.
What does a DSCR below 1.00x mean?
DSCR is annual NOI divided by annual debt service. The sample duplex produces $20,160 of NOI against $24,682 of mortgage payments, which is 0.82x. The property's operating income covers 82 percent of its own loan payments, and the rest comes from the owner's pocket. The dashboard tile turns red below 1.00x for that reason. Lenders set their own minimums, and those minimums differ by loan program and property type.
Can a rental have negative cash flow and still show a positive ten-year ROI?
Yes, because the two measure different things over different windows. In the sample duplex, monthly cash flow of minus $377 is year one after the mortgage, while the 133.7 percent is total return across a full ten-year hold. That return is driven by the sale: $291,968 of net proceeds against $119,000 of cash invested, less $13,831 of cumulative negative cash flow along the way. It is a cumulative figure over ten years rather than an annual rate, and it rests on the appreciation assumption typed into Settings.
Can one spreadsheet analyze more than one rental property?
One property per file. Settings holds a single asset name and Operating holds a single monthly rent figure, so a duplex is entered as combined rent for both units rather than unit by unit. A second property is a second copy of the file. Some investors comparing several deals keep one copy per address and read the dashboard tiles side by side.
Can the hold period be something other than ten years?
The workbook is built around a ten-year hold. The projection grid runs Y1 to Y10, the sale block applies ten years of appreciation, and the loan balance amortizes 120 payments. A shorter hold can still be read off the projection's cash flow row year by year, but the sale figures and the total ROI are computed at year 10.
Sources
- About Publication 527, Residential Rental Property (Including Rental of Vacation Homes) - Internal Revenue Service
About this article
Every figure, sheet name, formula, and feature description verified against the published Rental Property Analysis Pro workbook (the exact file customers download). IRS Publication 527 reference checked against the live IRS page at writing time. Last reviewed August 2026.