A loan amortization schedule turns a handful of inputs, the balance, the rate, and the term, into a month-by-month table showing how each payment splits between interest and principal until the balance reaches zero. This walkthrough builds one from a two-loan sample, a $250,000 mortgage at 6.5% and a $22,000 car loan at 5.9%, then adds an extra-payment model and a combined dashboard. The Loan Amortization Ultimate ($29) ships the whole structure ready-made for Excel and Google Sheets.
A loan looks simple from the outside. You borrow an amount, you pay a fixed sum every month, and one day it is gone. What that flat monthly figure hides is a moving split. Early on, most of the payment is interest and only a sliver touches the balance. Years later the same payment is nearly all principal. The table that shows this split, month by month, from the first payment to the last, is a loan amortization schedule, and a spreadsheet is the natural place to build one.
The reason is that an amortization schedule is almost entirely derived. You type a few inputs, the balance, the rate, and the term, and every row after that follows from the row above it by the same two-line rule. The examples below come from our Loan Amortization Ultimate Spreadsheet Template ($29), which ships the whole structure ready-made for Excel and Google Sheets. It carries two loans at once, a mortgage and a car loan in the sample, with a dated schedule for each, a combined summary, an extra-payment model, and a dashboard on top. The layout is reproducible by hand if you would rather build your own.
What a loan amortization schedule actually is
Strip a loan down and there are only two quantities that change each month: the interest charged and the balance owed. Everything else is bookkeeping around those two.
Interest for a month is the balance at the start of that month multiplied by the monthly rate, which is the annual rate divided by twelve. Because the payment is fixed, whatever is left after covering interest reduces the balance. The Consumer Financial Protection Bureau puts it plainly: “Most of your monthly payment is applied to the interest you owe, and the remainder is applied to paying off the principal,” and “over time, as you pay down the principal, you owe less interest each month, because your loan balance is lower.” That falling interest is why the principal share of a fixed payment grows on its own, with no change to the payment itself.
Amortization is simply the name for that process. In the CFPB’s words, “amortization means paying off a loan with regular payments, so that the amount you owe goes down with each payment.” A schedule makes the words concrete by writing out every one of those payments as a row.
This is also why a spreadsheet fits the job so well. Each row depends only on the balance the row above it left behind, which is exactly the kind of running calculation a spreadsheet does without complaint. Type the balance, the rate, and the term once, and the first row computes its interest, its principal, and the balance it passes down. The second row reads that balance and repeats the same three steps, and so on until the balance runs out. There is no separate formula per month to maintain; it is one rule copied down a column. Change any input at the top and the whole table, and every total and chart that reads from it, recomputes at once. That single-source design is worth holding onto whether you buy the template or build your own, because it is what keeps a schedule from drifting out of sync with itself.
Start with the inputs: the Loan Setup sheet
Loan Setup is where the small number of typed figures live, and it comes first because everything downstream reads from it. The sheet has two identical blocks, Loan 1 and Loan 2, then a portfolio summary that adds them together.
Each loan block asks for the same handful of inputs. In the sample, Loan 1 is labeled Mortgage with a current balance of $250,000, an annual interest rate of 6.5%, a term of 360 months, a start date of August 2026, and an extra monthly payment of $100. Loan 2 is labeled Car Loan at a $22,000 balance, 5.9%, a 60-month term, the same August 2026 start, and a $50 extra monthly payment. The loan name is a free label, so Mortgage and Car Loan flow through to every sheet and chart title automatically.
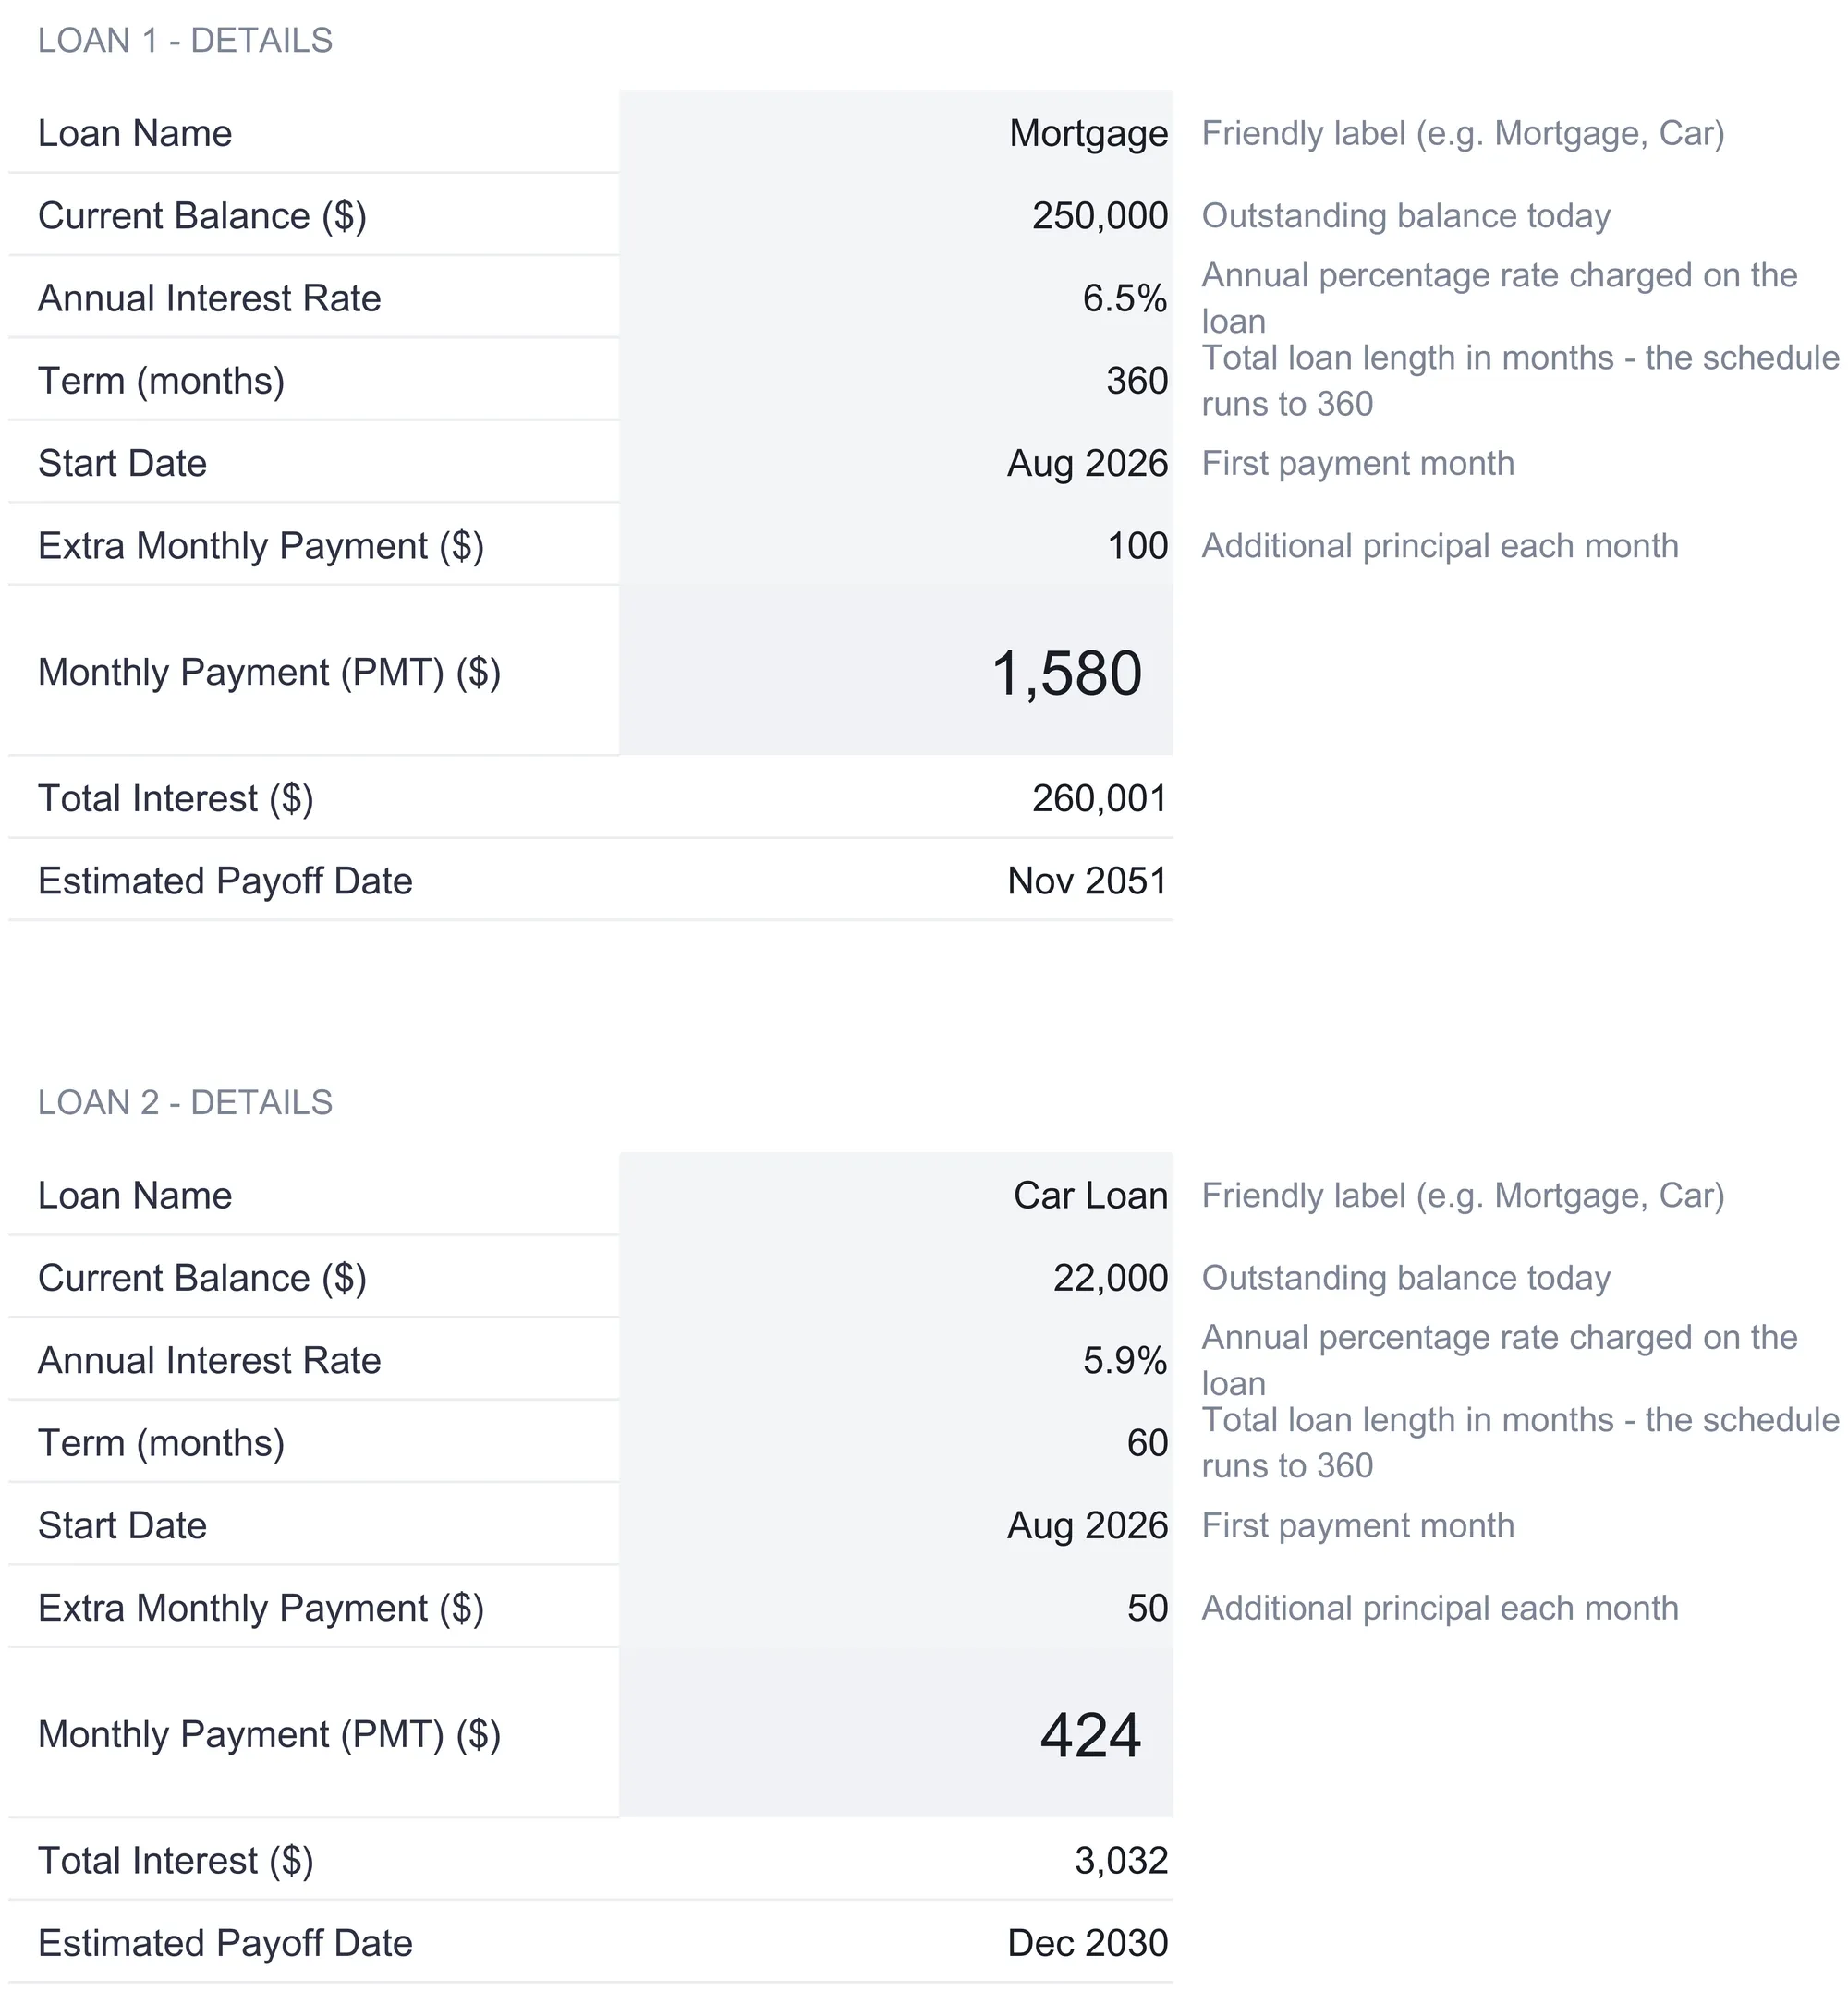
Below the inputs, three cells are computed. The first is the monthly payment. This is the one figure that looks like it needs a calculator, and in a spreadsheet it does not, because the payment is exactly what the PMT function returns. Written out, that is =PMT(rate/12, months, -balance), and the workbook uses the closed-form version of the same standard formula, the balance times the monthly rate, divided by one minus the compounding factor over the full term. For the mortgage, $250,000 at 6.5% over 360 months resolves to a monthly payment of $1,580.17. For the car loan, $22,000 at 5.9% over 60 months resolves to $424.30. The other two computed cells, total interest and estimated payoff date, are pulled back from the amortization schedule once it is built, so they reflect the extra payments rather than the plain term.
One setting sits outside Loan Setup: the currency dropdown on the Dashboard, which relabels every money column across the workbook. It relabels only, with no conversion of the underlying numbers, so switching the symbol changes how the figures read without touching what they are. Loan Setup still holds every typed loan input in one place, which is the discipline the rest of the file depends on. When the mortgage’s balance or rate changes here, both schedules, the summary, the impact grids, and the dashboard follow from it, and no figure is entered twice anywhere else to fall out of step.
The portfolio summary at the bottom of the sheet stacks the two loans. It reports a total loan balance of $272,000, a combined base monthly payment of $2,004.47, total interest across both loans of $263,032.90, and a weighted average interest rate of 6.45%, which blends the two rates in proportion to their balances rather than averaging them evenly. Because the mortgage dwarfs the car loan, that blended rate sits close to the mortgage’s 6.5%.
The month-by-month schedule: the Amortization sheets
Each loan gets its own dated schedule sheet, one per loan, following the naming pattern Amortization - Loan 1. This is the amortization schedule proper, and it is where the interest-versus-principal split becomes visible one line at a time. Every cell here is computed from Loan Setup and from the row above; nothing on the sheet is typed.
The columns read across as payment number, date, payment, principal, interest, extra payment, total payment, and remaining balance. The first row of the mortgage schedule makes the mechanics concrete. Payment one falls in August 2026. Interest for the month is the $250,000 balance times the monthly rate, which comes to $1,354.17. The scheduled payment is $1,580.17, so principal is the remainder, $226.00. The extra payment column adds the $100 from Loan Setup, and together the $226.00 of scheduled principal plus the $100 extra bring the balance down to $249,674.00. The total payment column shows the full $1,680.17 leaving the account that month.
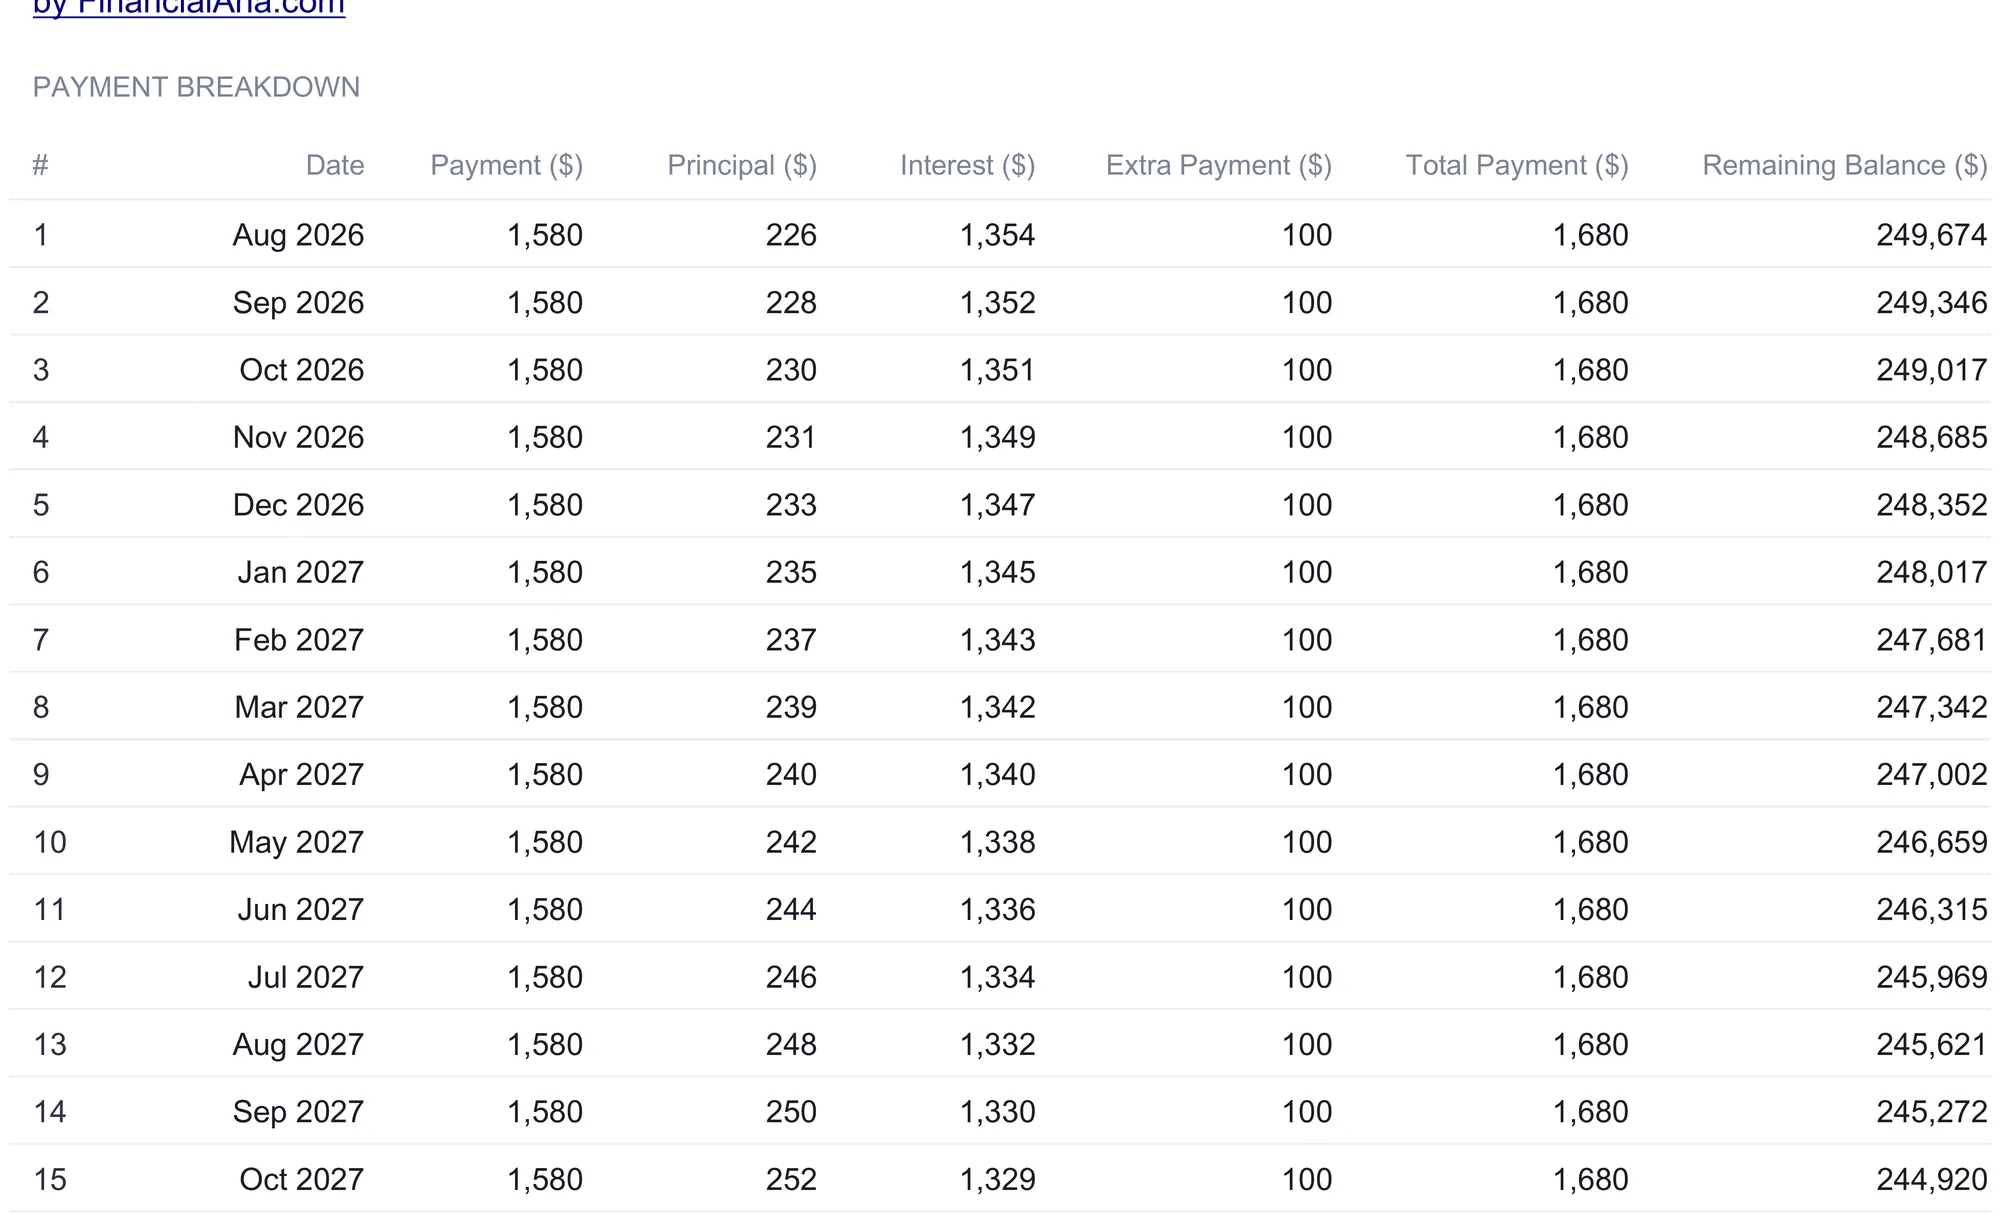
Watch the second row and the pattern reveals itself. With the balance now $249,674.00, month two charges slightly less interest, $1,352.40, so slightly more principal, $227.77, comes off. Nothing about the payment changed. The principal share grew purely because the balance shrank. Repeat that for a few hundred rows and the split tips all the way over. By the closing months of the mortgage the payment is almost entirely principal and the interest line is down to a few dollars.
Two design details are worth copying into any hand-built version. First, the schedule runs on a fixed grid of 360 rows, and each row is gated: a payment number only appears if the previous balance is still above zero and the term has not been exceeded. When a loan is paid off, the remaining rows simply go blank rather than showing negative balances. That is why the car loan, on its own 360-row sheet, stops producing rows after its balance hits zero.
Second, the extra payment is genuine principal, added on top of the scheduled amount. The effect is quiet on any single row and dramatic in aggregate. With the $100 monthly extra, the sample mortgage reaches a zero balance at payment 304, in November 2051, rather than running the full 360 payments. That is 56 months, more than four and a half years, removed from the end of the schedule. Over the life of the loan those extra dollars cut the mortgage’s total interest from about $318,861, the figure the base payment alone would generate across the full 360 months, down to the $260,001 the schedule actually records, a difference of roughly $58,860 in interest never charged.
The second loan reads the same way
The car loan’s schedule is built identically, and putting the two side by side is instructive because the term is what changes the shape. Payment one falls in August 2026 with a $424.30 payment. Interest on the $22,000 balance is $108.17, principal is $316.13, and with the $50 extra the balance drops to $21,633.87. Right from the first row, three-quarters of the payment is already reducing principal, where on the mortgage that same month only about a seventh of the payment did.
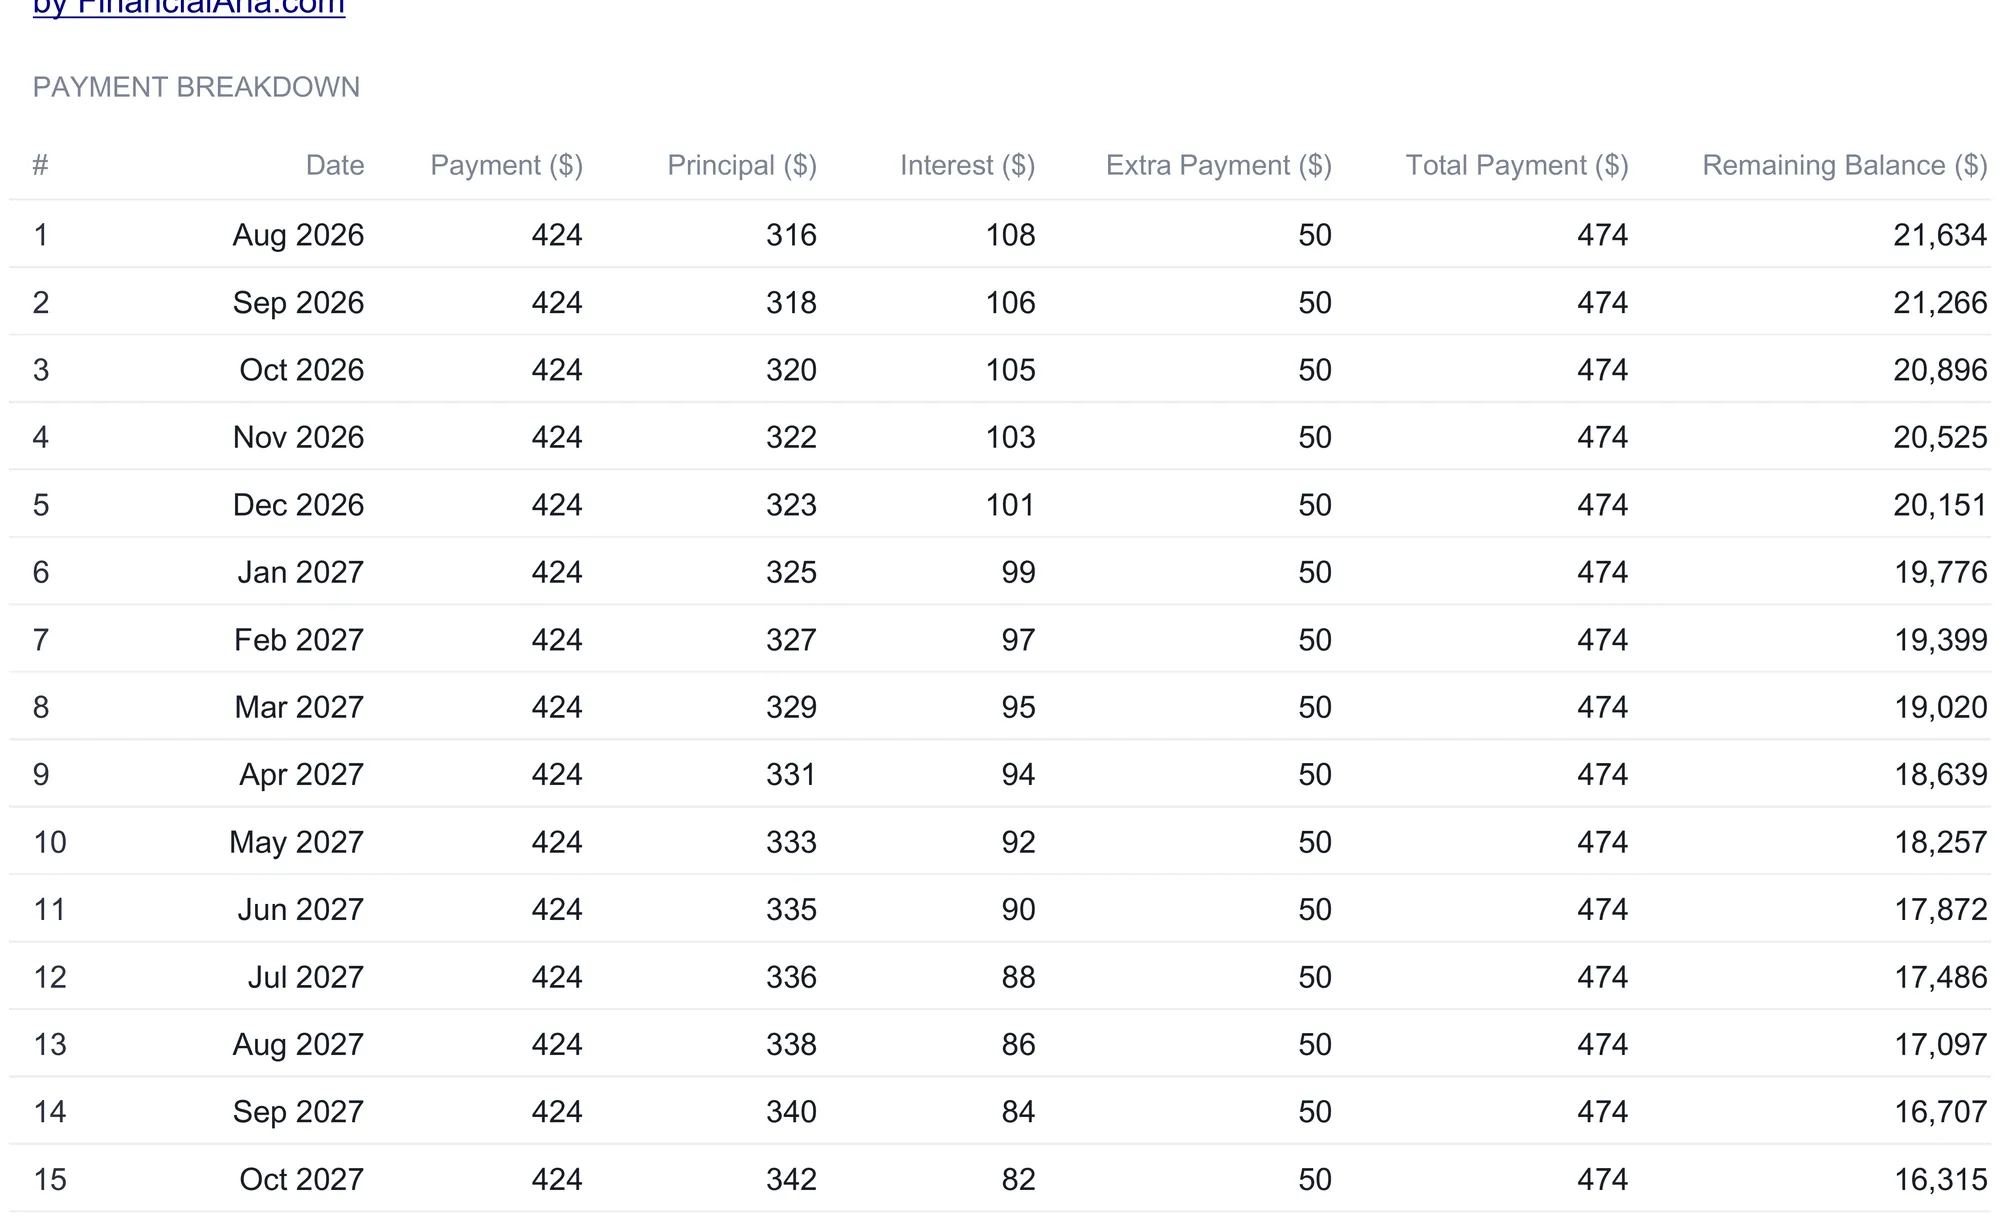
That difference is not about the rates, which are close, 6.5% against 5.9%. It is about the term. A five-year loan compresses the same interest-to-principal handover into sixty rows, so the crossover happens almost immediately and the interest column is small throughout. A thirty-year loan stretches the handover across 360 rows, which is why so much of an early mortgage payment is interest. Two loans on two schedules, with the same columns and the same rule, make that contrast plain. With its $50 extra, the car loan ends at payment 53 in December 2030 instead of month 60. Neither payoff date is typed anywhere; both fall out of the point where each schedule’s balance column reaches zero.
One place for the combined picture: the All Loans Summary sheet
With two loans running, the question a borrower actually asks is not “what does the mortgage cost?” but “what am I paying every month, and what will these loans cost me in total?” The All Loans Summary sheet answers both by pulling live from Loan Setup and laying the two loans side by side.
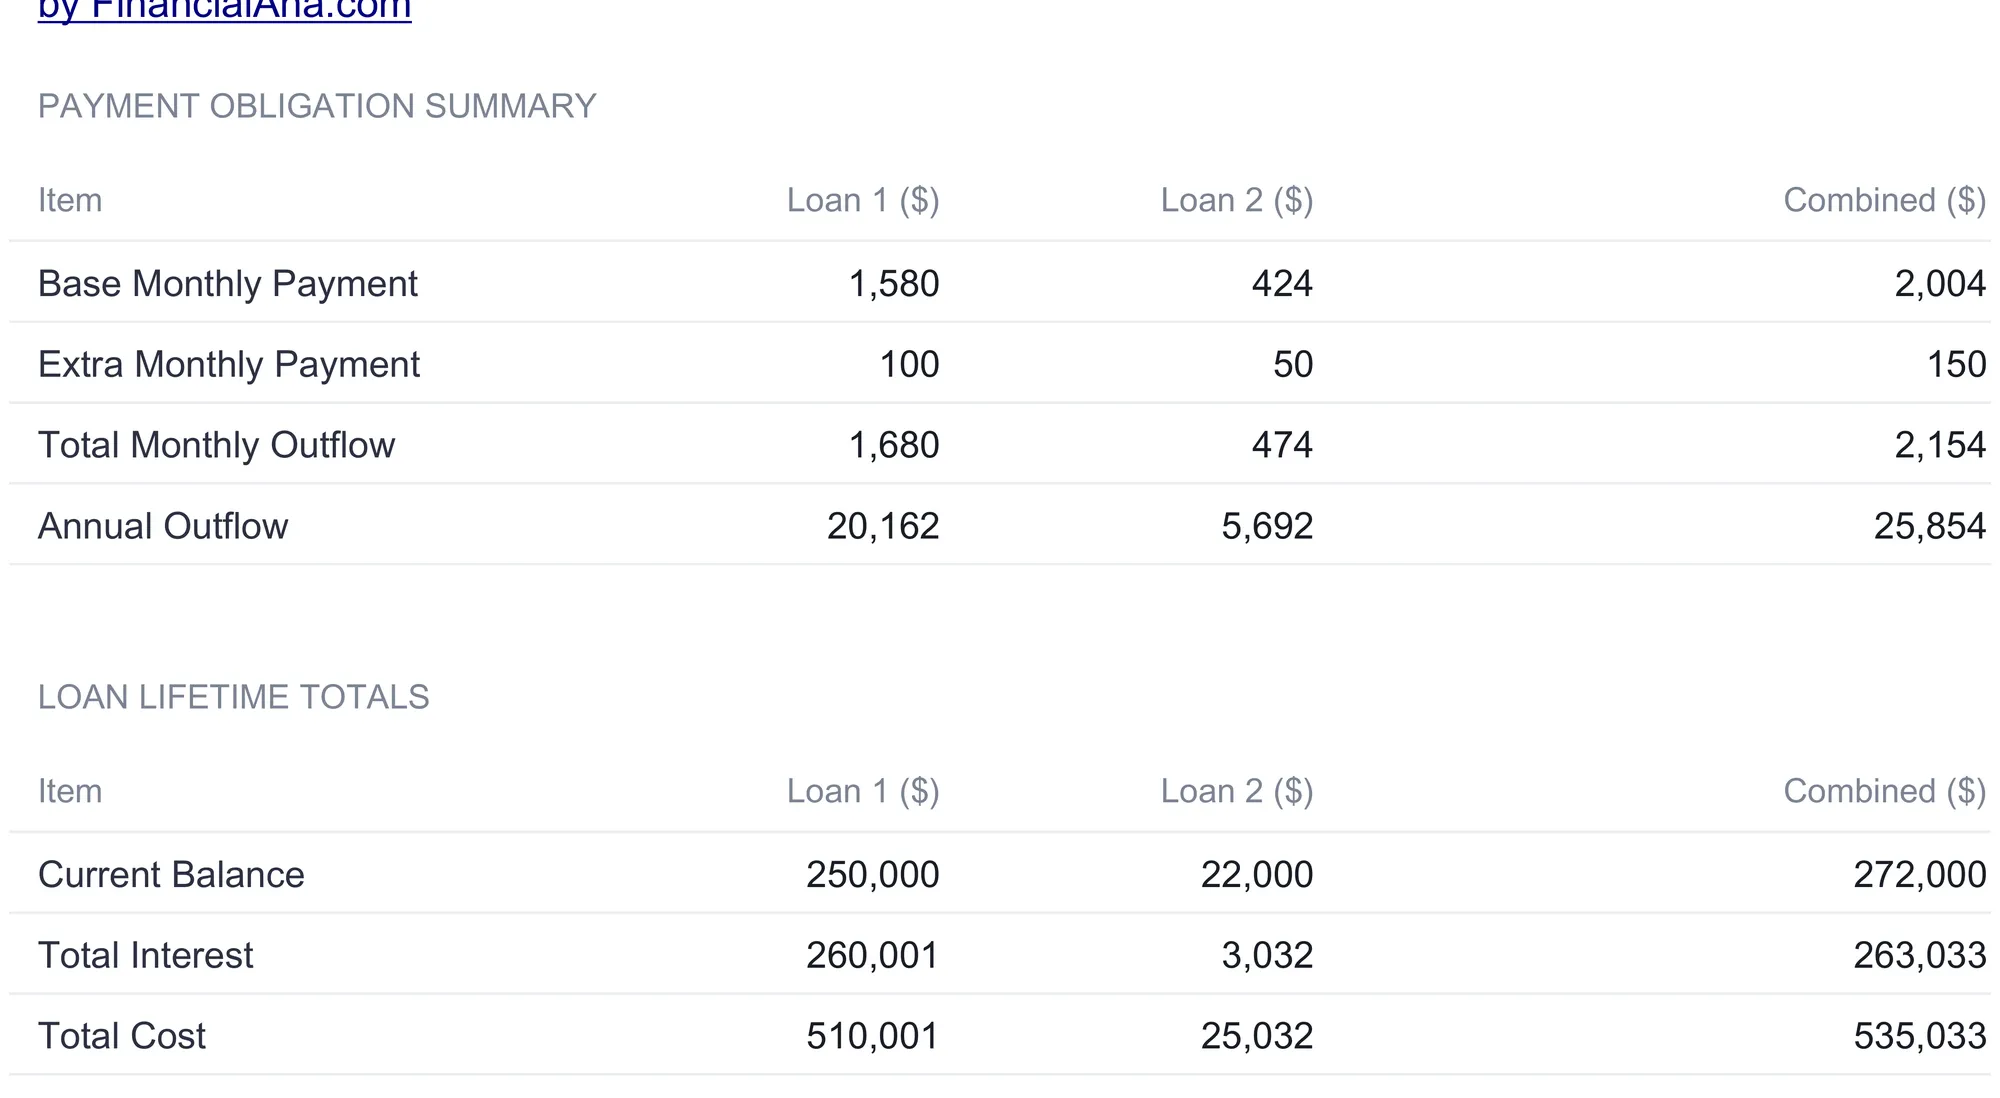
The top block, the payment obligation summary, separates the base payment from the extra. The base monthly payments are $1,580.17 and $424.30, combining to $2,004.47. The extra payments of $100 and $50 add $150, so the total monthly outflow is $1,680.17 and $474.30, or $2,154.47 combined. Multiplied out, that is an annual outflow of $20,162.04 on the mortgage and $5,691.60 on the car loan, $25,853.64 together, on the assumption that the same total payment goes out for all twelve months.
The lower block, loan lifetime totals, is the number that never shows up on a statement. Total cost is the current balance plus all the interest paid over the life of the loan. For the mortgage that is $250,000 plus $260,001.40 of interest, a total cost of $510,001.40. The car loan’s total cost is $25,031.50. Combined, the two loans will move $535,032.90 out the door before they are gone. Seeing the interest total, $263,032.90, sit right next to the $272,000 that was actually borrowed is the whole reason to lay a loan out this way.
Modeling extra payments: the Extra Payment Impact sheet
The dated schedules show what one specific extra payment does. The Extra Payment Impact sheet asks the broader question: how does the payoff change as the extra amount and the starting balance both move? It answers with two grids, and it does so without touching the inputs on Loan Setup, so it works as a pure what-if.
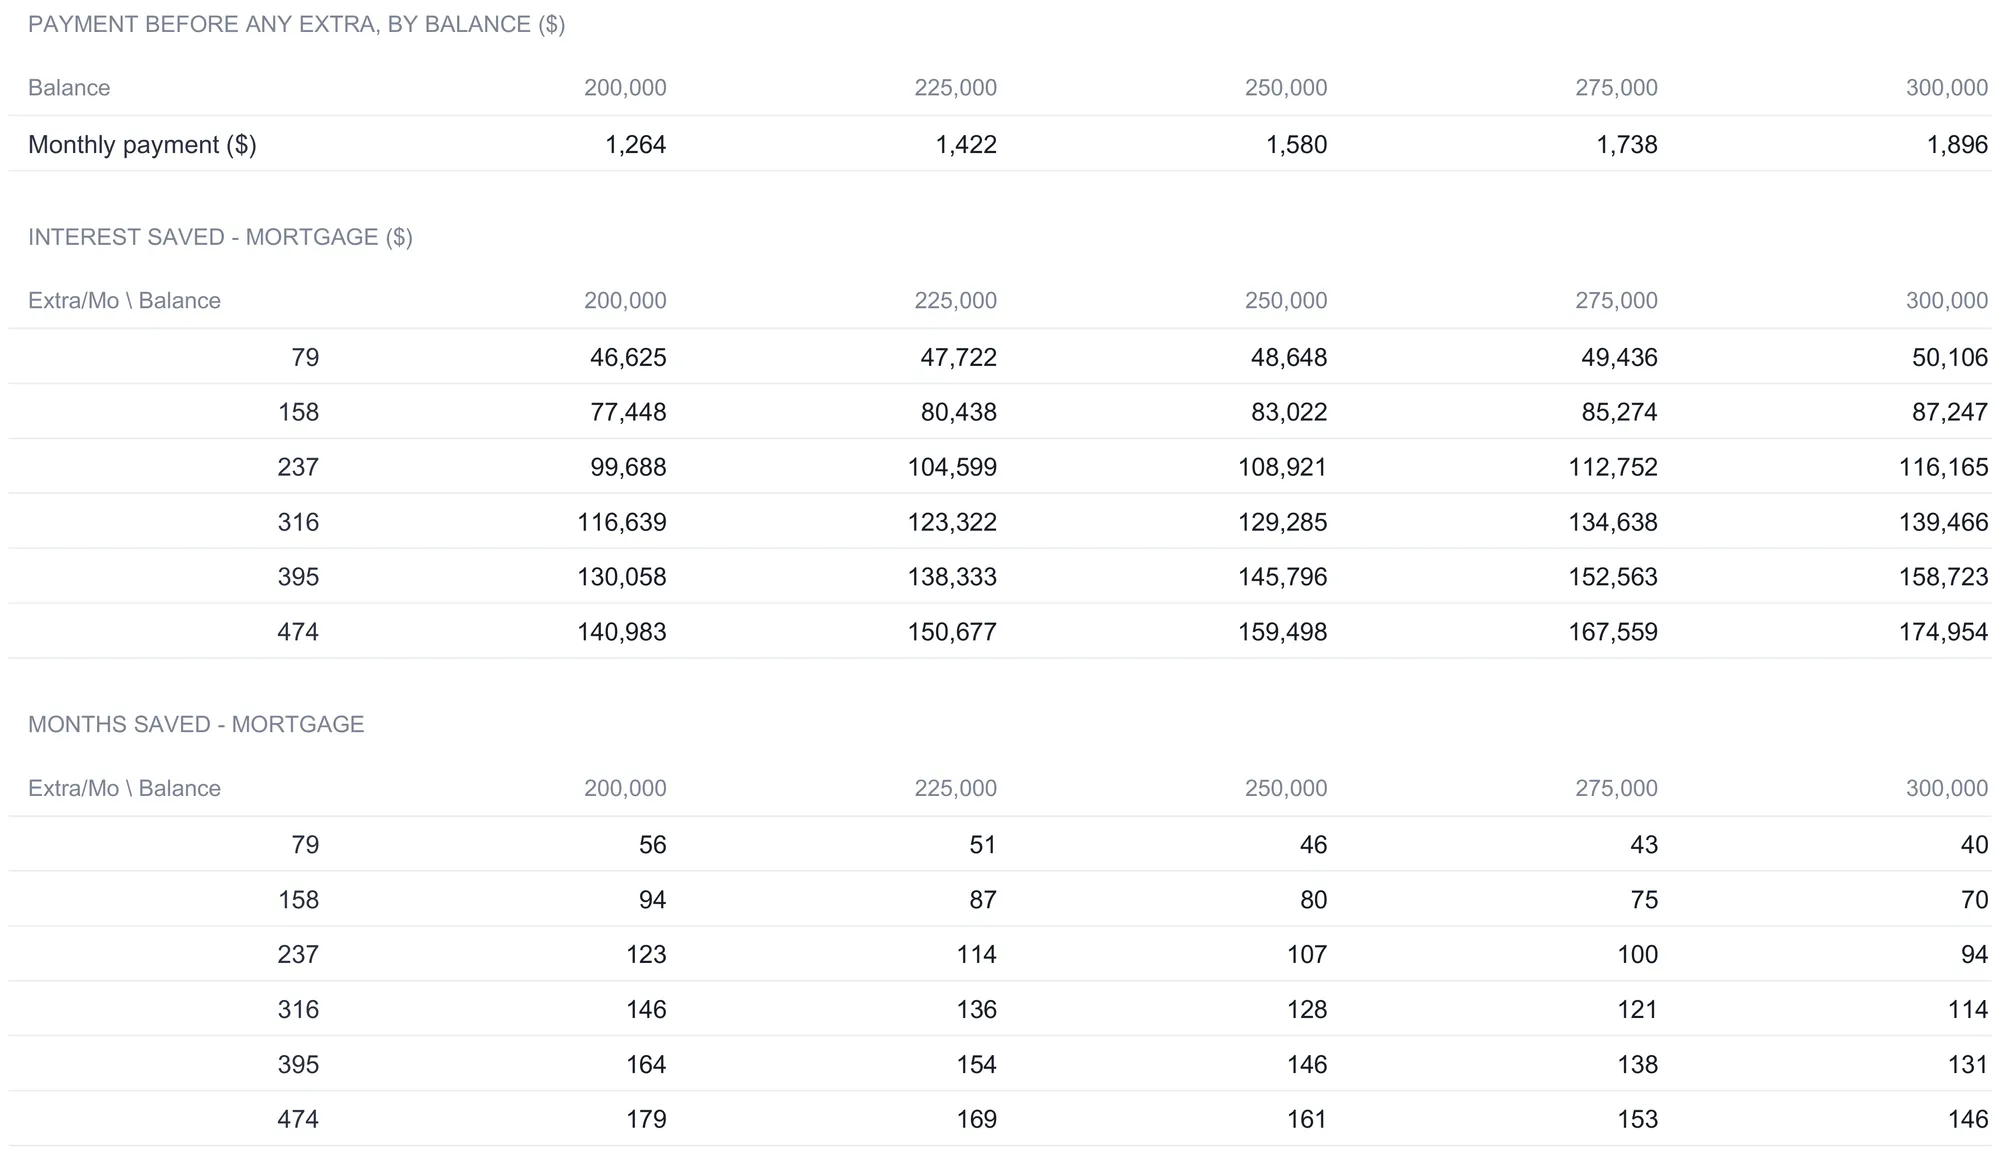
A short row at the top sets the baseline before any extra enters the picture. It lists the plain monthly payment at each of the five starting balances, from $1,264.14 at a $200,000 balance up to $1,896.20 at $300,000, all at the mortgage’s rate and term. That row is the reference point the two grids below measure their savings against, so it is worth reading first.
Reading the grids takes a moment because both axes vary. Down the side, each row is an extra payment sized as a share of the mortgage’s own monthly payment, in steps of 5%, 10%, 15%, 20%, 25%, and 30%, which for the sample’s $1,580.17 payment works out to $79, $158, $237, $316, $395, and $474 a month. Across the top, each column is a starting balance running from 80% to 120% of the mortgage’s current balance, so $200,000 through $300,000 in $25,000 steps. Both grids use the mortgage’s rate and term, 6.50% over 360 months.
The first grid reports interest avoided over the life of the loan. At the sample’s actual $250,000 balance, an extra $79 a month saves $48,648 in interest, an extra $158 saves $83,022, and an extra $237 saves $108,921. The second grid reports the same scenarios as months removed from the term: $79 a month shortens the loan by 46 months, $158 by 80 months, and $237 by 107 months. A note on the sheet flags the key non-linearity, that the saving does not scale one for one, because doubling the extra payment adds less than double the interest saved. The grid solves for the payoff month directly, so its figures can sit about a month away from the dated schedule, which rounds every payment to the cent. That is why the grid and the schedule work as two lenses on the same loan rather than as figures that must match to the dollar.
The dashboard: the combined verdict
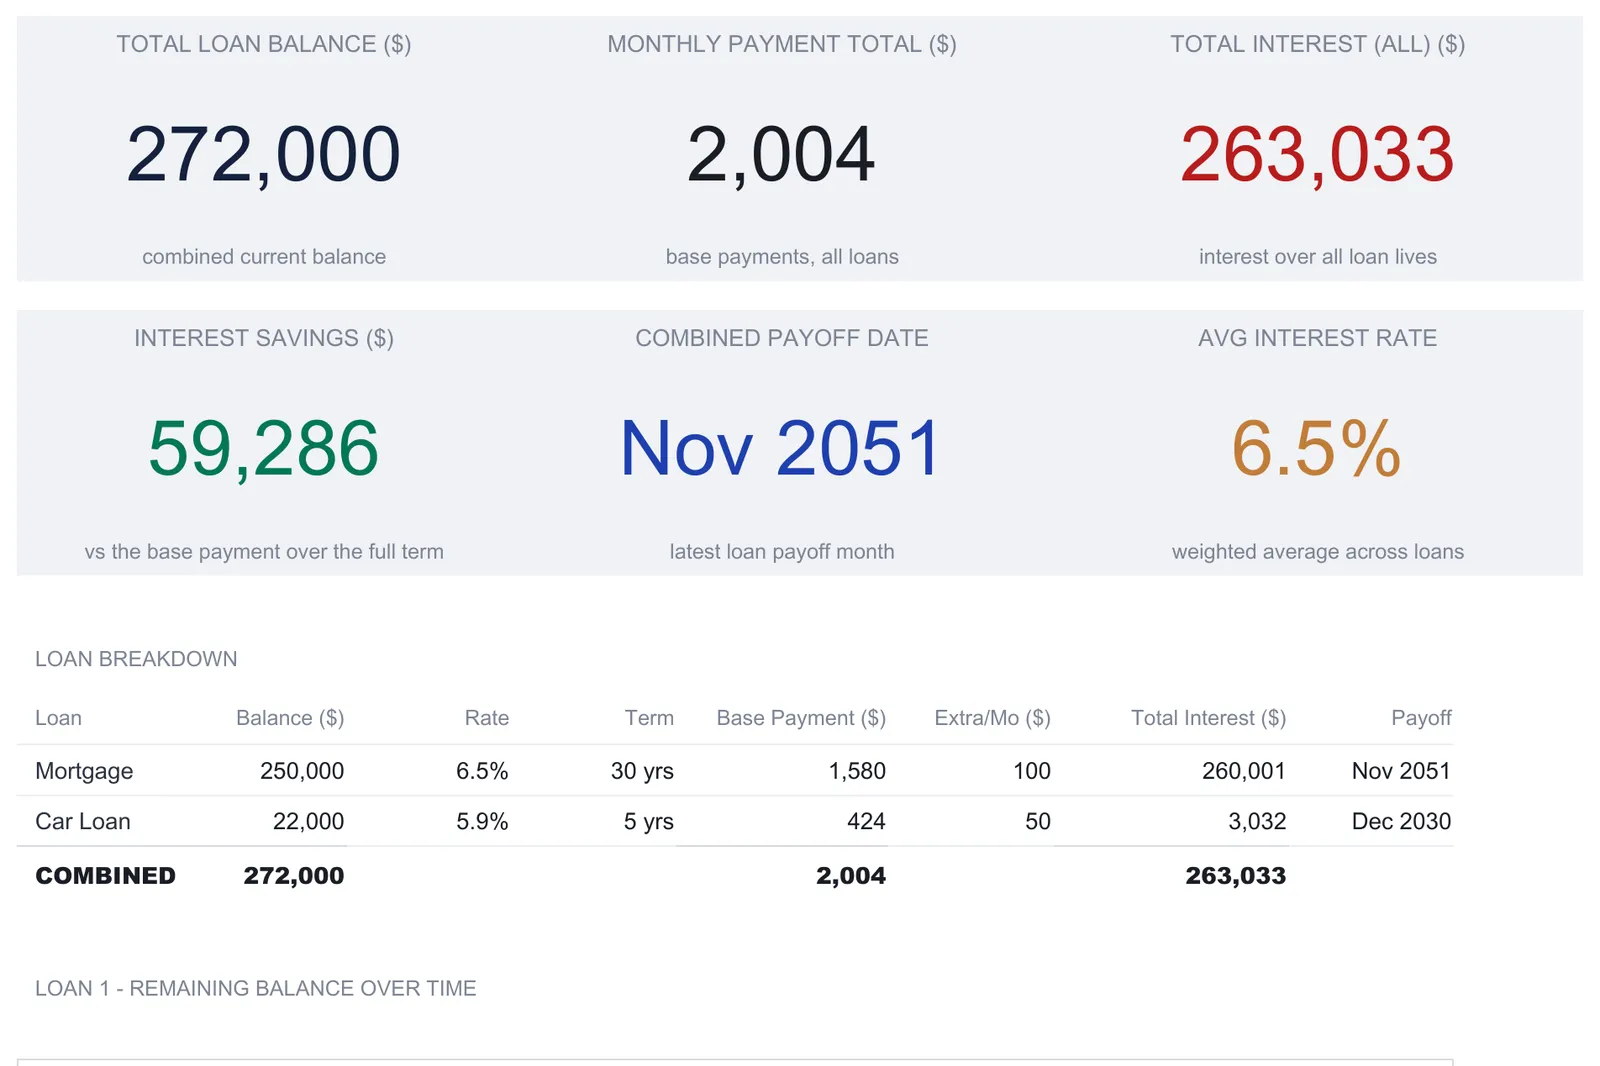
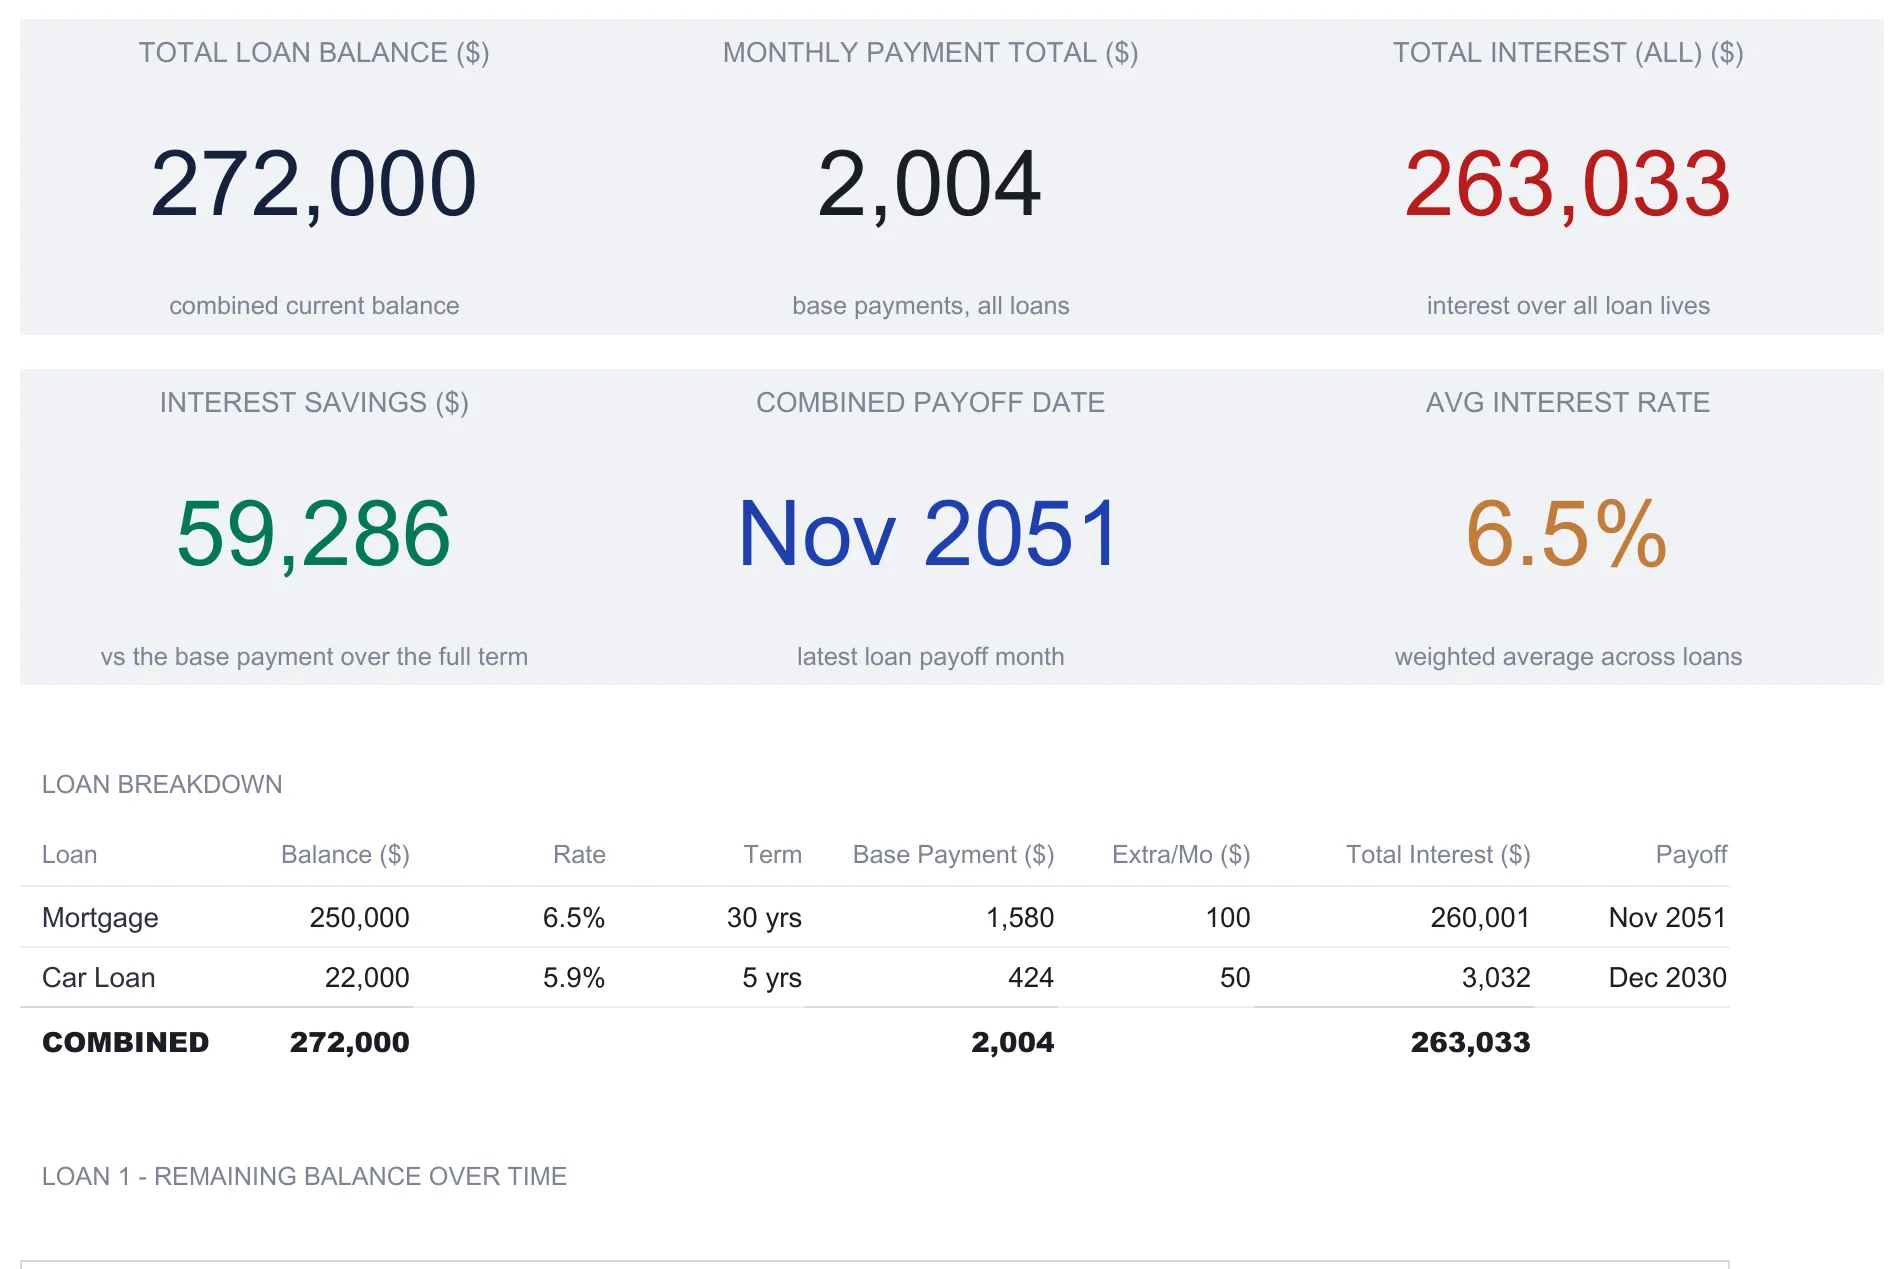
The dashboard sits on top and reduces the two loans to six numbers and two charts. Its tiles read a total loan balance of $272,000, a monthly payment total of $2,004.47, total interest across both loans of $263,033, interest savings of $59,286, a combined payoff date of November 2051, and an average interest rate of 6.5%.
Two of those deserve a plain-terms note. The interest savings tile, $59,286, is measured against the base payment carried over the full term, so it is the combined effect of both extra payments: roughly $58,860 on the mortgage and the rest on the car loan. The combined payoff date is the later of the two loan payoffs, November 2051, since that is when the last of the two balances clears. The average interest rate is the weighted 6.45% from Loan Setup, shown rounded to 6.5% on the tile.
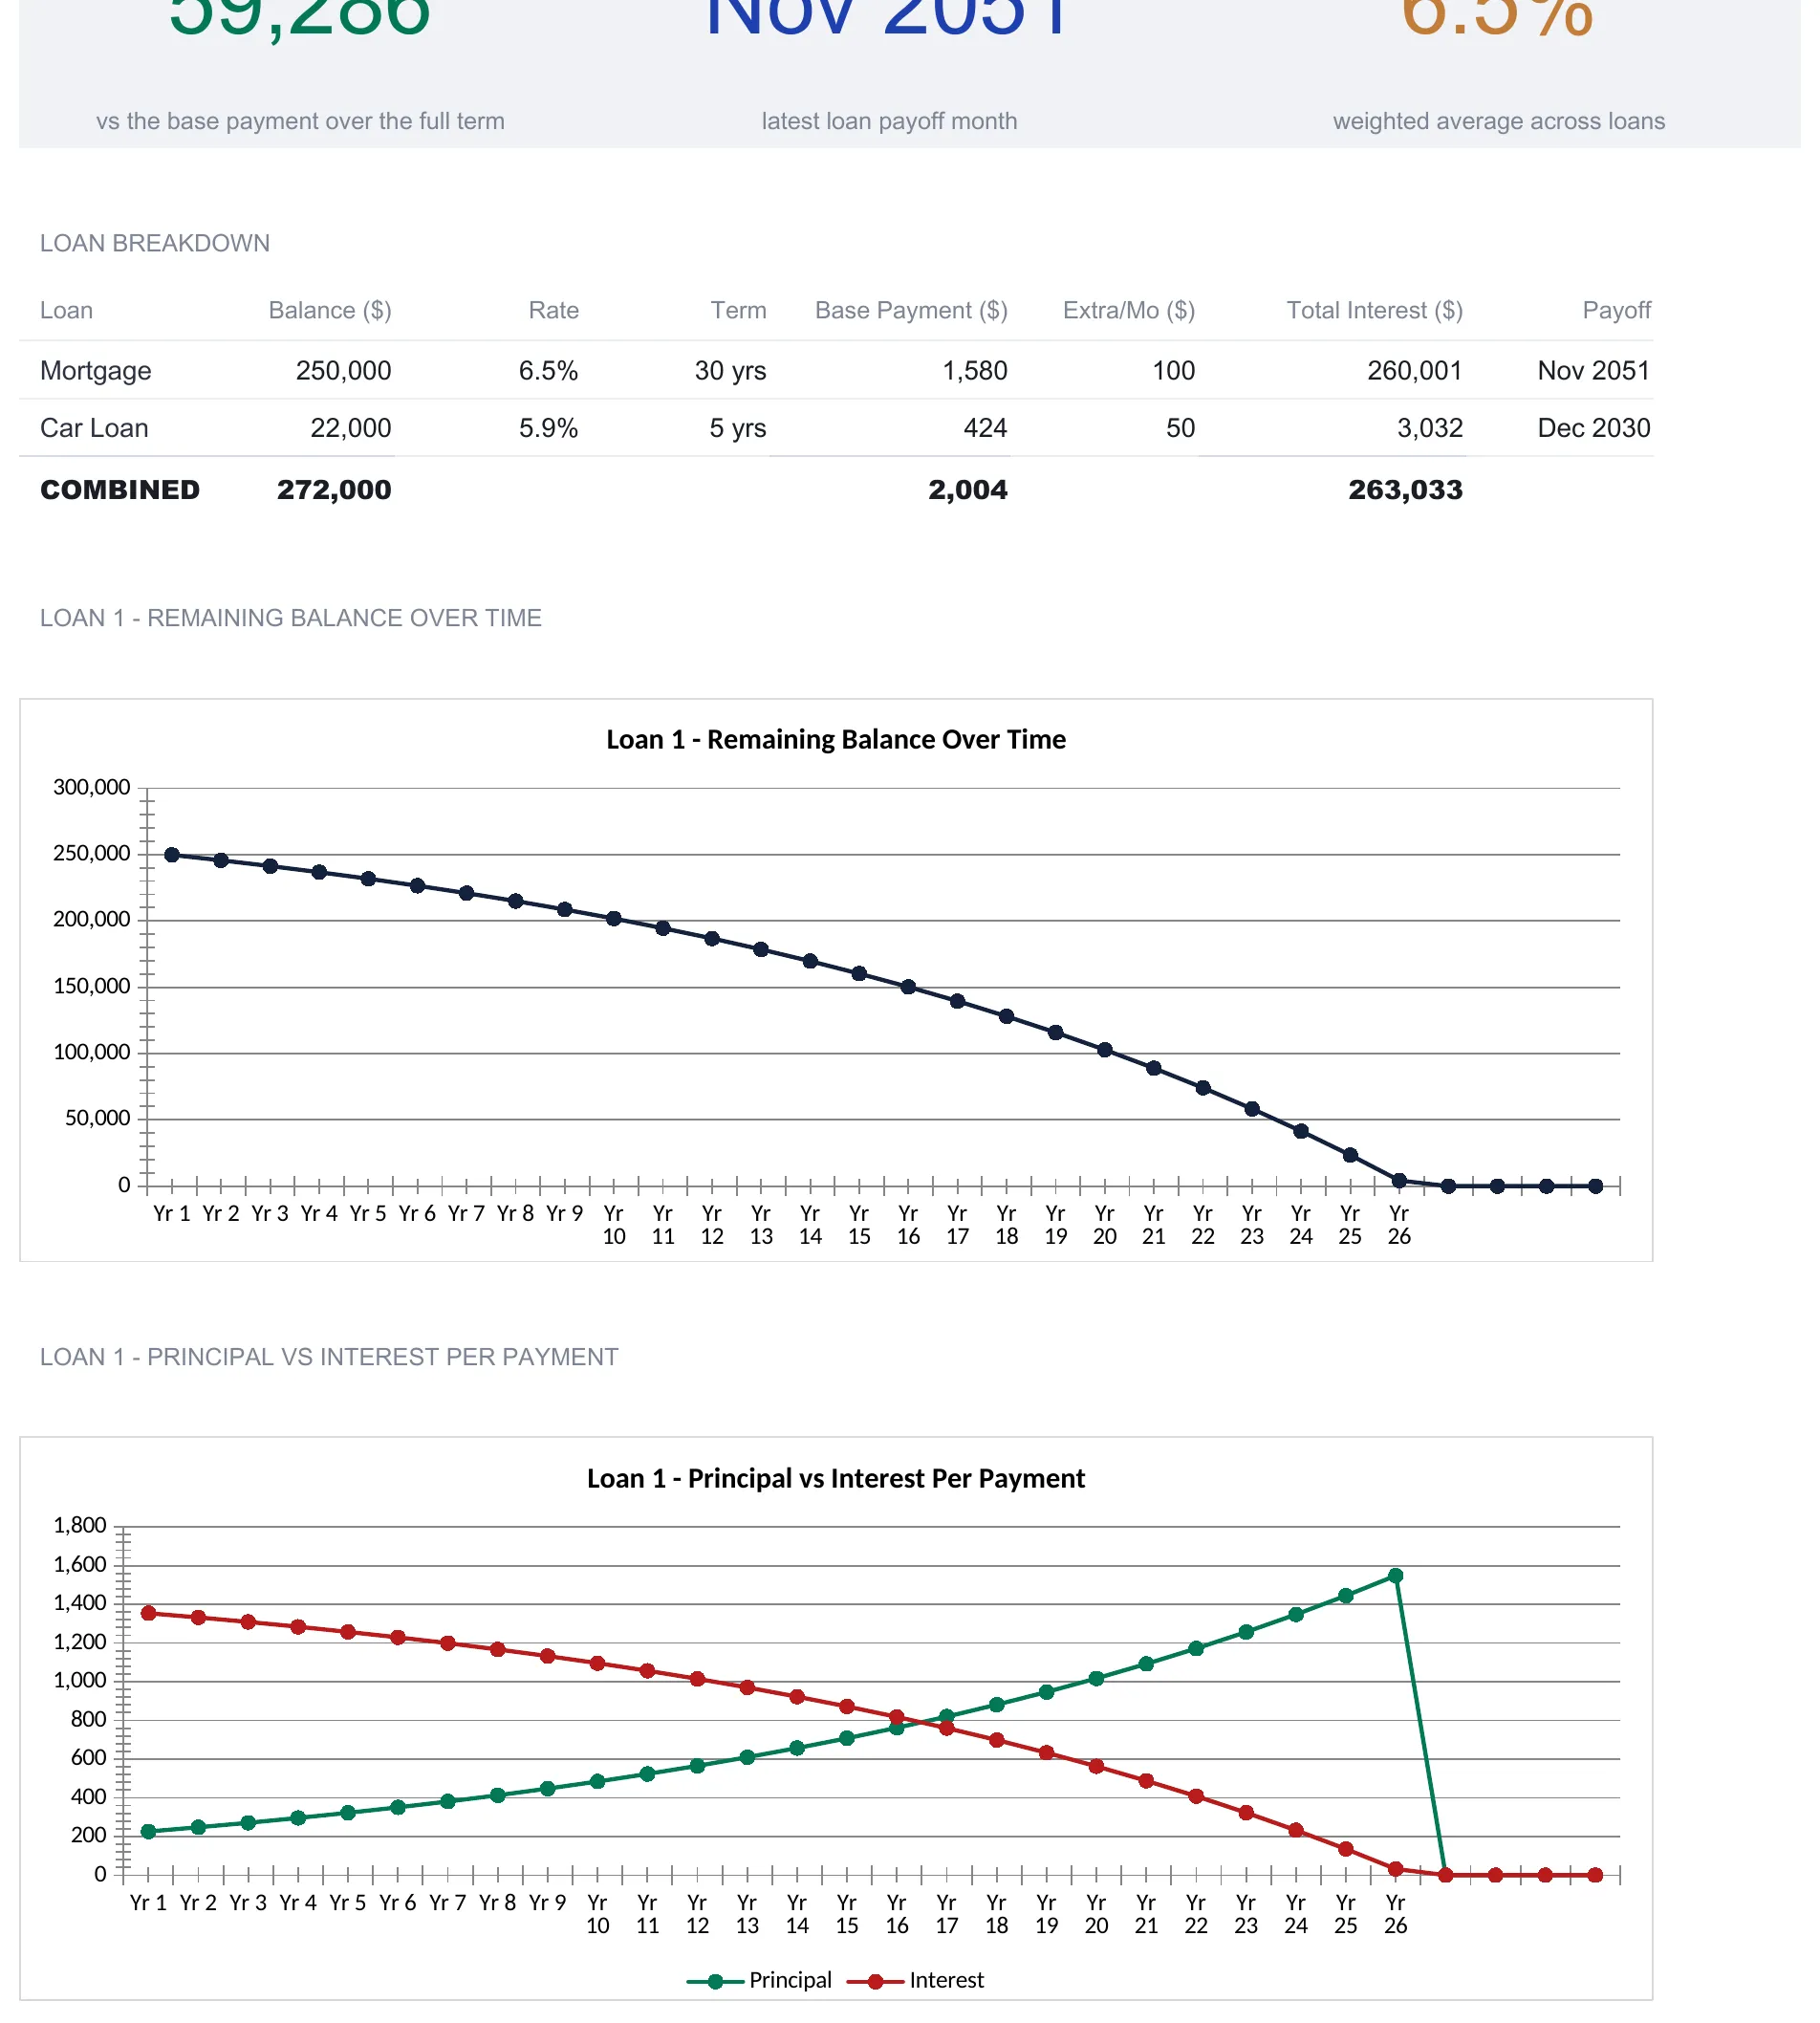
Below the tiles, a loan breakdown table restates each loan on one line, the mortgage at $250,000, 6.5%, 30 years, a $1,580 base payment, $100 extra, $260,001 total interest, and a November 2051 payoff, and the car loan at $22,000, 5.9%, 5 years, $424, $50, $3,032, and December 2030. A combined row totals the balance, payment, and interest.
The two charts both track the mortgage, which is the larger loan. The first plots its remaining balance year by year, a curve that starts nearly flat and steepens as the growing principal share eats into the balance faster each year, reaching zero around year 26. The second is the one that makes amortization click. It plots principal and interest per payment on the same axes. The principal line rises from $226 at the start; the interest line falls from $1,354. They cross a little past the loan’s midpoint, and from that point on each payment does more to shrink the balance than to service it. That single crossing is the shape every amortized loan shares.
Principal, interest, and amortization in plain terms
Three words carry all the weight, and each is simpler than it sounds.
Principal is the amount still owed. It starts at the balance you borrowed and is the only thing an extra payment reduces directly.
Interest is the rent on that principal for one month, the balance times the annual rate divided by twelve. In the sample mortgage’s first month that rent is $1,354.17. It is not a fixed fee; it falls automatically as the principal falls.
Amortization is the arrangement that lets a fixed payment cover a shrinking interest charge and a growing principal repayment at the same time, so the loan lands exactly on zero at the end of its term. The schedule is just that arrangement written out in full.
Because interest is charged only on what remains, an extra payment does two things at once. It removes principal now, and it removes all the future interest that principal would have generated, which is why the interest-saved figures dwarf the extra dollars put in. That compounding effect is what the Extra Payment Impact grids quantify, and it is a property of the loan math, not a feature the spreadsheet invents.
Excel or Google Sheets for a loan amortization schedule
The template is an .xlsx file built on ordinary formulas, IF, MIN, MAX, ROUND, and a running-balance reference to the row above, with no macros and no add-ons, so it behaves identically in Microsoft Excel and in Google Sheets after an upload. The two amortization schedules recalculate the moment any input on Loan Setup changes, and the dashboard and summary follow. Excel suits anyone who keeps a local file; Google Sheets suits anyone who wants the same workbook open on a phone. The structure described here, one setup sheet feeding two dated schedules, a combined summary, an extra-payment model, and a dashboard, is buildable in either.
Which loan template fits
- Loan Amortization Ultimate Spreadsheet Template ($29) is the workbook this walkthrough follows: two loans, two dated amortization schedules, the All Loans Summary, the Extra Payment Impact grids, and the combined dashboard, ready for Excel and Google Sheets.
- The tier family starts smaller. The free Loan Amortization template is a one-sheet calculator that turns a loan amount, an annual rate and a term in years into the monthly payment, the total paid and the total interest, with no month-by-month table. The Loan Amortization Essentials ($19) adds the dated 360-row schedule itself, a Loan Setup sheet carrying an extra monthly payment input, and a dashboard with six tiles and two charts. The Ultimate version is the one that carries a second loan, a schedule per loan, the All Loans Summary and the Extra Payment Impact grids.
- For a home purchase rather than a repayment table, the Home Mortgage Calculator Ultimate Spreadsheet Template ($29) is the sibling to reach for. It sets three scenarios side by side, each with a home price, a down payment, PMI, property tax and insurance, and adds a refinance calculator.
Related
- Loan Payment Calculator: Understanding Your Monthly Payment - the PMT formula on its own, and where a single payment goes, before you build a full schedule
- How to Analyze a Mortgage in a Spreadsheet - the wider set of numbers behind a home loan, from closing costs to total cost of ownership
- Mortgage Refinance Calculator: When Does Refinancing Make Sense? - comparing an existing schedule against a new rate and term
- Mortgage Payoff Calculator: Extra Payments Impact - the extra-payment question isolated to a single mortgage
Frequently asked questions
What is a loan amortization schedule?
It is a table with one row per scheduled payment. Each row shows the payment amount, how much of it covers interest for that month, how much reduces the principal balance, and the balance that remains afterward. Early rows are mostly interest because interest is charged on the balance still owed; as the balance falls, more of each fixed payment goes to principal until the balance reaches zero.
How is the monthly payment calculated?
From three inputs: the balance, the annual rate, and the term in months. The standard payment formula is the spreadsheet PMT function, written =PMT(rate/12, months, -balance). In the sample file a $250,000 balance at 6.5% over 360 months returns $1,580.17, and a $22,000 balance at 5.9% over 60 months returns $424.30. Every other number on the schedule is derived from that payment and the running balance.
Why does most of an early payment go to interest?
Because interest each month is the balance multiplied by the monthly rate, and the balance is at its highest early on. In the sample mortgage, month one charges $1,354.17 of interest against a $1,580.17 payment, leaving only $226.00 to reduce principal. Years later the interest share is small and nearly the whole payment reduces the balance, which is the crossover the dashboard chart shows.
Can one spreadsheet track more than one loan?
This template holds two loans, entered as Loan 1 and Loan 2 on the Loan Setup sheet, each with its own dated amortization schedule. The sample uses a mortgage and a car loan. An All Loans Summary sheet and a dashboard then combine the two into a single balance, payment, interest, and payoff picture. A third loan would be a second copy of the file.
How does the extra-payment model work?
Each loan has an Extra Monthly Payment input that is added to principal every month inside its schedule, so the balance falls faster and the loan ends before its scheduled term. A separate Extra Payment Impact sheet runs a grid of what-if amounts against a range of starting balances, reporting the interest avoided and the months shaved off for each combination without changing the inputs on Loan Setup.
Sources
- How does paying down a mortgage work? - Consumer Financial Protection Bureau
- What is negative amortization? - Consumer Financial Protection Bureau
About this article
Sheets, inputs, formulas and figures checked on 2026-09-10 against the published Loan Amortization Ultimate workbook customers download (Dashboard, Loan Setup, Amortization - Loan 1, Amortization - Loan 2, All Loans Summary, Extra Payment Impact, How to Use), with the free and Essentials tiers checked against their own shipped files. CFPB definitions of amortization and how mortgage payments split between interest and principal checked against the live Consumer Financial Protection Bureau pages at writing time. Last reviewed September 2026.