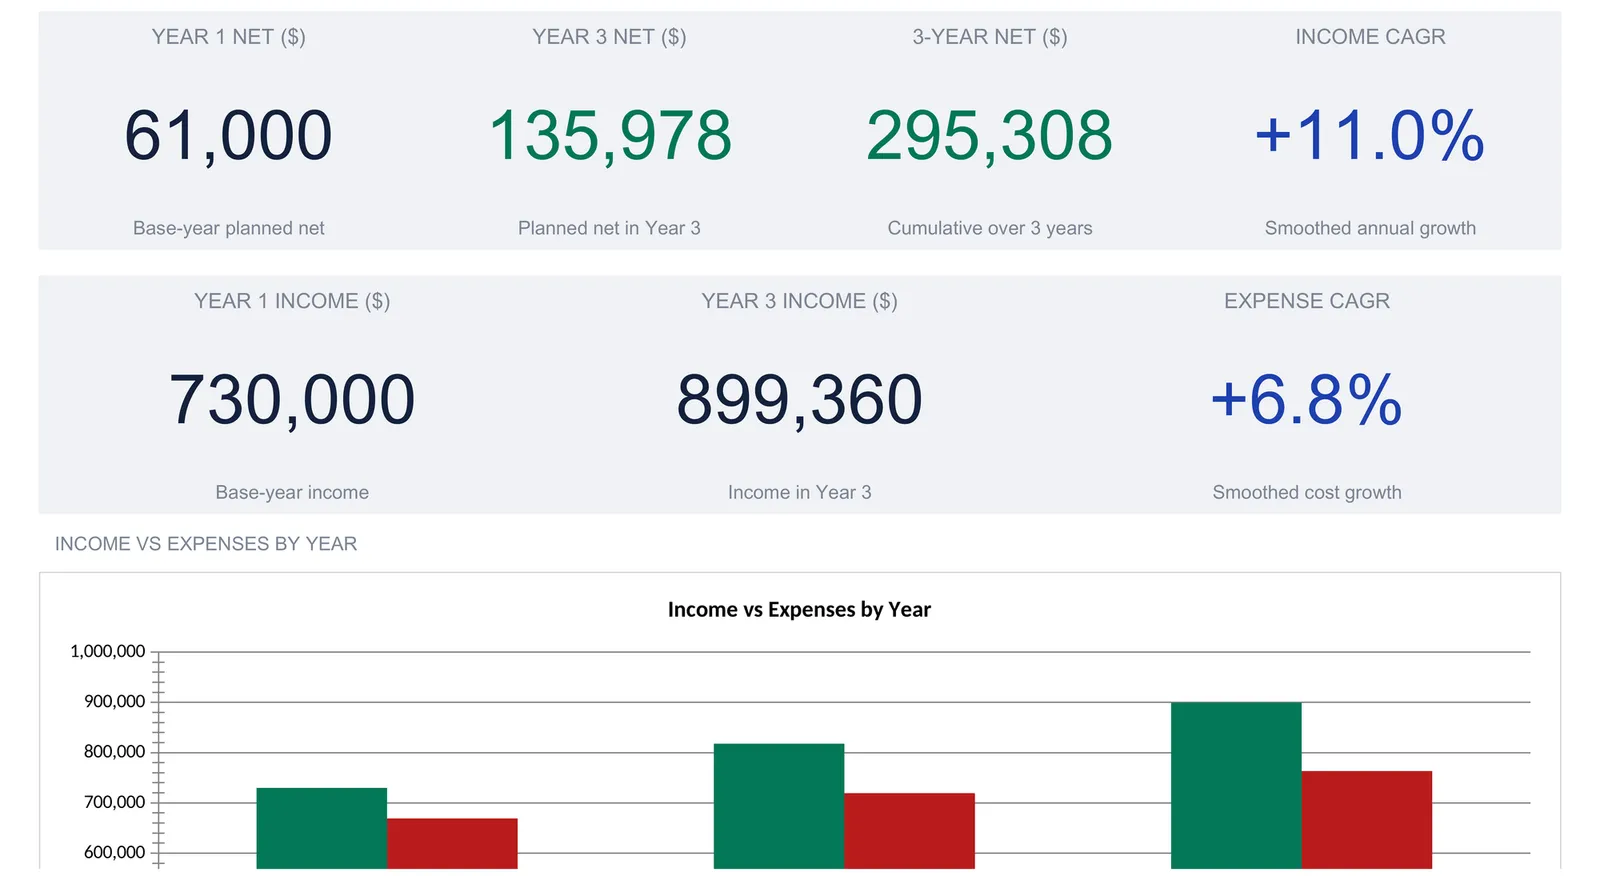
An annual business budget spreadsheet plans forward instead of tracking backward: you enter one base year by category, set year-over-year growth drivers, and the sheet projects three years of income, expenses, and net. This walkthrough builds one sheet by sheet using a worked example, a services firm with 730,000 in base-year income, 669,000 in expenses, and planned net growing from 61,000 to 135,978 over the plan. It covers the driver math, the CAGR readouts, and a conservative-to-aggressive scenario range. Our Annual Business Budget Spreadsheet Template ($29) ships the same structure ready-made for Excel and Google Sheets.
Most business budgets are built to look backward. You record what came in, record what went out, and measure the gap. That is essential work, but it answers a question about the past. A different question runs the other way: where is next year supposed to land, and the year after that? Planning forward is a separate discipline from tracking, and it needs a separate structure. Instead of recording actuals, you state a starting point and a set of assumptions, and let the arithmetic carry them out across several years.
That is what a driver-based annual budget does. You enter one base year by category, set the rate each category is expected to grow, and the sheet projects the whole plan forward. The examples below come from our Annual Business Budget Spreadsheet Template ($29), which ships the structure ready-made for Excel and Google Sheets. The sample file models a small services firm across three years, and the same layout is reproducible by hand if you would rather build your own.
What a driver-based annual budget holds
An annual planning model is not a ledger of transactions. It holds four kinds of information, and nothing else:
- A base year by category. One column of numbers, the coming year’s budget for each income line and expense group. This is the only place money figures are typed.
- Growth drivers. A small table of year-over-year growth rates, one per group. These are the assumptions the whole plan rides on.
- A projected trajectory. Every income line and expense group carried out across three years, with the year-over-year change and a smoothed growth rate for each. All of this is calculated.
- A scenario range. The same plan flexed under a low, a base, and a high set of assumptions, so the plan is a band rather than a single guess.
The template gives each of these its own sheet. Settings holds the labels, Plan holds the base year, Drivers holds the growth rates, Trajectory shows the year-by-year path, Scenarios shows the range, and a Dashboard sits on top with the three-year headline. A How to Use sheet carries the instructions. The build order below follows the work: labels first, then the base year, then the assumptions that grow it, then the three views that read the result back.
Start with the labels: the Settings sheet
Settings is deliberately small. It holds three things, and none of them touch the math.
Business name. A single label, shown in the sample as “Business Name Inc.” It prints across the top of every sheet apart from How to Use, so the file identifies itself.
Currency symbol. A dropdown with 35 symbols, from the dollar and euro through the rupee, real, and dirham. Choosing one relabels every money column and every KPI label across the workbook at once. It relabels only. No number is converted, so the selector is a display setting, not an exchange rate.
Base year label. The year that Year 1 represents, shown as 2026 in the sample. It scopes the whole plan: Year 2 and Year 3 are simply the two years that follow it.
That is the entire sheet. Because the currency marker is set in one place and read everywhere, the section titles and tile labels that name a currency all update together, and no individual cell carries a hard-coded symbol.

Lay down the base year: the Plan sheet
The Plan sheet is where the budget is typed, and it is the only sheet where money amounts are entered by hand. Every other figure in the workbook is calculated from here and from the Drivers rates. The layout is a single column of Year 1 figures, grouped the way a small business already thinks about its money.
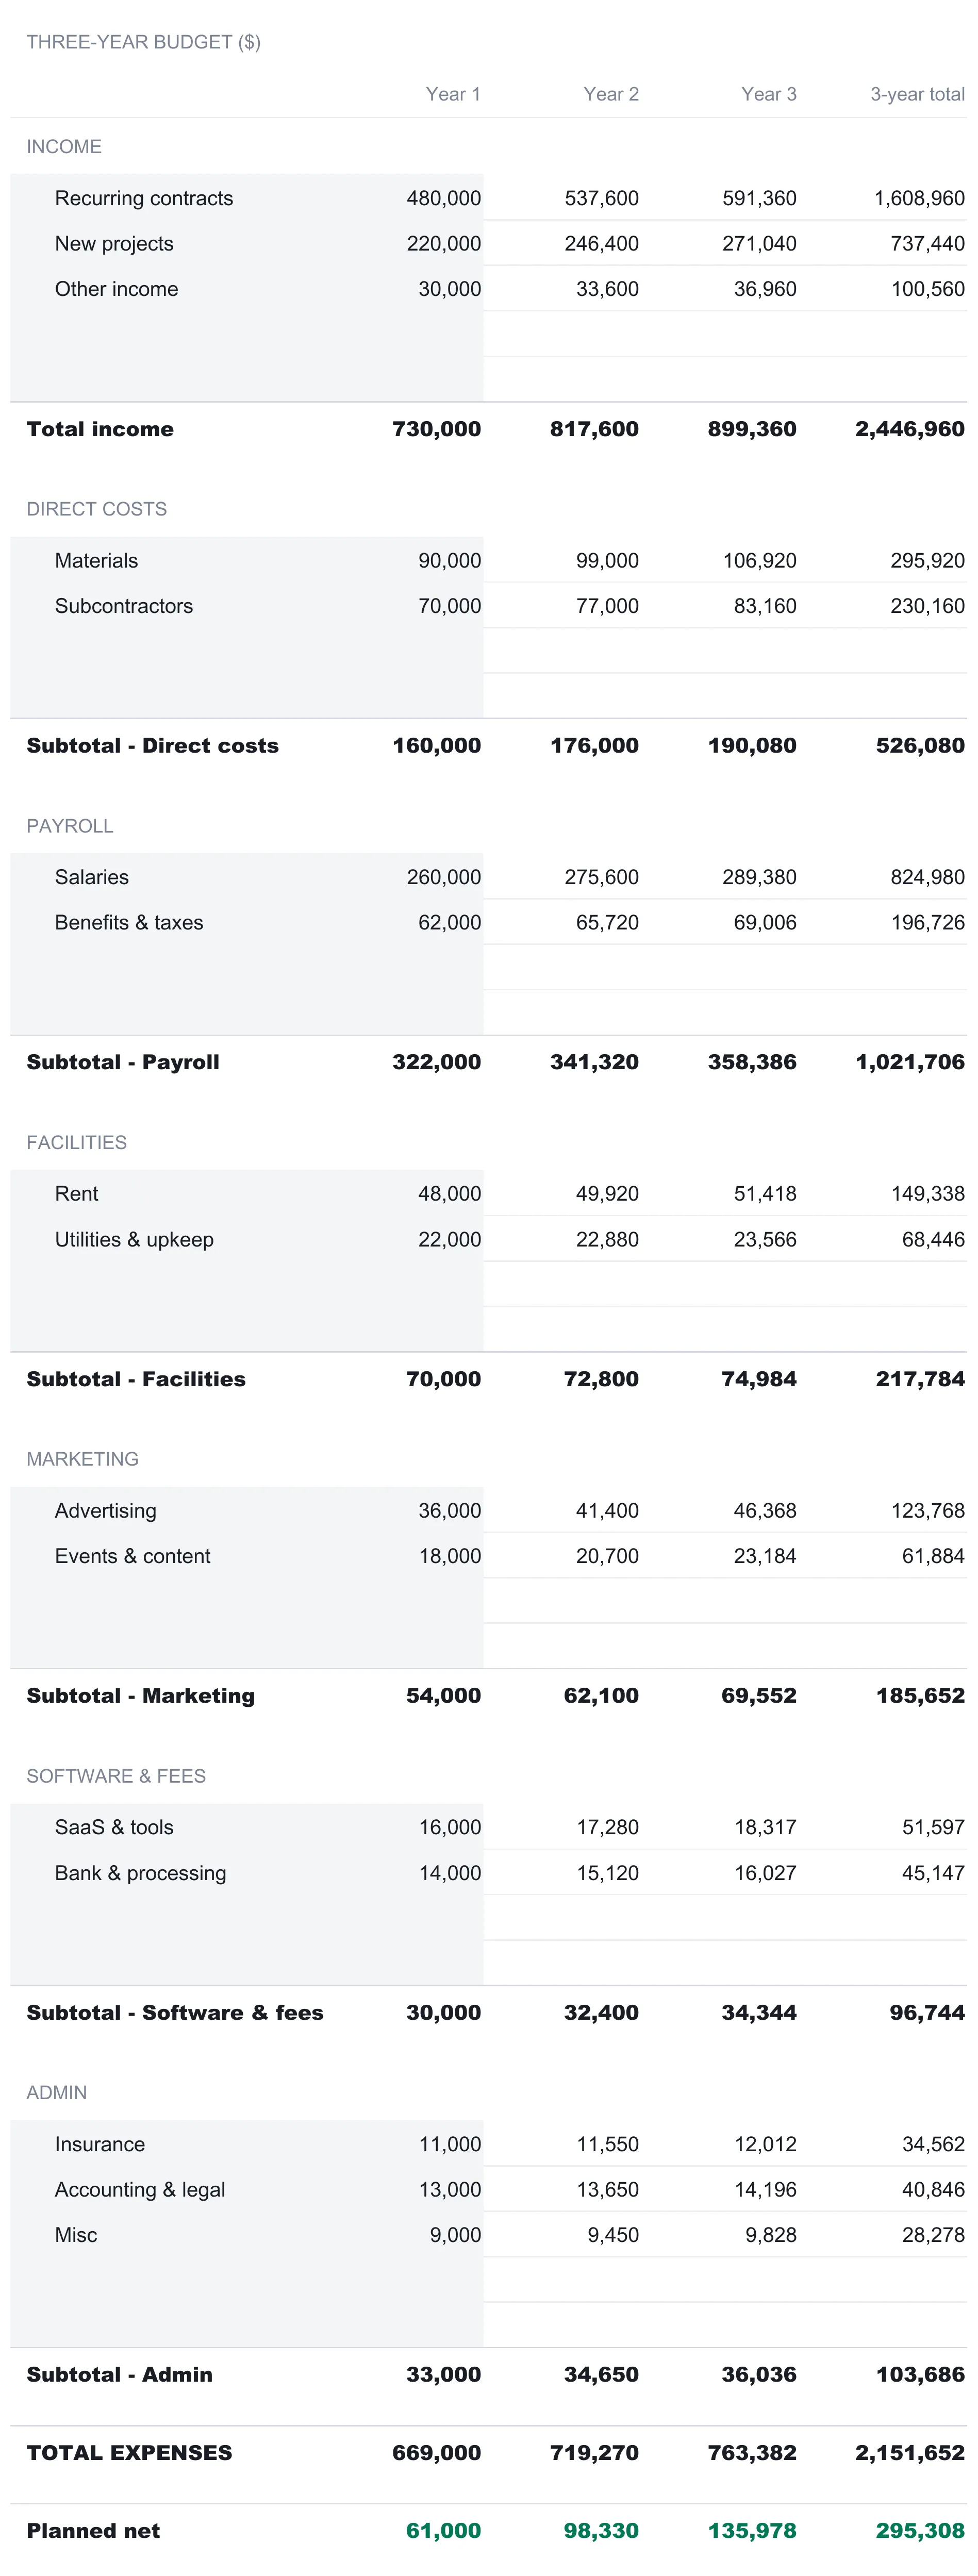
Income sits at the top with three lines in the sample: recurring contracts at 480,000, new projects at 220,000, and other income at 30,000, totaling 730,000 in base-year income. Below income, expenses run in six groups, each with its own subtotal:
| Group | Year 1 subtotal ($) | Sample lines |
|---|---|---|
| Direct costs | 160,000 | Materials 90,000, Subcontractors 70,000 |
| Payroll | 322,000 | Salaries 260,000, Benefits & taxes 62,000 |
| Facilities | 70,000 | Rent 48,000, Utilities & upkeep 22,000 |
| Marketing | 54,000 | Advertising 36,000, Events & content 18,000 |
| Software & fees | 30,000 | SaaS & tools 16,000, Bank & processing 14,000 |
| Admin | 33,000 | Insurance 11,000, Accounting & legal 13,000, Misc 9,000 |
Those six subtotals add to 669,000 in total expenses, which leaves a planned net of 61,000 in the base year. That single figure, income minus expenses, is the number the rest of the workbook grows.
A fourth column sits to the right of each line and sums all three years, which is where the cumulative shape of the plan shows up. Recurring contracts total 1,608,960 across the three years, total income adds to 2,446,960, and total expenses to 2,151,652, leaving a cumulative planned net of 295,308. That last figure is the one the dashboard headlines as the three-year net, and it is simply the three annual nets stacked: 61,000 plus 98,330 plus 135,978.
Only two things on this sheet are yours to type: the category name and its Year 1 amount. The Year 2 and Year 3 columns beside each line are formulas, and so is every subtotal, the total expenses line, and the planned net. Each group also carries two blank spare rows at its foot. Naming one and giving it a Year 1 figure drops it straight into that group’s subtotal, into total expenses, and onward into the Trajectory and the Dashboard, because those ranges already reach across the spare rows. Adding a category is renaming a row, not rebuilding a formula.
Set the assumptions: the Drivers sheet
The Drivers sheet is the smallest sheet in the workbook and the one that does the most. It is a seven-row table of year-over-year growth rates, and it is the only place growth is set anywhere in the file.
| Driver | Year 1 to Year 2 | Year 2 to Year 3 |
|---|---|---|
| Income growth | +12% | +10% |
| Direct costs growth | +10% | +8% |
| Payroll growth | +6% | +5% |
| Facilities growth | +4% | +3% |
| Marketing growth | +15% | +12% |
| Software & fees growth | +8% | +6% |
| Admin growth | +5% | +4% |
Each row carries two rates, one for the step from Year 1 to Year 2 and one for the step from Year 2 to Year 3. The mechanism is straightforward: on the Plan sheet, Year 2 for a category is its Year 1 amount grown by the first rate, and Year 3 is its Year 2 amount grown by the second. All three income lines share the single income rate, while each expense group grows by its own.
A worked line makes it concrete. Recurring contracts start at 480,000. The income driver is 12% for the first step, so Year 2 is 480,000 × 1.12, which is 537,600. The second income rate is 10%, so Year 3 is 537,600 × 1.10, which is 591,360. Marketing shows the expense side of the same idea: 54,000 grows by 15% to 62,100, then by 12% to 69,552. Because the marketing rate is higher than the payroll rate, marketing rises faster year on year even though it starts as the smaller number.
One detail is worth copying into any hand-built version: a negative driver models a planned reduction. Entering -5% for a group would shrink it each year rather than grow it, which is how a plan captures a deliberate cost cut instead of pretending every line only ever goes up.
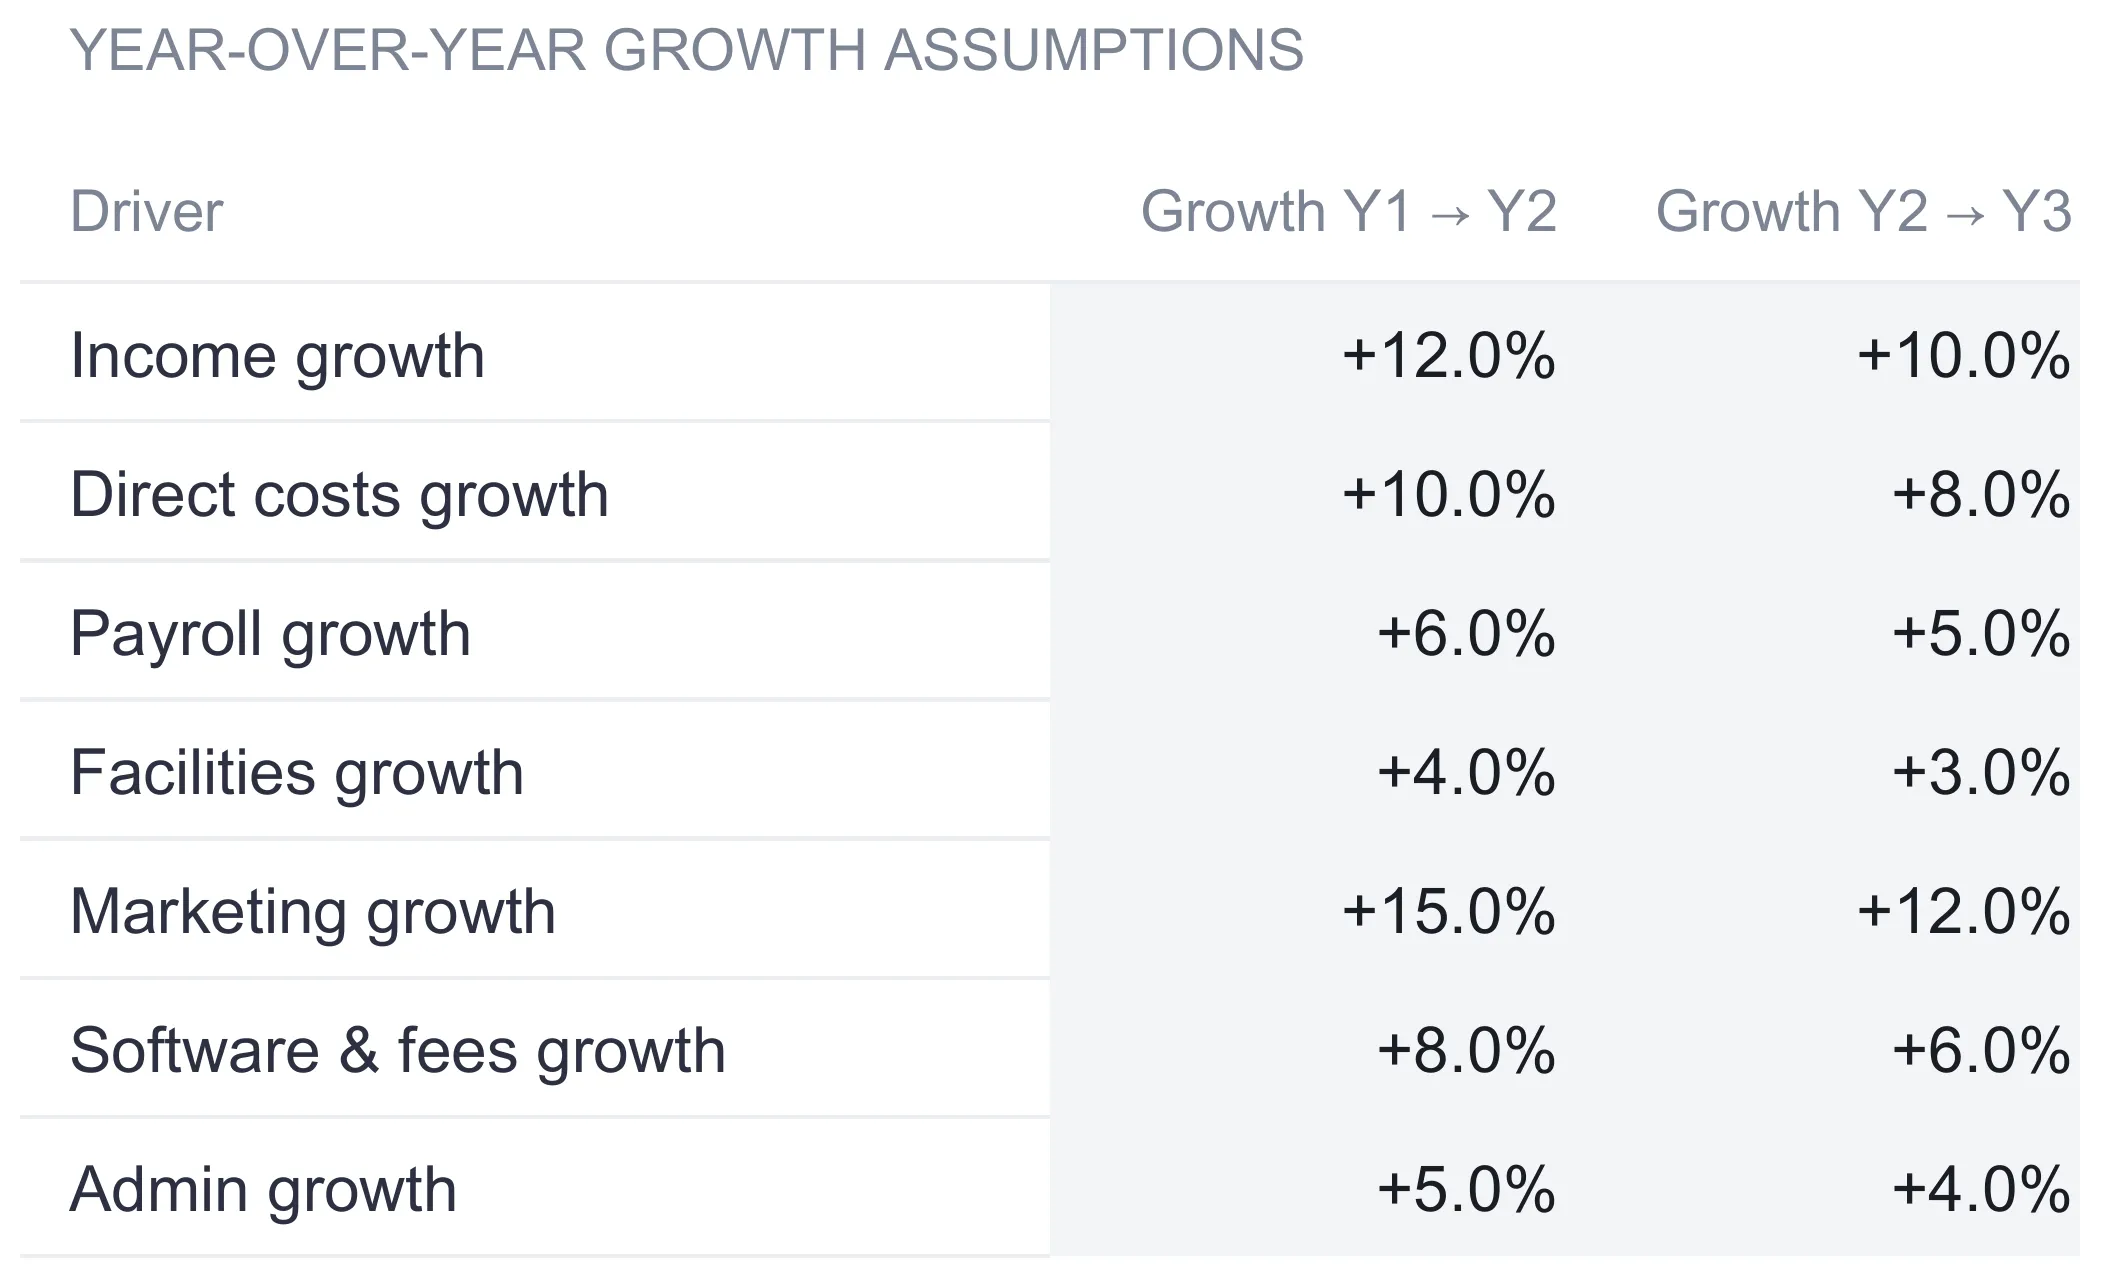
Changing a single rate here ripples through the entire workbook instantly. Nudge the income driver up two points and every income line, the total, the trajectory, the scenarios, and the dashboard all move together, because they all read the same base year and the same drivers. That is the whole appeal of a driver-based model over a plan where each future year is typed by hand: the assumptions live in one visible place, and the projection is never out of step with them.
Read the growth path: the Trajectory sheet
The Trajectory sheet takes the plan and lays it out as a path rather than a single column. Every income line and every expense subtotal appears with its Year 1, Year 2, and Year 3 figures, then three more columns: the year-over-year change from Year 1 to Year 2, the change from Year 2 to Year 3, and a three-year compound growth rate.
For total income the path reads 730,000, then 817,600, then 899,360, a steady +12.0% and then +10.0%, for a smoothed +11.0% across the plan. Because all three income lines share one driver, each of them shows the identical +12.0% and +10.0% step. Expenses behave differently, and that is the useful part. Total expenses run 669,000, then 719,270, then 763,382, which works out to +7.5% and then +6.1%. Those blended rates are not any single driver: they are the weighted result of six groups growing at their own speeds, with the larger groups such as payroll pulling the average toward their slower rates.
The compound rate in the last column, labeled 3-yr CAGR, is the single smoothed rate that would connect Year 1 to Year 3 if growth were even each year. Direct costs land at +9.0%, payroll at +5.5%, facilities at +3.5%, marketing at +13.5%, software and fees at +7.0%, and admin at +4.5%. The planned net line sits at the bottom with a smoothed rate near +49%.
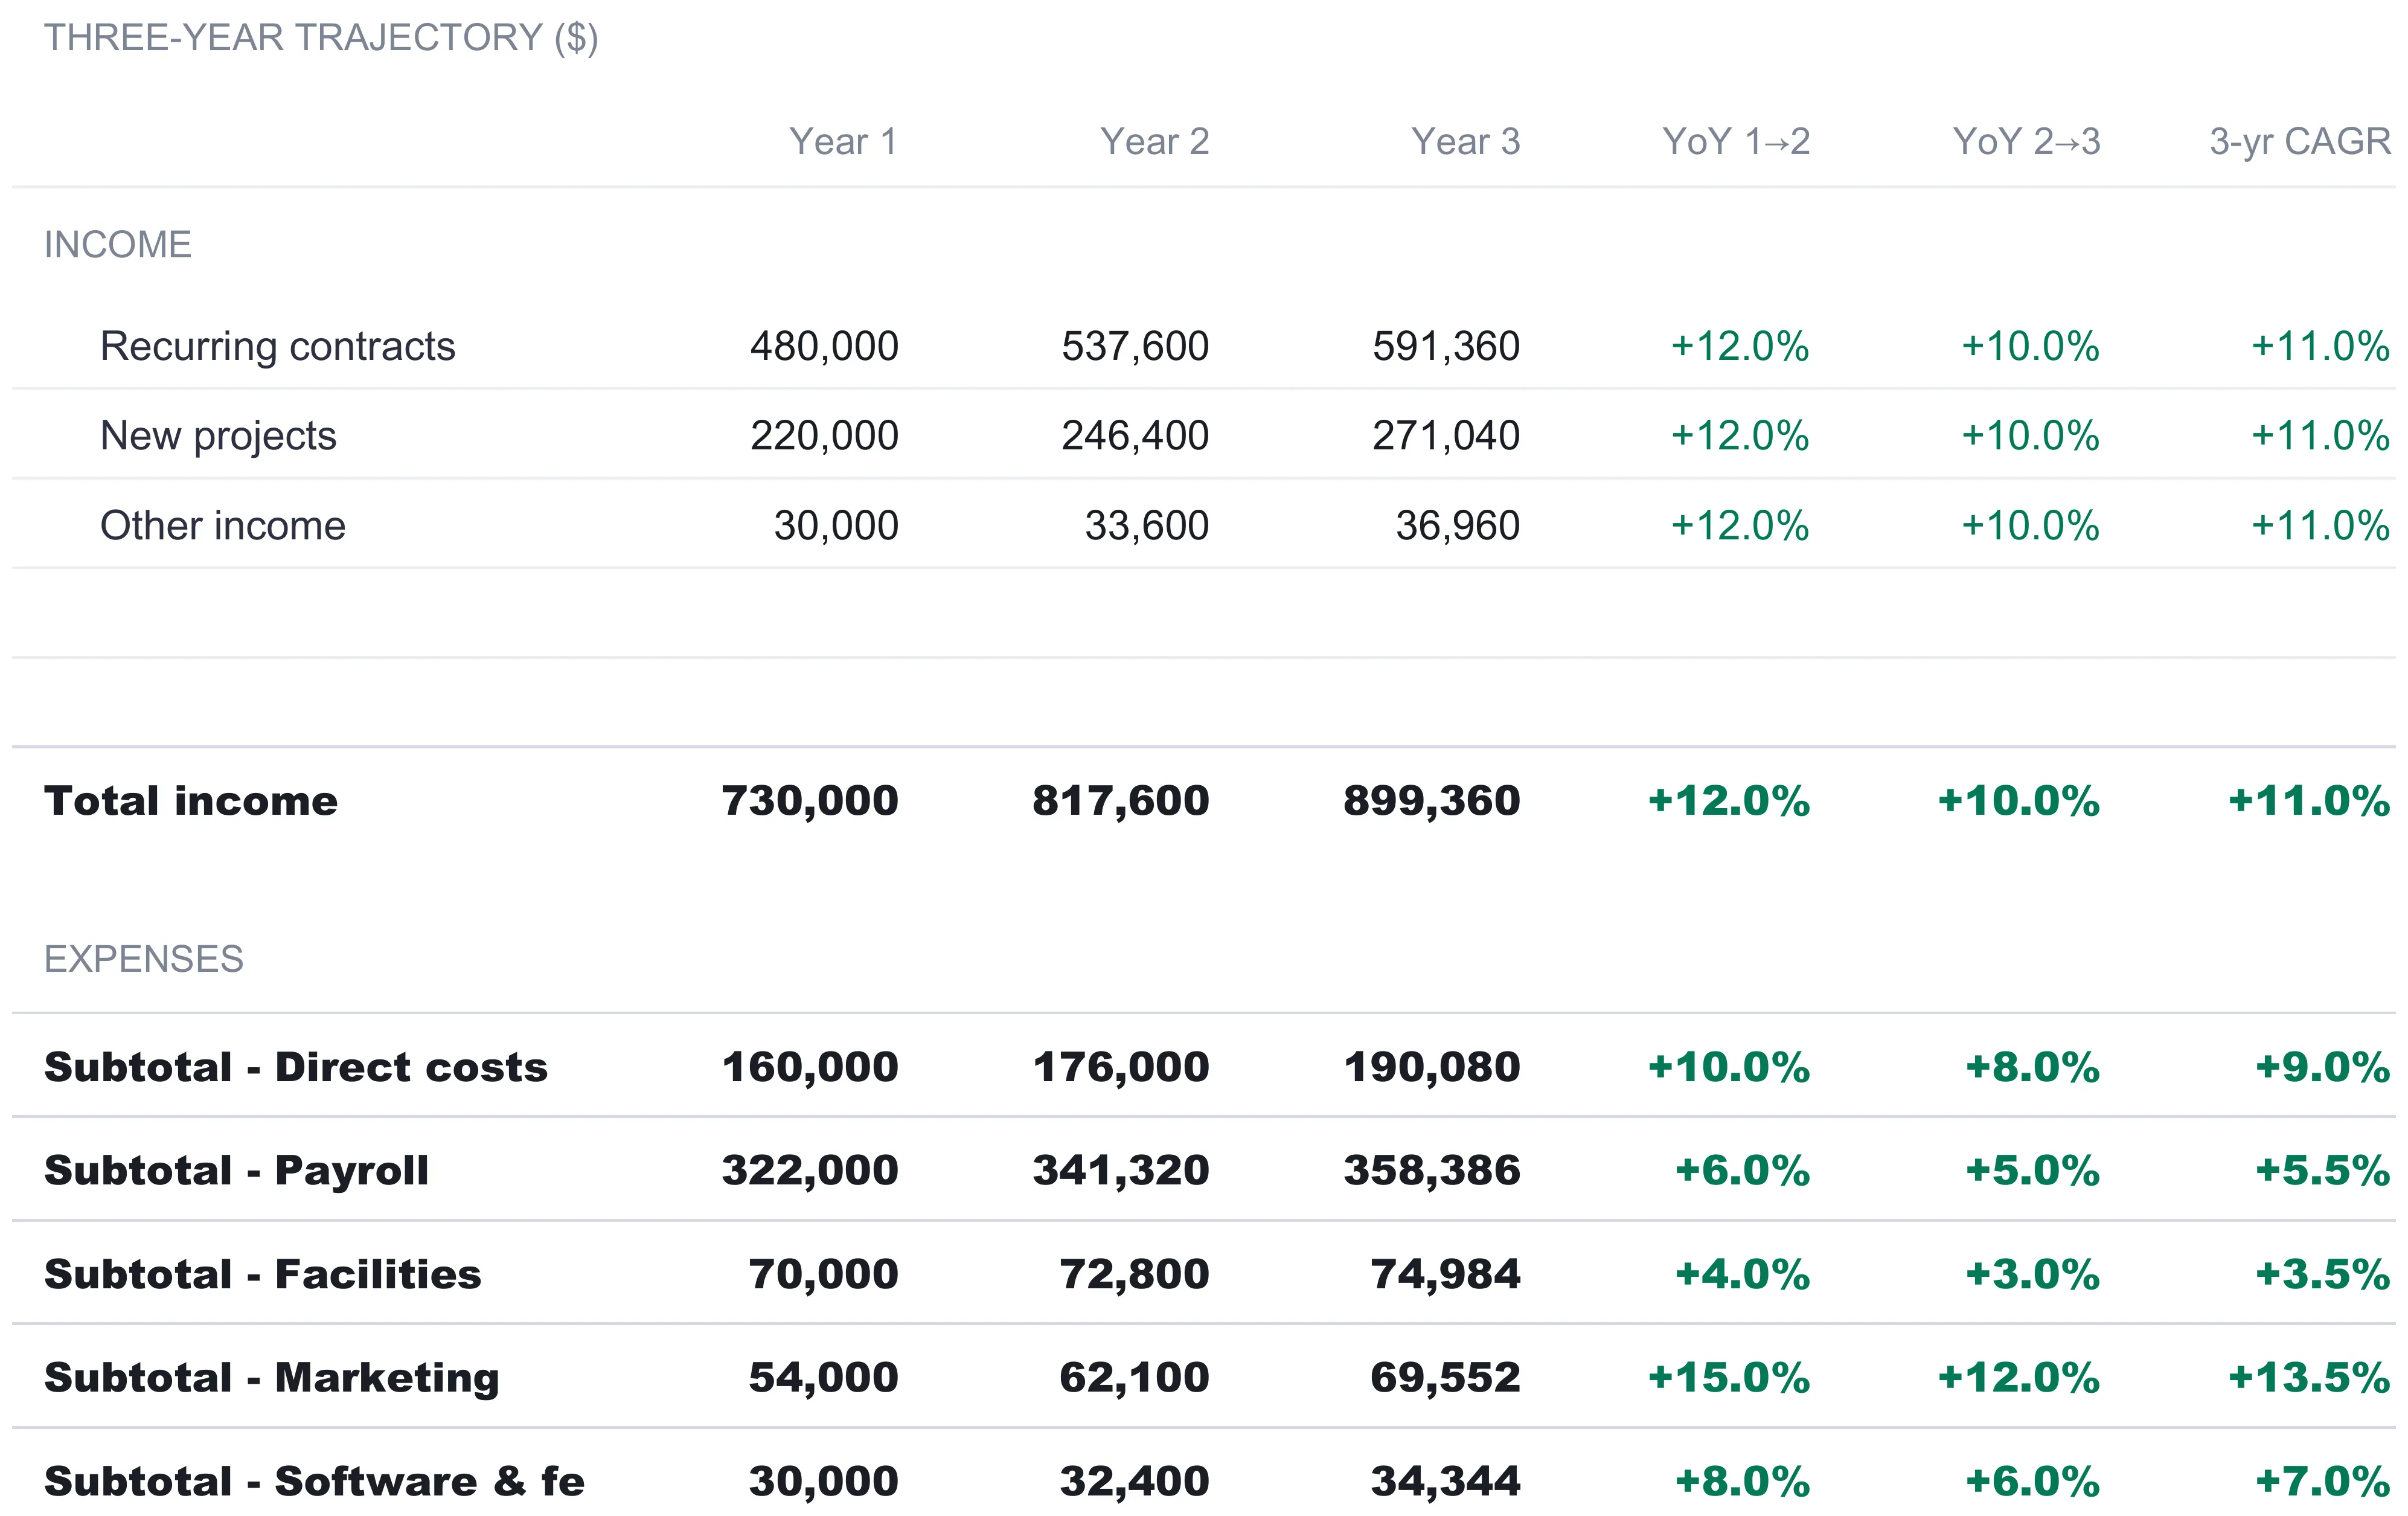
The planned net line is worth pausing on, because it grows far faster than either the income or the expense line it sits between. Net moves from 61,000 to 98,330, a jump of +61.2%, then to 135,978, a further +38.3%. Neither of those is a growth rate anything was set to; they fall out of the wedge between an income line rising at +11.0% and a cost base rising at +6.8%. When a larger number and a smaller number grow at different speeds, the difference between them grows faster than both, and net is that difference. This is the leverage a forward plan is meant to expose, and it cuts the other way just as sharply if the two rates ever cross.
The CAGR column follows one rule worth knowing. It is computed as the Year 3 figure divided by the Year 1 figure, raised to the power of one half, minus one, and it is shown only when both years are positive. A smoothed rate drawn between a loss in one year and a profit in another would be a number with no real meaning, so the cell falls back to zero rather than print something misleading.
Stress-test the plan: the Scenarios sheet
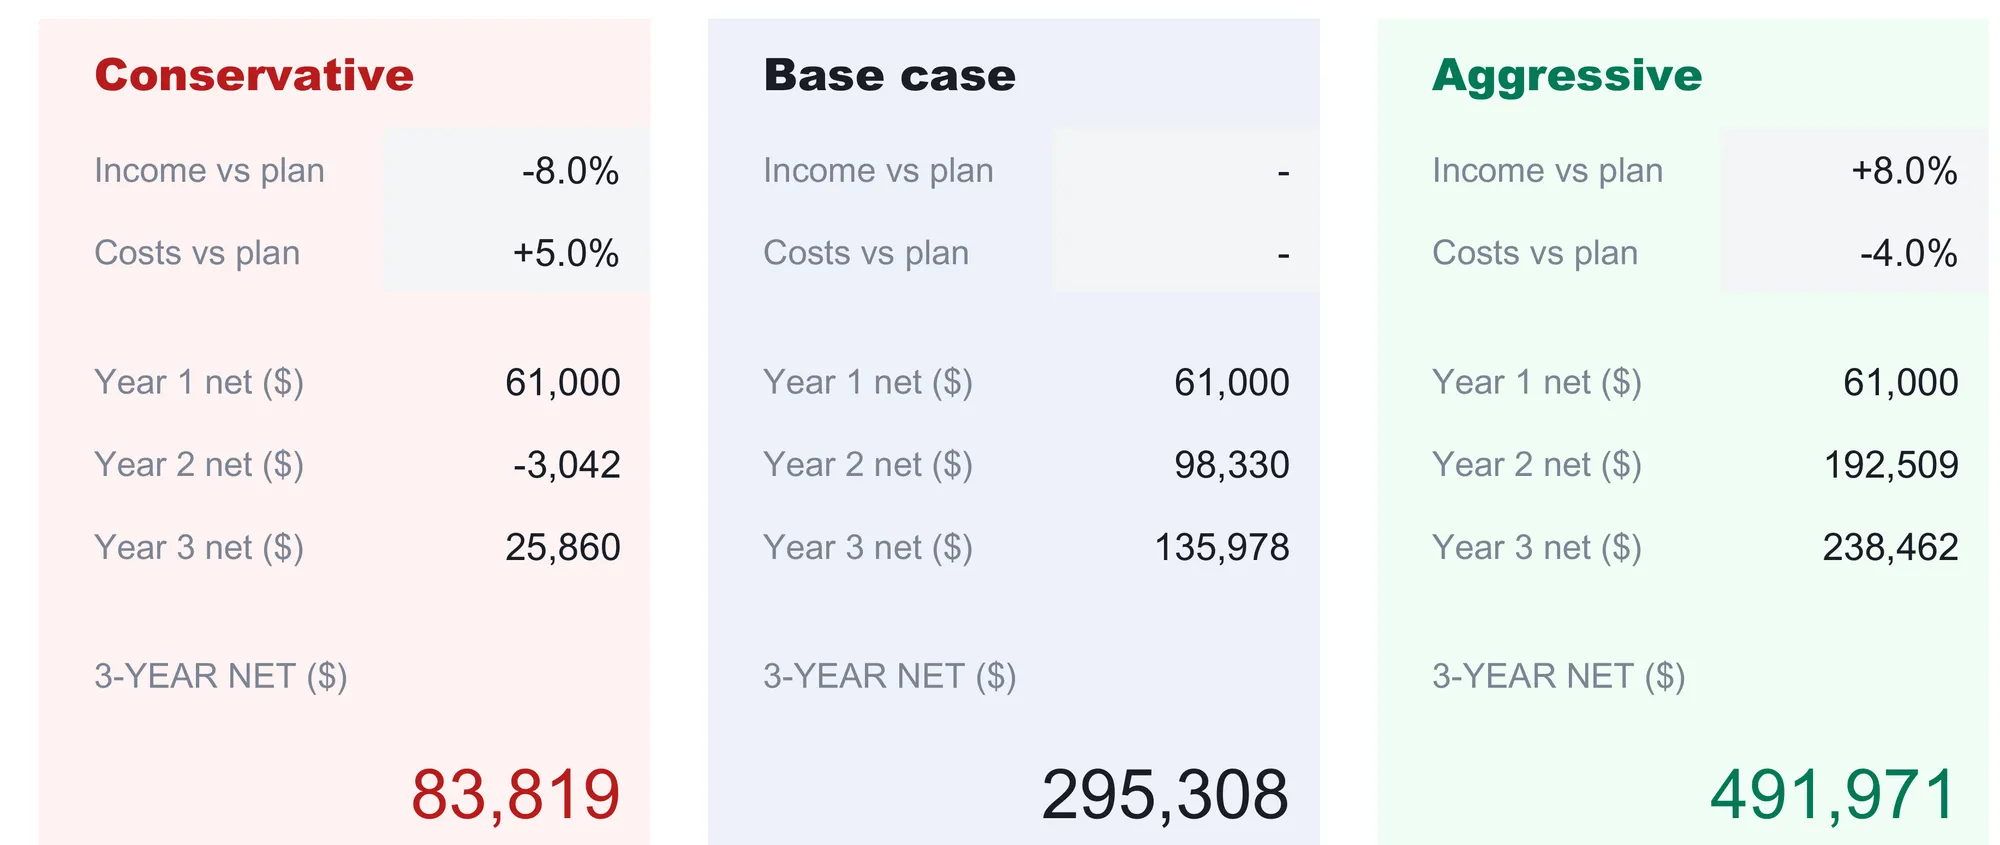
A single plan is a single guess, and the Scenarios sheet turns it into a range. It sets three columns side by side, Conservative, Base case, and Aggressive, each defined by two knobs: income versus plan and costs versus plan.
- Conservative takes income 8% below plan and costs 5% above plan.
- Base case leaves both at zero, so it reproduces the plan exactly.
- Aggressive takes income 8% above plan and costs 4% below plan.
The two knobs flex the Year 2 and Year 3 totals only. Year 1 stays fixed at the committed base of 61,000 in every column, on the reasoning that the coming year’s budget is already set and it is the later years that carry the uncertainty. The math for each later year is the plan’s income for that year adjusted by the income knob, minus the plan’s expenses for that year adjusted by the cost knob.
The conservative column shows the arithmetic clearly. Its Year 2 net is the plan’s Year 2 income of 817,600 taken down 8% to 752,192, minus the plan’s Year 2 expenses of 719,270 lifted 5% to 755,234. That leaves about -3,042, a small loss where the base case had a comfortable 98,330. The two adjustments compound against each other, softer income and heavier costs at the same time, which is why a scenario built from two modest 5-to-8% shifts can flip a profitable year negative. It is a useful reminder that a plan’s cushion is thinner than the headline net suggests.
Run through, the range is wide. The base case three-year net is 295,308, the same figure the rest of the workbook shows. The conservative case, with softer income and heavier costs, drops Year 2 net to a small loss of about -3,042 and lands a three-year net near 83,819. The aggressive case lifts Year 2 net to roughly 192,509 and a three-year net near 491,971. Seeing those three totals together frames the plan honestly: the base case is the intent, and the two flanking cases show how much a modest miss on income or a modest overrun on costs would move the result. The sheet labels this an indicative range, not a forecast, which is the right way to read it.
The Dashboard: seven numbers and a verdict
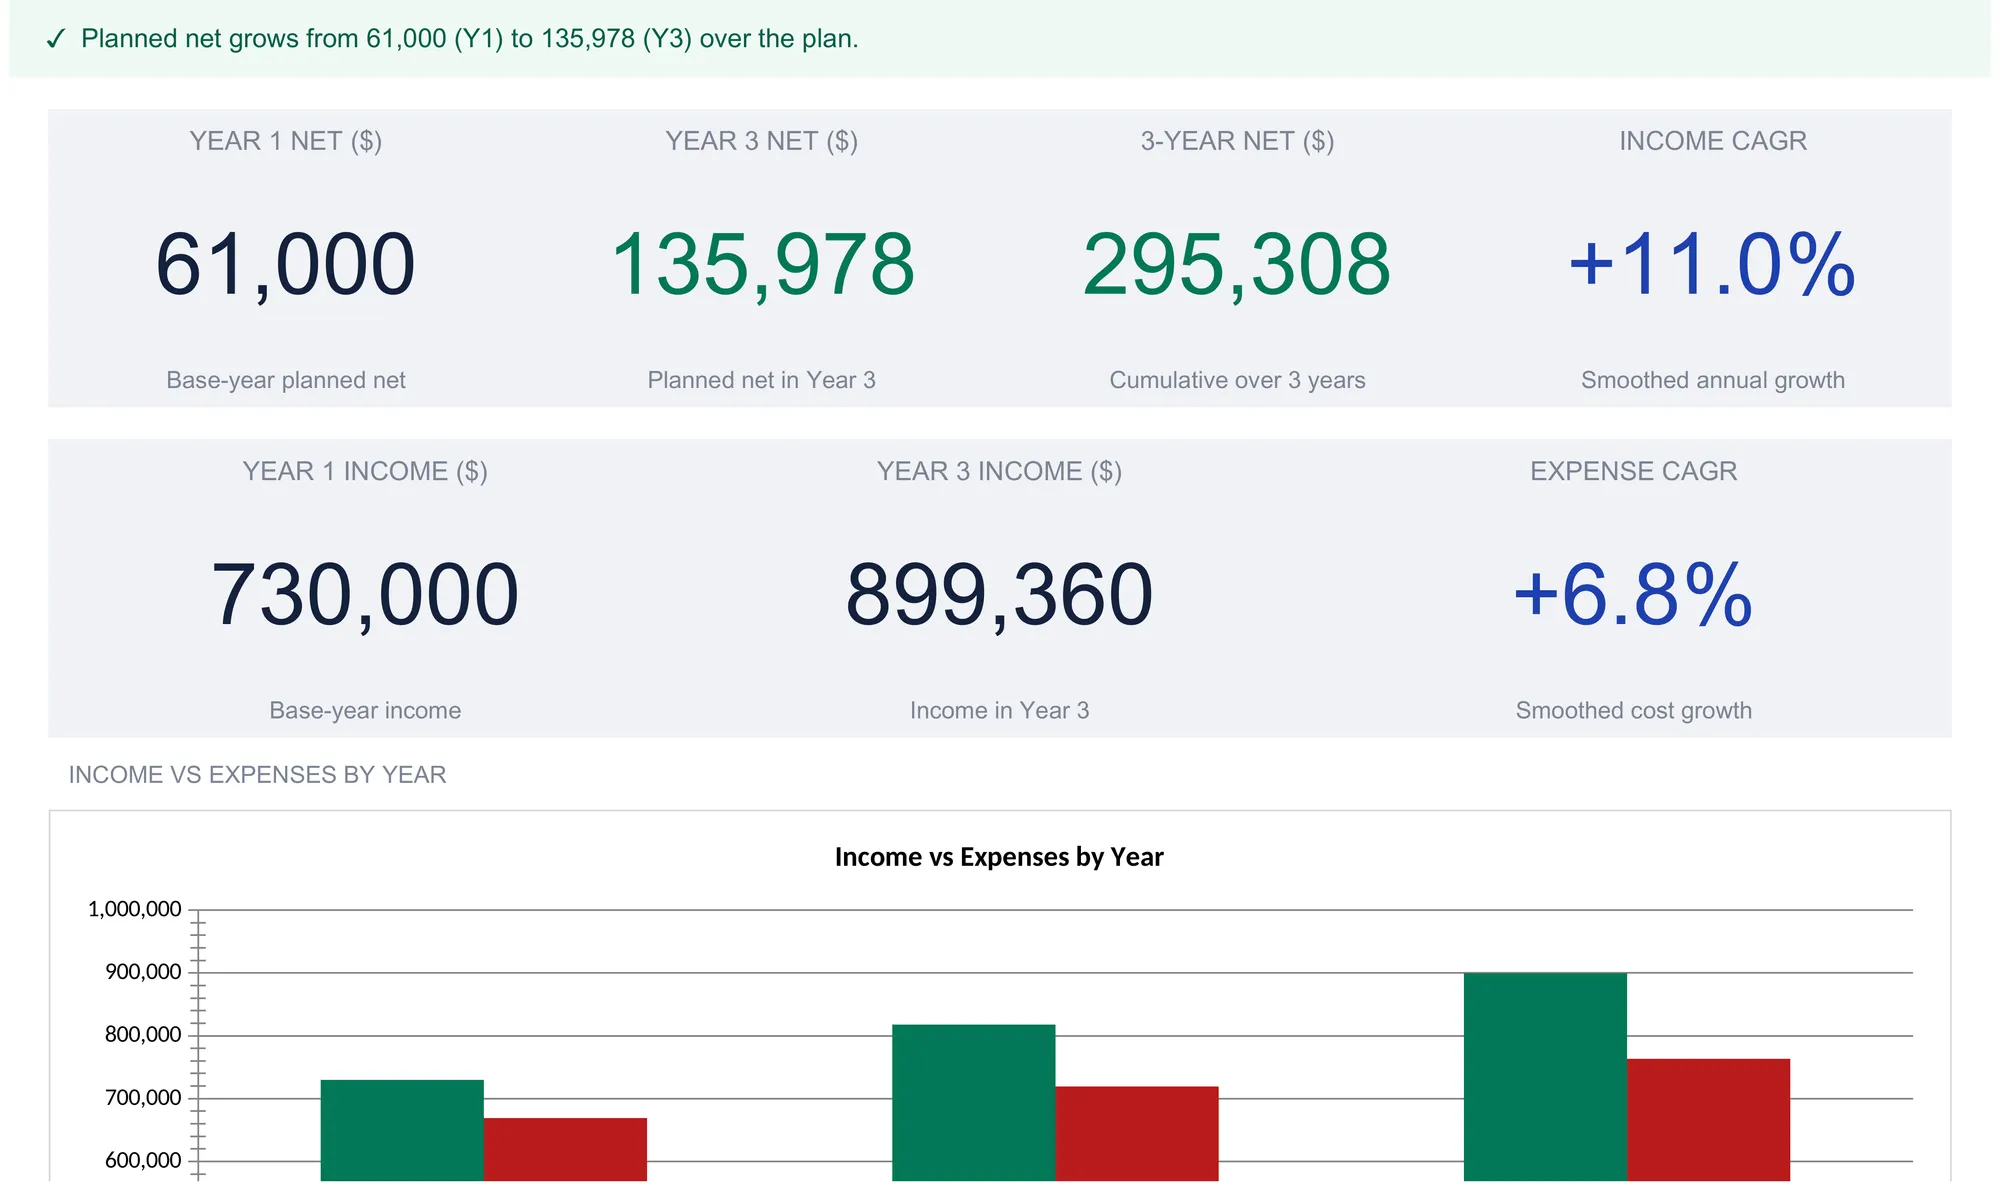
With the base year entered and the drivers set, the Dashboard reads the whole plan back in one screen. A status banner runs across the top and states the plan in a sentence. In the sample it reads that planned net grows from 61,000 in Year 1 to 135,978 in Year 3 over the plan. If the drivers were set so that net declined instead, the banner flips to a warning and prompts a revisit of the Drivers, so a plan that quietly shrinks says so the moment the file opens.
Below the banner sit seven KPI tiles:
| Tile | Sample value | What it means |
|---|---|---|
| Year 1 net | 61,000 | Base-year planned net |
| Year 3 net | 135,978 | Planned net in Year 3 |
| 3-year net | 295,308 | Cumulative net across all three years |
| Income CAGR | +11.0% | Smoothed annual income growth |
| Year 1 income | 730,000 | Base-year income |
| Year 3 income | 899,360 | Income in the final year |
| Expense CAGR | +6.8% | Smoothed annual cost growth |
The two CAGR tiles are the pair to read together. Income is planned to compound at +11.0% a year while costs compound at +6.8%, and that four-point wedge is the entire reason net more than doubles over the plan. If those two rates were to converge, the net line would flatten no matter how large the top line grew, which is exactly the kind of thing a driver model surfaces early.
Beneath the tiles, an income-versus-expenses bar chart plots the two totals for each of the three years, the green income bars pulling steadily away from the red expense bars. The workbook also carries a planned-net-by-year chart and a three-year summary table further down the sheet, though the preview image above stops at the first chart, so those lower elements are not visible in that render.
Where this budget fits alongside in-year tracking
A three-year plan and a monthly tracker are complementary, not competing. This workbook does one job well: it sets the direction. It does not record what actually happens month to month, and it is not meant to. Once the year is under way and real figures start arriving, the question changes from where the year should go to whether it is on pace, and that is a tracking job.
Our Monthly Business Budget Spreadsheet Template ($29) is built for exactly that half. It holds a plan and an actual for every category, records real figures month by month, and reports the variance and a run-rate projection so a business can see mid-year whether it is tracking to plan. The full mechanics are in the companion walkthrough, How to Build a Business Monthly Budget in a Spreadsheet. A common rhythm is to set the annual plan once at the start of the year with this template, then track against it each month with the monthly one. The annual budget draws the map; the monthly budget checks the mileage.
The forward-looking side has backing in general business guidance too. The U.S. Small Business Administration, writing about the financials in a business plan, advises established businesses to include statements for the last three to five years and to provide a prospective financial outlook for the next five years, with the first year broken down more finely. A three-year driver-based plan is a compact way to hold that forward outlook, and the monthly tracker is where the first year gets its finer breakdown.
Excel or Google Sheets for an annual business budget
The template is a plain .xlsx file built on ordinary formulas, with no macros and no add-ons, so it behaves identically in Microsoft Excel and in Google Sheets after an upload. Excel suits a planner who keeps the file local and reworks assumptions in a spreadsheet they know well. Google Sheets suits a team that wants the plan in a shared link where a co-founder or an accountant can adjust a driver and watch the three-year picture move. The structure described here, a base year fed through a driver table into a trajectory and a scenario range, is equally buildable in either program.
Which template fits which job
- Annual Business Budget Spreadsheet Template ($29) is the workbook this walkthrough follows: a base year by category, seven growth drivers, a three-year trajectory with CAGR, a conservative-to-aggressive scenario range, and a seven-tile dashboard. It is the sheet for setting where the next three years are meant to go.
- Monthly Business Budget Spreadsheet Template ($29) is the in-year companion: plan versus actual by category, month-by-month entry, variance, and a run-rate projection. It is the sheet for checking whether the year is on pace once it starts.
Used together, the annual template plans the direction and the monthly template tracks the progress. Either one is a one-time purchase with no setup required, the calculations update on their own, and the file stays on your own machine.
Related
- How to Build a Business Monthly Budget in a Spreadsheet - the in-year tracker that records actuals against a plan
- Monthly Budget vs Annual Budget: Which One You Actually Need - how the two horizons divide the work
- How to Forecast Sales in a Spreadsheet - building the income assumptions that feed a plan like this
Frequently asked questions
What is the difference between an annual budget and monthly budget tracking?
They answer different questions. An annual business budget is a forward plan: you set a base year and growth assumptions, and the sheet projects income, expenses, and net across three years. Monthly tracking is a backward check: you record what actually happened each month and measure it against the plan. The annual budget decides where the year is meant to go; monthly tracking tells you whether it got there. Many businesses build the annual plan once, then track against it month by month in a separate file.
What does CAGR mean on the dashboard?
CAGR is the compound annual growth rate, the single smoothed rate that would carry Year 1 to Year 3 if growth were even every year. The workbook computes it as (Year 3 divided by Year 1) raised to the power of one half, minus one. In the sample the income CAGR is +11.0% and the expense CAGR is +6.8%. It is shown only when both Year 1 and Year 3 are positive, because a smoothed rate stretched between a profit and a loss carries no meaning.
How do the growth drivers work?
Each expense group has its own year-over-year rate, and all income lines share one income rate. Year 2 is Year 1 grown by the first driver, and Year 3 is Year 2 grown by the second. In the sample marketing grows 15% then 12%, so 54,000 becomes 62,100 and then 69,552. A negative driver models a planned cut, so entering -5% would shrink a group each year instead of growing it.
Can I add or rename budget categories?
Yes. Every category name on the Plan sheet is editable, and each group has two blank spare rows at its foot. Naming a spare row and giving it a Year 1 amount pulls it straight into that group's subtotal, into total expenses, and into the Trajectory and Dashboard, because the ranges and formulas already include those rows. There is no formula to drag or range to extend.
Does changing the currency convert the numbers?
No. The currency selector on Settings offers 35 symbols and relabels every money column and KPI across the workbook, but it changes the label only. The underlying figures stay exactly as entered, so switching from the dollar symbol to the euro symbol does not apply an exchange rate. A business reporting in another currency would enter its own figures in that currency and set the matching symbol for display.
Sources
- Write your business plan - U.S. Small Business Administration
About this article
Every figure, sheet name, formula, and feature description checked on 2026-09-10 against the shipped Annual Business Budget Premium workbook (Dashboard, Plan, Drivers, Trajectory, Scenarios, Settings and How to Use sheets). The multi-year financial projection guidance was checked against the live U.S. Small Business Administration business plan page at writing time. Last reviewed September 2026.