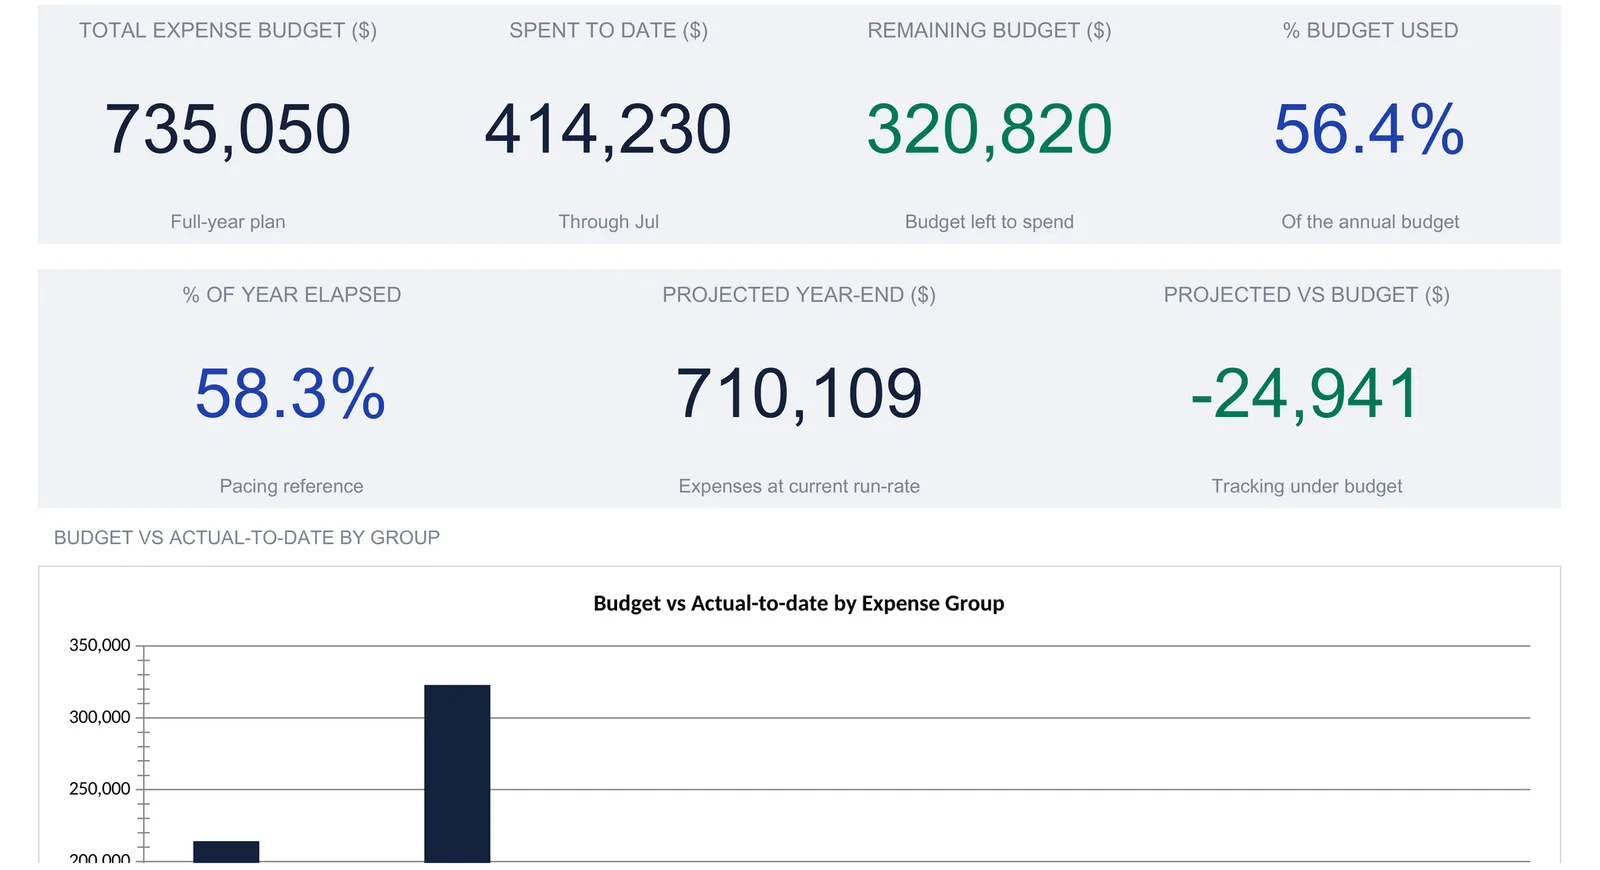
A business monthly budget spreadsheet holds two numbers for every category, the plan and the actual, and turns the gap between them into control. This walkthrough builds one sheet by sheet using a worked example: a small cafe with a 774,500 income plan, a 735,050 expense budget, and seven months of actuals recorded. It covers the pacing math (56% of budget used at 58% of the year), the run-rate projection, and the what-if reserve check. Our Monthly Business Budget Spreadsheet Template ($29) ships the same structure ready-made for Excel and Google Sheets.
A small business runs on two versions of every number. There is the plan, set at the start of the year, and there is what actually happened, arriving one month at a time. A cafe owner can usually say what the bank balance did last month. Far fewer can say whether payroll is running ahead of plan, whether marketing has quietly overspent, or whether the year is on course to land where the budget said it would. The distance between those two questions is a business monthly budget, and a spreadsheet is built for exactly this kind of comparison.
The structure is a plan sheet, an actuals sheet, and the tracking that sits between them. Everything a business budget needs to answer falls out of holding a budgeted and an actual figure for each category and each month, then reading the gap. The examples below come from our Monthly Business Budget Spreadsheet Template ($29), which ships the whole thing ready-made for Excel and Google Sheets. The layout is reproducible by hand if you would rather build your own.
What a business monthly budget has to hold
Strip away the accounting jargon and a monthly business budget is only three kinds of data plus what the tracking derives from them:
- The plan. A budgeted amount for every income line and every expense category, spread across the twelve months of the fiscal year. This is what the business intends to earn and spend.
- The actuals. The real income and spending, entered month by month as the year unfolds, in the same layout as the plan so the two line up cell for cell.
- A few settings. The business name, fiscal year, currency, how many months of actuals have been entered, and a reserve target. Small in number, but they drive the pacing and projection math.
- The tracking. Budget versus actual by category, the share of budget used against the share of the year elapsed, a run-rate projection to year-end, and a status flag on each line. None of this is typed; it is all computed.
The workbook gives each of these its own sheet. In the order the How to Use sheet walks through them: Settings, then Budget, then Actual, then the Tracker, then What-if, with the Dashboard on top pulling the headline numbers together. The worked example throughout is the sample data the template ships with, a small cafe with roughly three-quarters of a million dollars in annual revenue, seven months into its fiscal year.
Start with the constants: the Settings sheet
A handful of settings scope the whole workbook, so they come first.
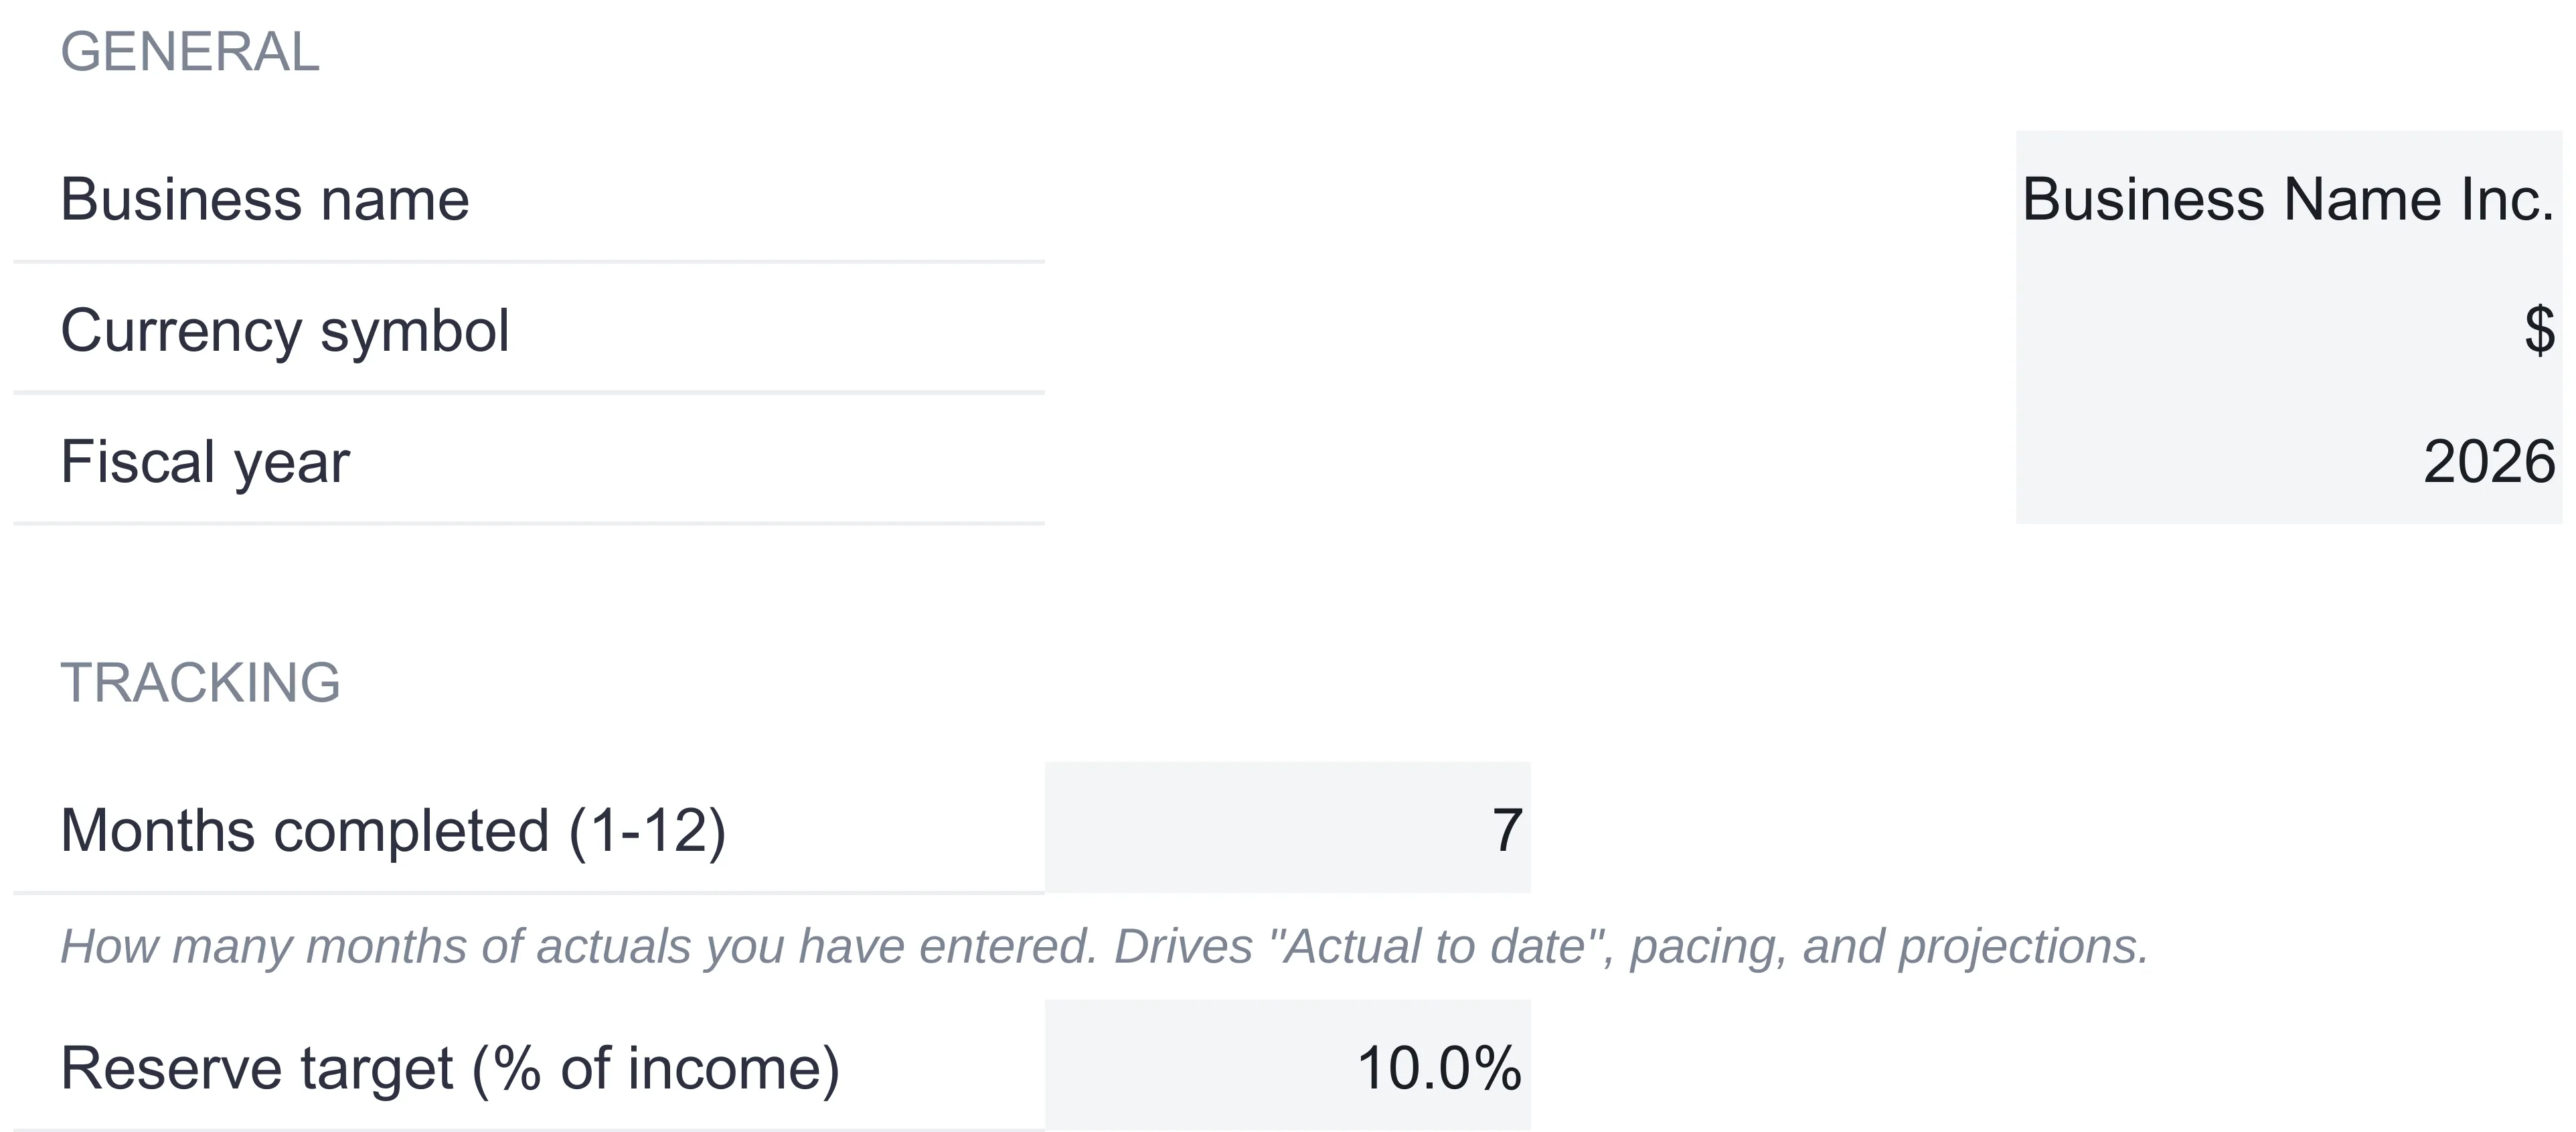
Business name and fiscal year. These label every sheet and the dashboard header. The sample uses a placeholder business name and fiscal year 2026.
Currency symbol. One dropdown with 35 symbols, from the dollar and euro through the rupee, real, and zloty. Choosing one relabels every money column header and KPI across all the sheets at once. It relabels only, with no conversion of the numbers, so a business that keeps its books in pounds sees the right symbol without the figures changing.
Months completed. This is the single most important input on the sheet, because so much depends on it. It is the count of months for which actuals have been entered, set to 7 in the sample. That number tells the Tracker how far into the year to sum the actuals, sets the ”% of year elapsed” pacing reference, and drives the run-rate projection. Enter a month of real numbers on the Actual sheet, then raise this figure by one, and the whole workbook rolls forward.
Reserve target. The share of income the business plans to keep as surplus, set to 10 percent in the sample. The What-if sheet measures the planned net against this target, which is the one place the budget is held to a goal rather than just balanced.
Set the plan: the Budget sheet
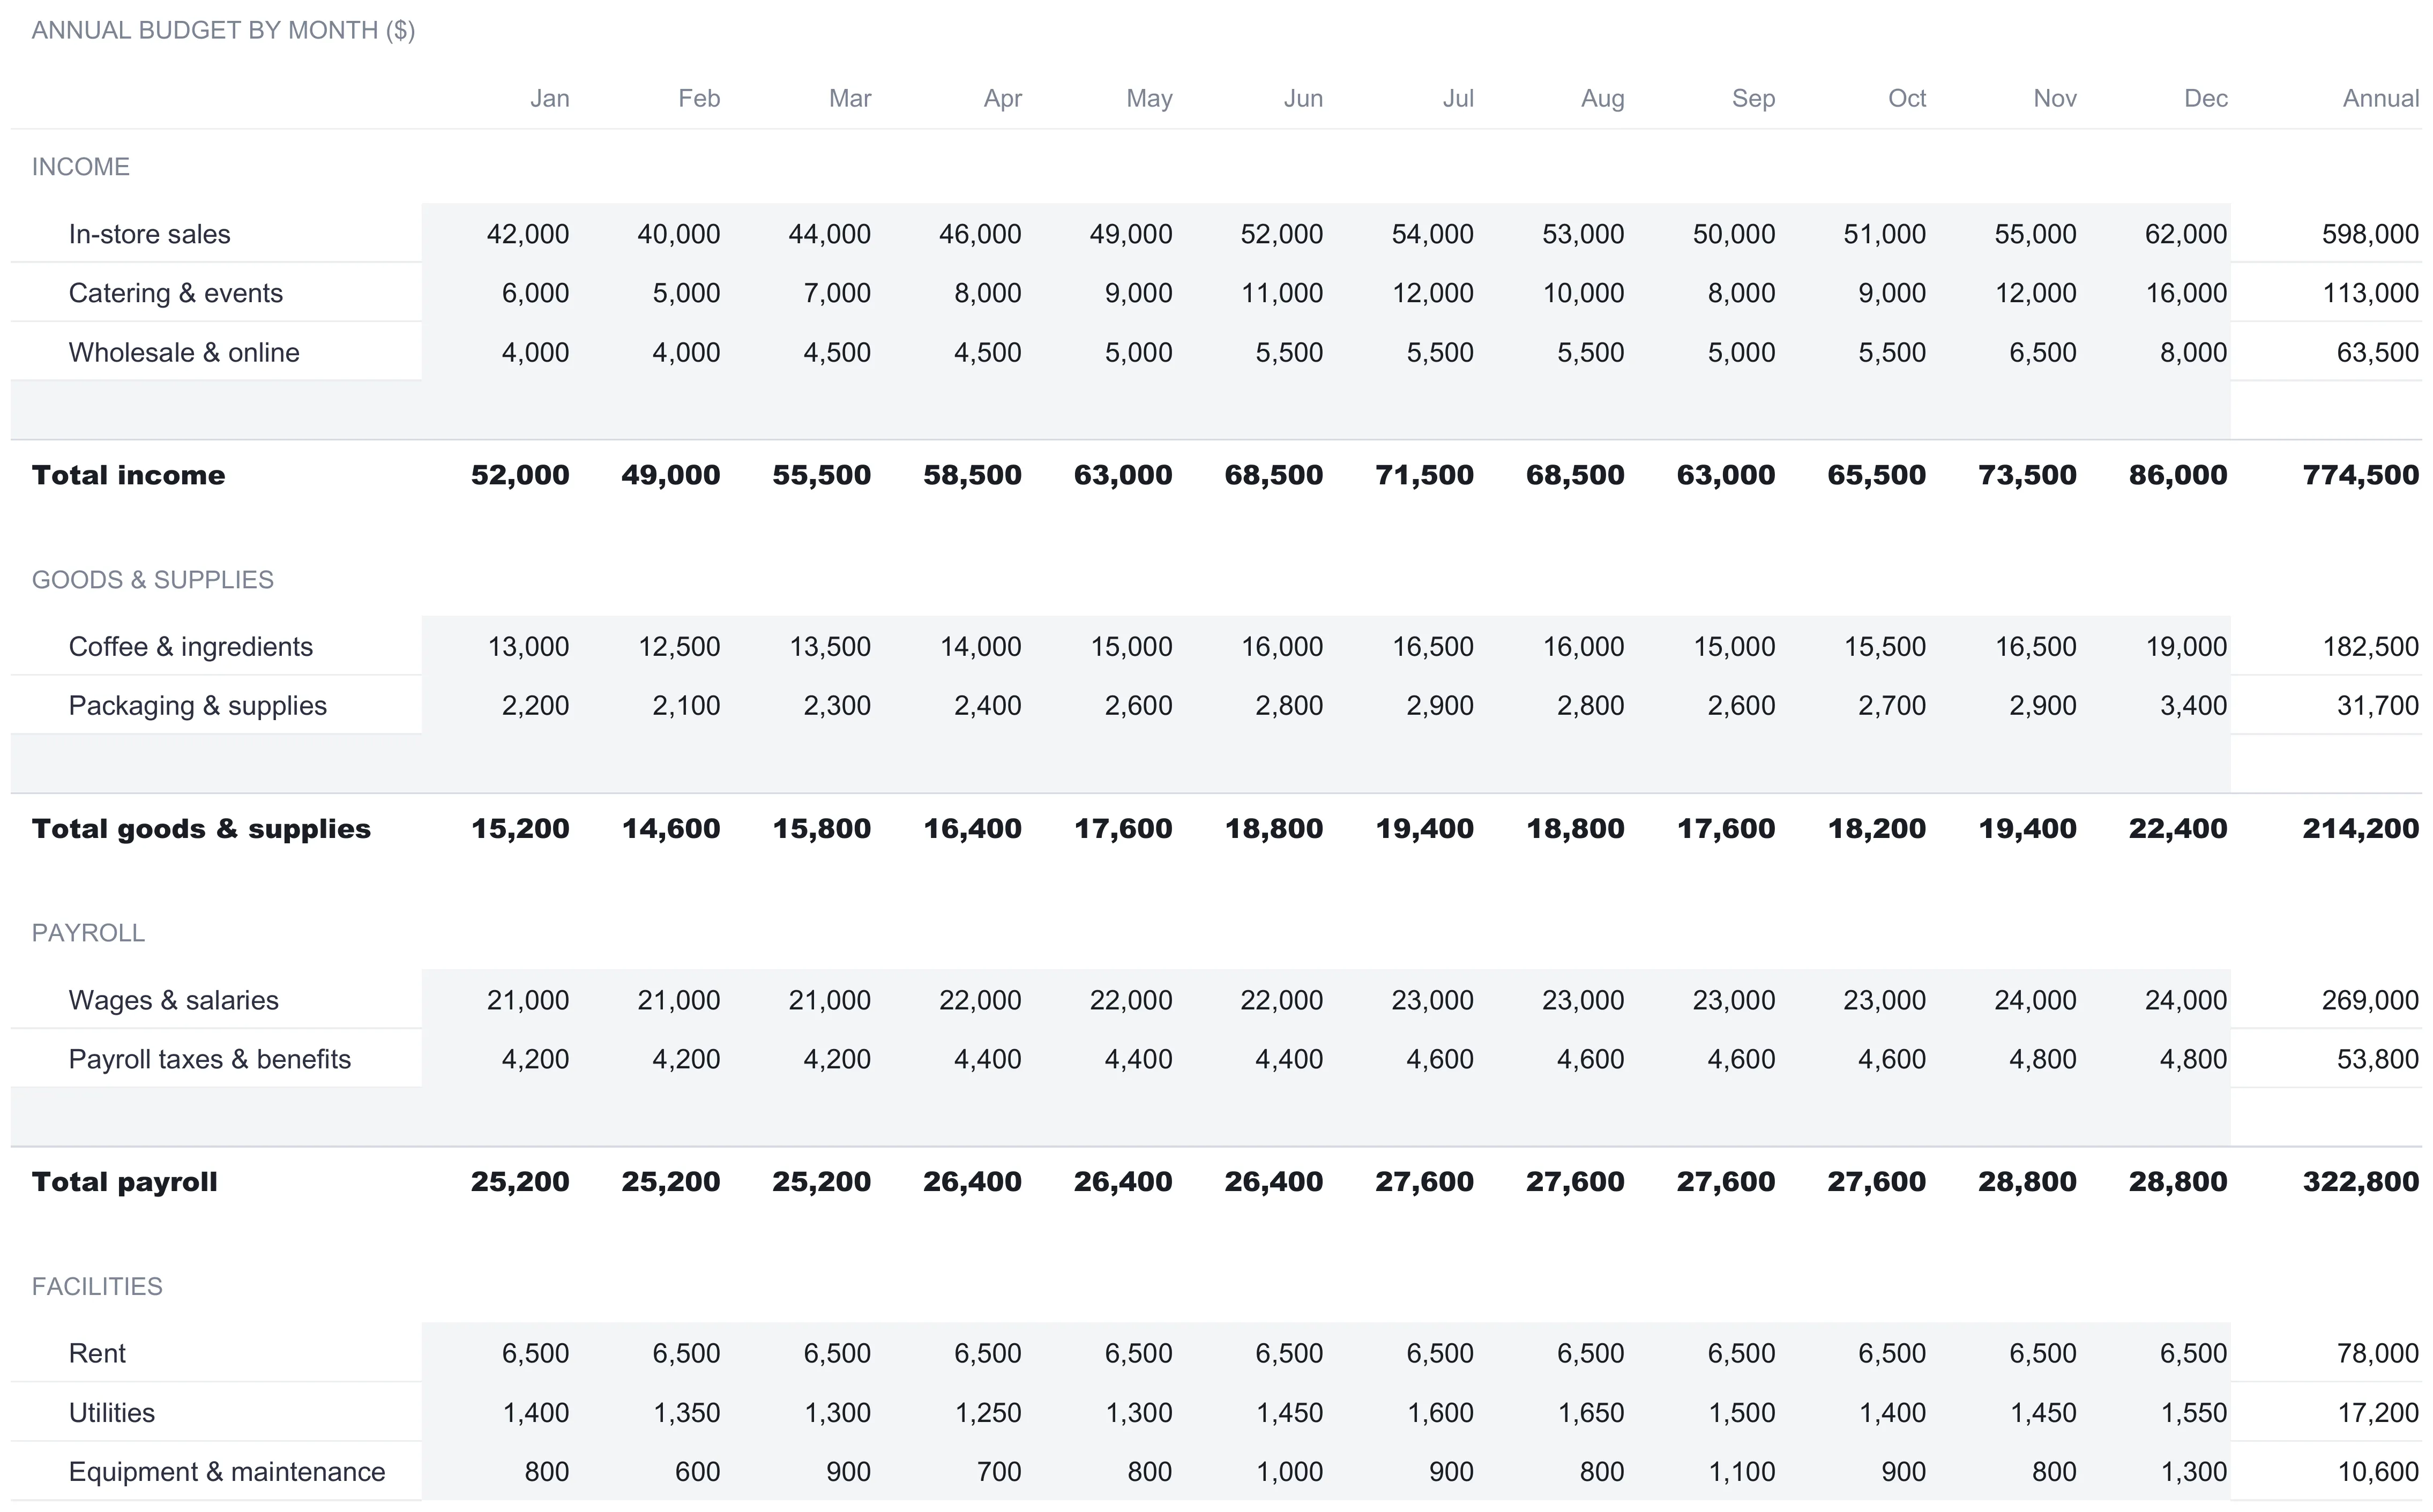
The Budget sheet is the annual plan laid out as a grid, twelve month columns from January to December plus an annual total, with income at the top and expenses grouped below.
Income in the sample cafe splits into three lines: in-store sales, catering and events, and wholesale and online. Each carries a monthly figure that rises toward the busier end of the year, and the sheet totals them. In-store sales plan to 598,000 for the year, catering to 113,000, and wholesale to 63,500, for a total income budget of 774,500.
Expenses are organized into six groups, each a labeled section with its own lines and a subtotal:
| Expense group | Lines | Annual budget ($) |
|---|---|---|
| Goods & supplies | Coffee & ingredients, packaging & supplies | 214,200 |
| Payroll | Wages & salaries, payroll taxes & benefits | 322,800 |
| Facilities | Rent, utilities, equipment & maintenance | 105,800 |
| Marketing | Advertising, promotions & loyalty | 45,000 |
| Software & fees | POS & software, bank & card fees | 23,750 |
| Admin | Insurance, accounting & legal, licenses & misc | 23,500 |
| Total expenses | 735,050 |
The bottom of the sheet subtracts total expenses from total income to give the planned net, month by month and for the year. The annual planned net is 39,450, a business that budgets to spend 735,050 against 774,500 of income. The monthly row is worth reading on its own. The early months plan to run at a small loss, January at negative 3,250 and February at negative 5,050, and the later months make it up, with December planning a 14,150 surplus. That shape is the seasonality of the business written into the plan rather than discovered at year end.
Two design habits here are worth copying into any hand-built version. Categories are renamed in place, right on this sheet, so the group labels stay fixed while the lines under them describe the actual business. And every section ends with a spare row that already sits inside its subtotal, so a new category is added by naming that row, with no formula to extend. A cafe’s “coffee & ingredients” becomes a print shop’s “paper & toner” without any rewiring.
Record what happened: the Actual sheet
The Actual sheet mirrors the Budget sheet line for line, and it is where the real numbers go. Same income lines, same expense groups, same twelve columns, so budget and actual can be compared cell against cell without any lookup.
In the sample, seven months are filled, January through July, and August onward is blank. That is the normal state of a budget mid-year: the plan covers the whole year while the actuals only reach as far as the business has lived. The recorded totals through July read 425,600 of income and 414,230 of expenses, for a recorded net of 11,370 over the seven months. Nothing on this sheet needs to know it is only partway through the year; the “months completed” figure on Settings is what tells the rest of the workbook where the actuals stop.
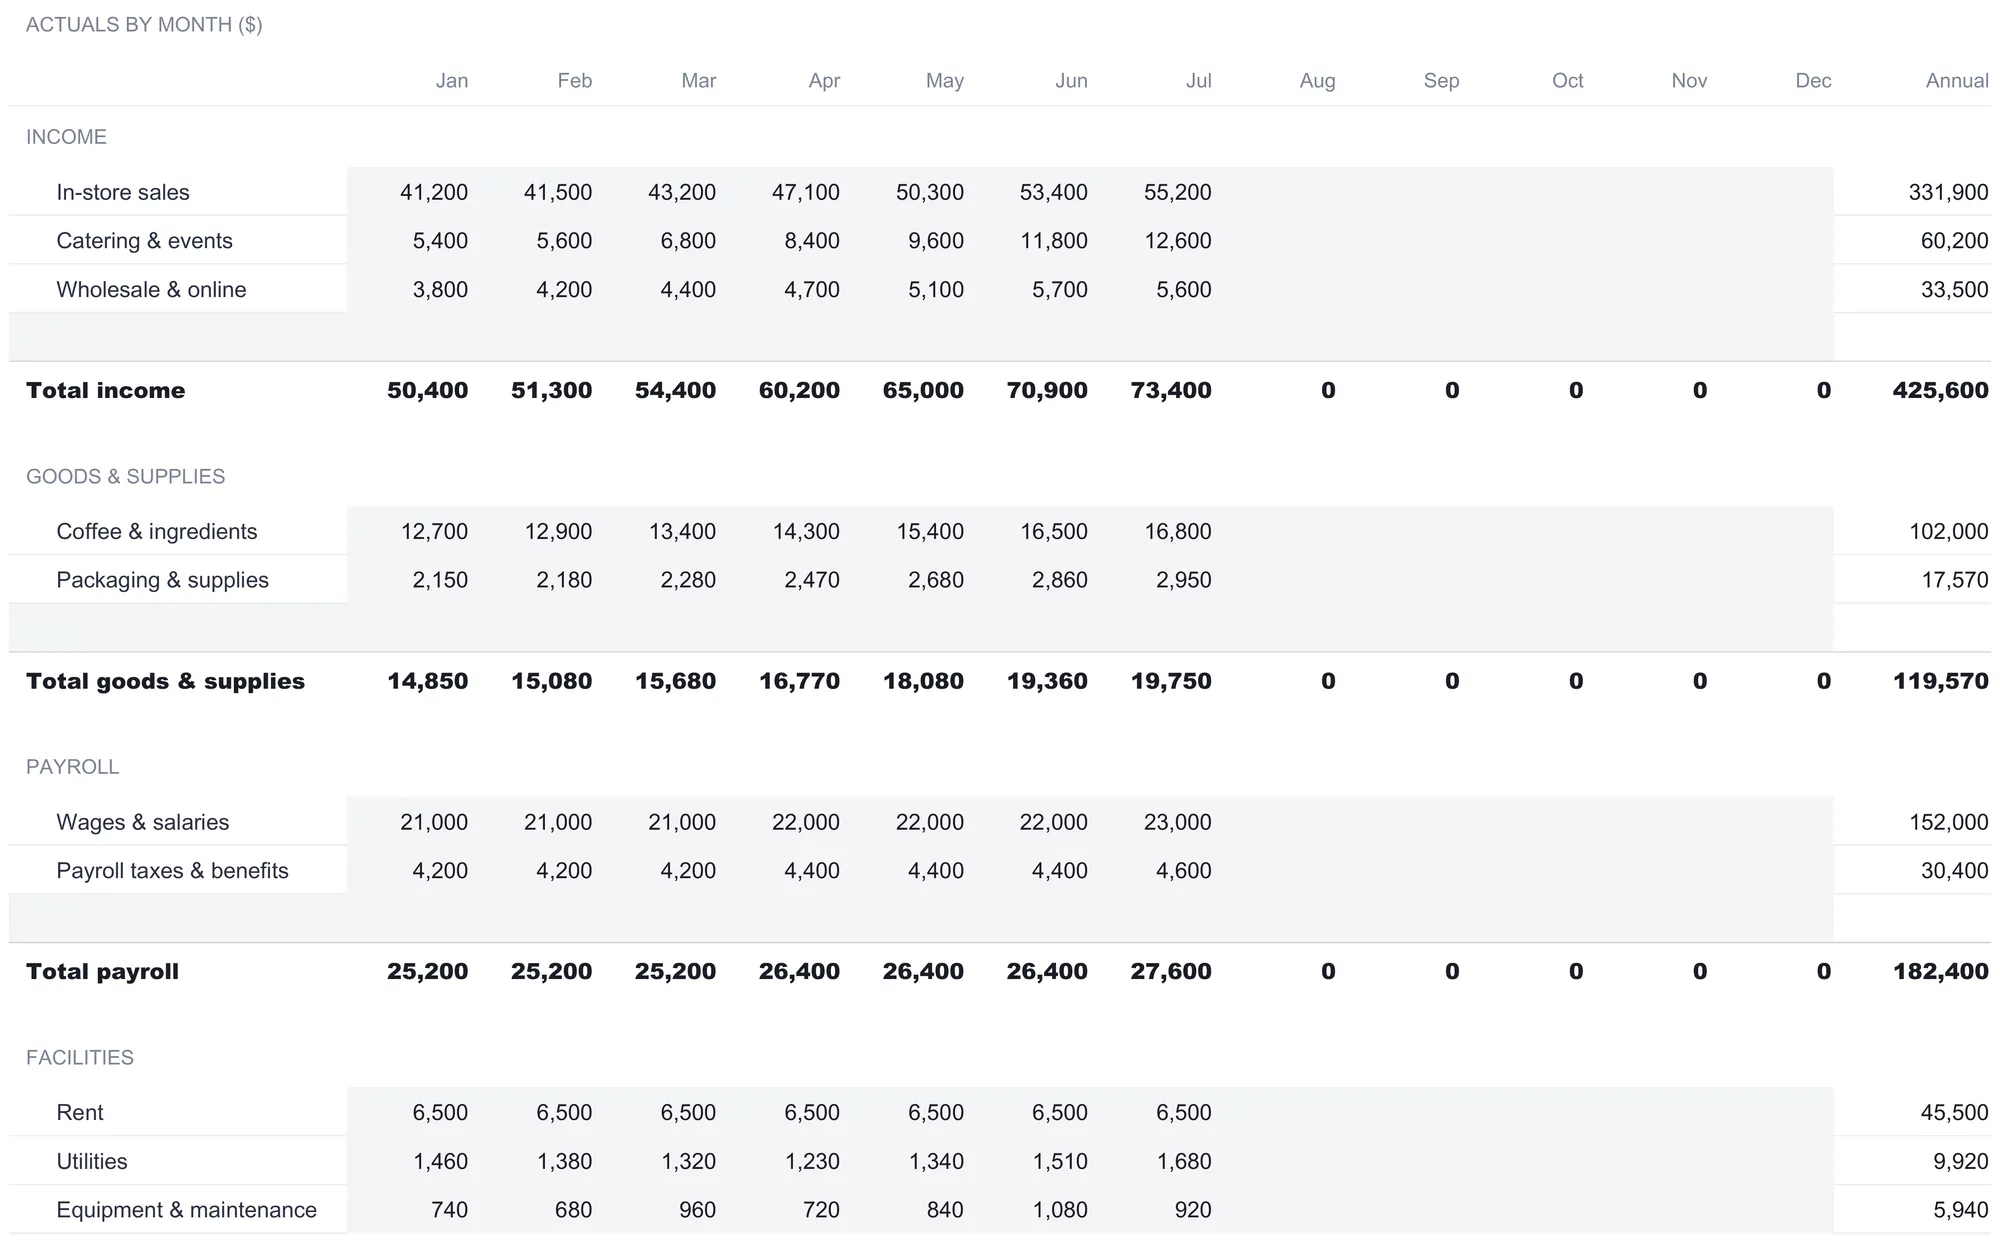
The actuals here are entered by hand, one figure per category per month. There is no bank feed and no accounting-software connection, which is the deliberate trade a spreadsheet makes. A connected app pulls transactions automatically but keeps its logic behind glass. This workbook asks for a monthly summary figure and shows every formula that acts on it. The group subtotals are formulas, so the figures that get typed are the fourteen expense lines and the three income lines. For a business that already totals its month in bookkeeping, that transfer is a few minutes’ work, and the payoff is the tracking on the next sheet.
Read the gap: the Tracker sheet
The Tracker is where a plan and a record become budget control. It lists every income line and expense category down the page, and for each one it computes eight columns. In plain terms:
- Annual budget is the full-year plan pulled from the Budget sheet.
- Actual to date sums the months you have marked completed. Behind the scenes it adds up only the columns whose month index is within the “months completed” figure, so it stops exactly where your actuals stop.
- Remaining is annual budget minus actual to date, the budget left to spend.
- % used is actual to date divided by annual budget.
- Avg / month is actual to date divided by the number of months completed, the run-rate.
- Projected year-end is that monthly average multiplied by twelve.
- Proj. vs budget is the projection minus the annual budget, positive when the run-rate is heading over.
- Status flags each line. For expenses it reads “Over”, “Under”, or “On track”, with a two percent tolerance so a line within a rounding distance of plan is not called out. For income the same logic reads “Ahead”, “Behind”, or “On track”.
The total-expenses line ties the sheet together. Against a 735,050 budget, the cafe has spent 414,230 through seven months, which is 56.4 percent of the budget used. Its run-rate averages 59,176 a month, projecting to 710,109 for the year, or 24,941 under budget, so the status reads “Under”. The income side tells the other half of the story: 425,600 earned against a 774,500 plan projects to 729,600, which is 44,900 short, so total income is flagged “Behind”. Expenses under plan and income under plan at the same time is a real situation a single bank balance would hide, and the Tracker states both plainly without drawing a conclusion for you.
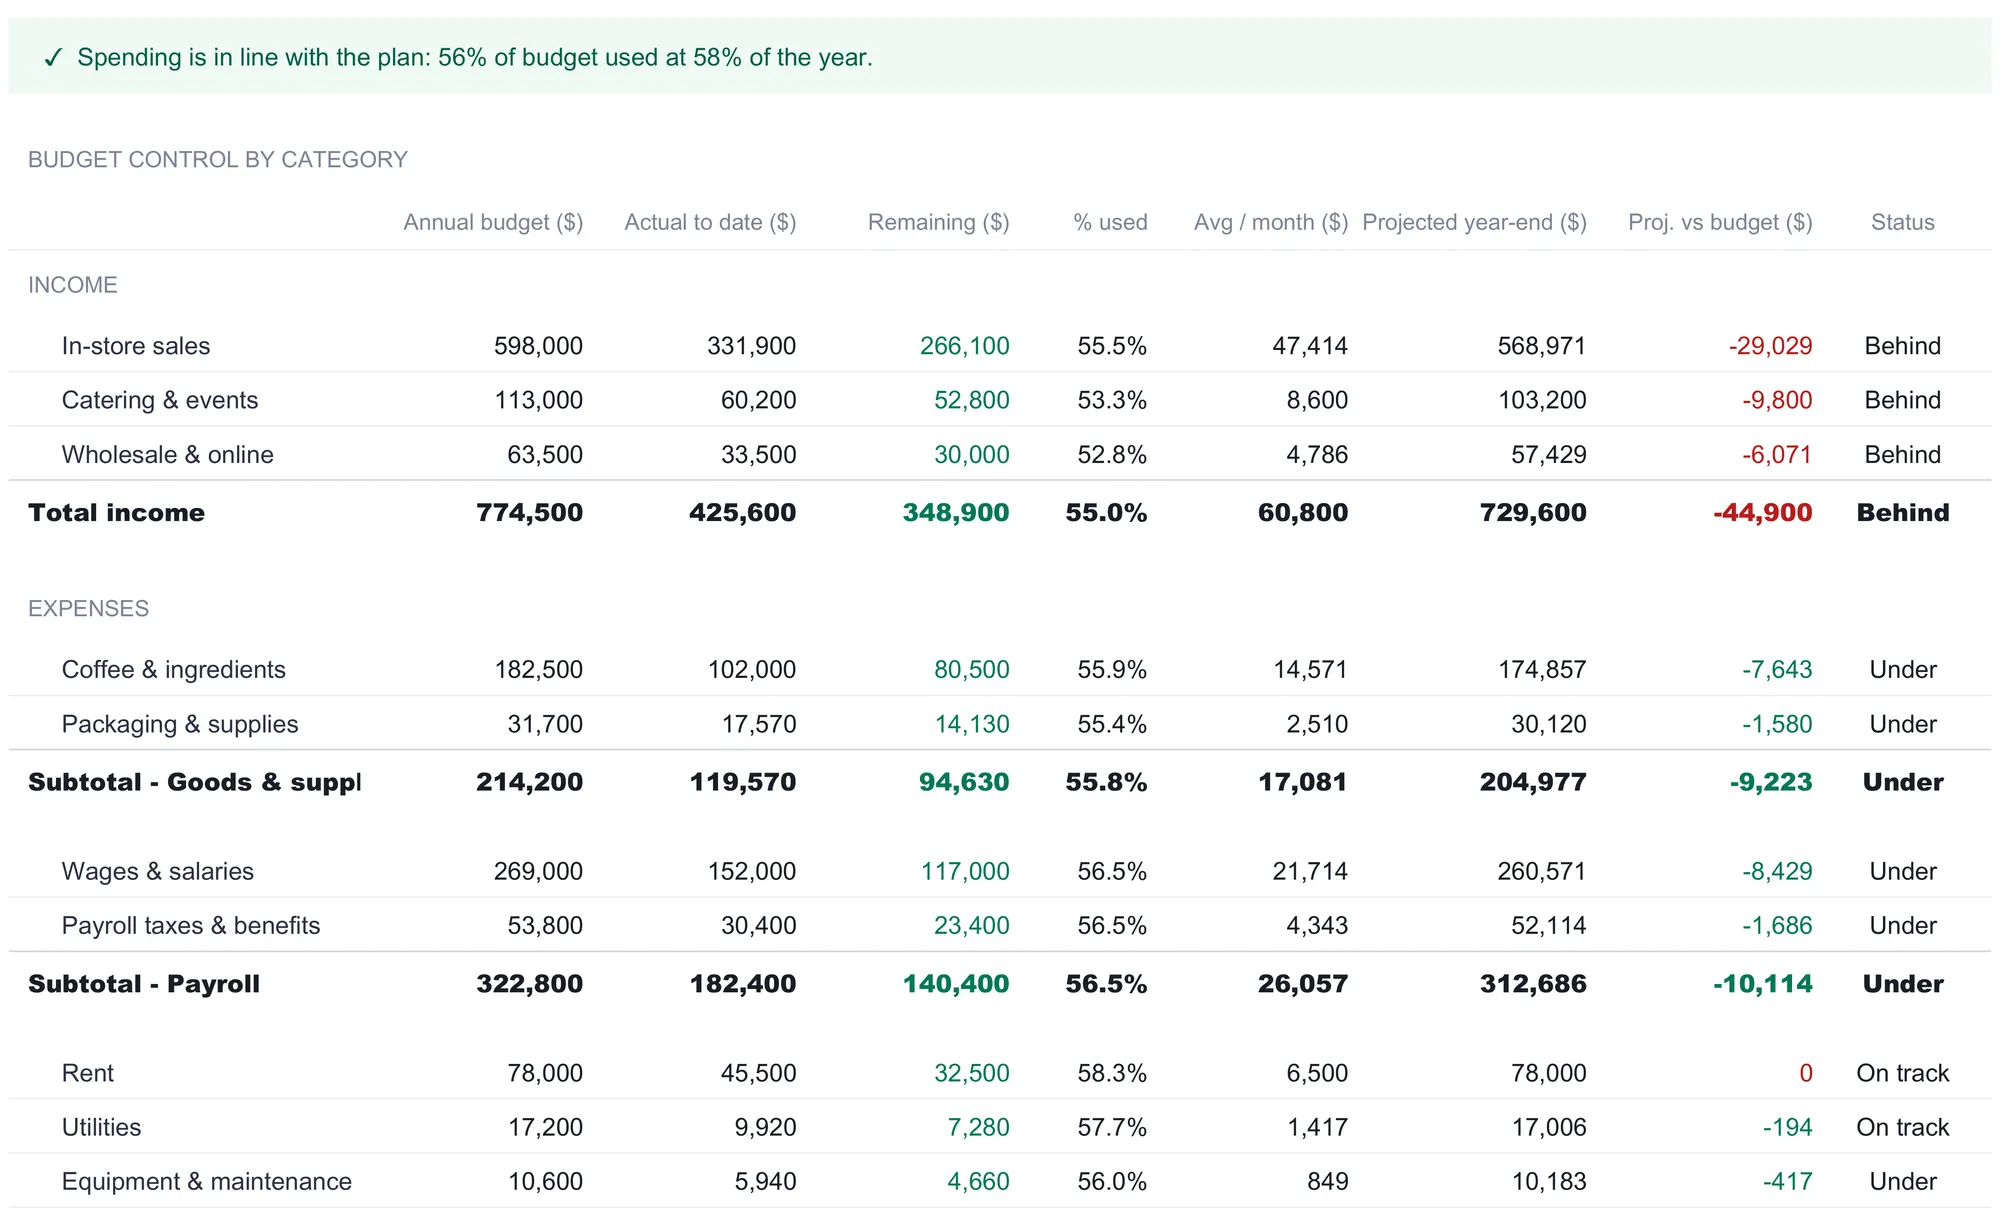
The Tracker reports at two levels at once. Individual lines such as coffee and ingredients or wages and salaries each get their own row, and a bold subtotal row rolls them into their group, so a business can read a single category or a whole group without switching sheets. A category added on the Budget and Actual sheets flows into its group subtotal here automatically, which is why the ready-made lines are a starting point rather than a fixed list. The Dashboard, one sheet up, keeps the six group subtotals and a total-expenses line for a cleaner overview, and the Tracker is where the detail behind each group lives.
The status flags are the fastest way to scan the sheet. In the sample most expense groups read “Under”, facilities reads “On track” because rent is fixed and the run-rate lands within tolerance, and the income lines all read “Behind”. The two percent tolerance matters here: without it, a category a few dollars off plan would flash a status every month, so the flag is reserved for a gap large enough to be worth a second look.
Pacing: % used against % of year elapsed
The one comparison that turns all of this into a monthly habit is simple enough to do in your head. Set the share of the budget you have used against the share of the year that has passed. If used is running higher than elapsed, spending is pacing ahead of the plan; if lower, there is slack.
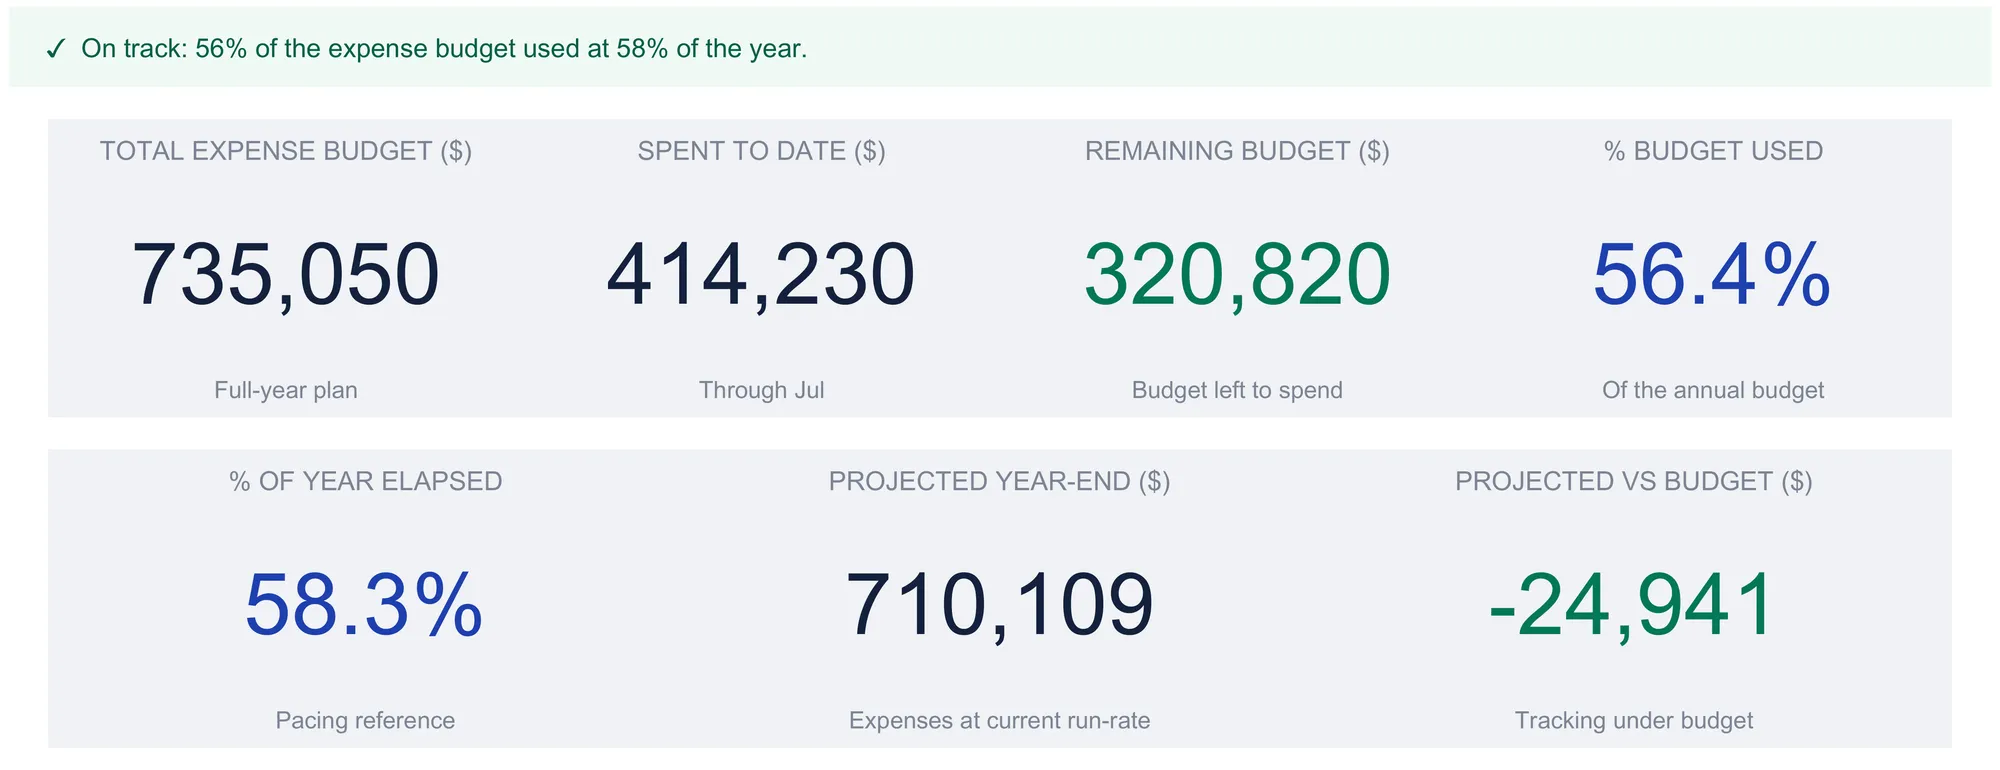
In the sample the cafe has used 56 percent of its expense budget at 58 percent of the year, so spending is fractionally behind pace, which is why the status banner reads “On track” rather than a warning. The workbook draws the line at three percentage points: once the share of budget used runs more than three points ahead of the share of the year elapsed, the banner flips to a “Pacing ahead” alert. It is a blunt rule on purpose, because a budget that only tells you something is wrong at year end tells you too late to act.
One nuance keeps the pacing honest. “Projected year-end” is a run-rate, spend so far divided by months done and multiplied by twelve, not a true forecast. It assumes the rest of the year looks like the part already lived, which for a seasonal business is only roughly true. It is a useful early-warning number rather than a promise, and it becomes more reliable with every month of actuals added.
Test a change before you commit it: the What-if sheet
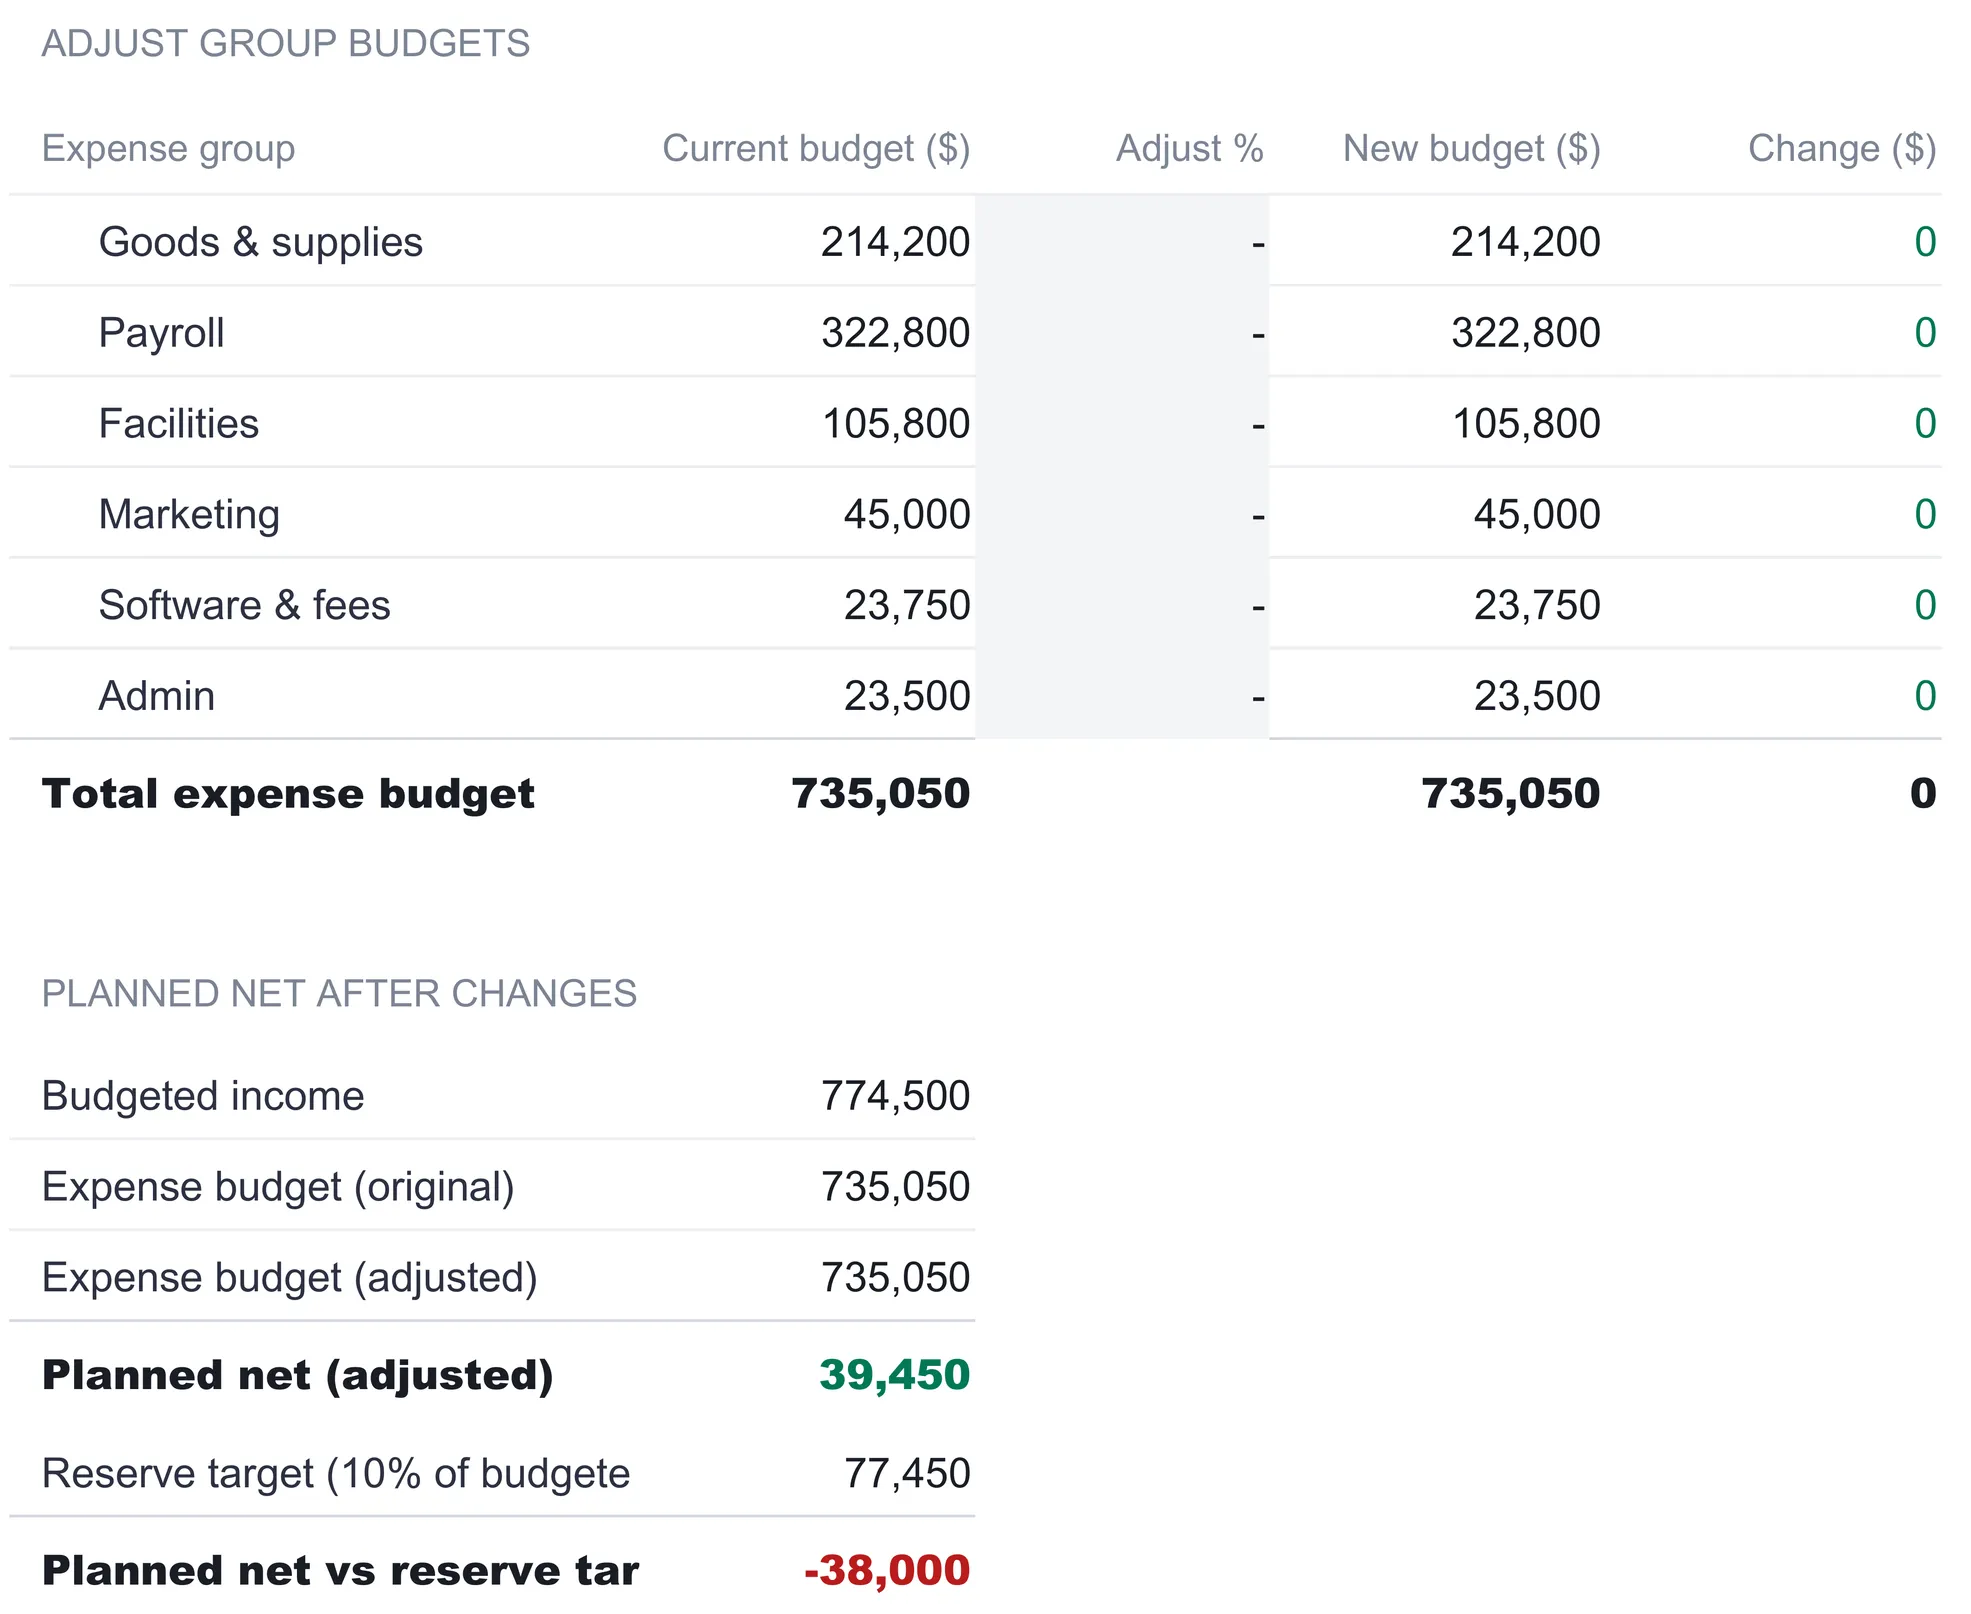
The What-if sheet answers the question a budget review always raises: what happens to the bottom line if a budget is cut or grown. It lists the six expense groups with their current budgets and an “Adjust %” column. Enter a positive or negative percentage against any group and the sheet recomputes a new budget and the change in dollars, then rolls the adjustment into a planned-net calculation.
With every adjustment left at zero, the sheet shows the starting position: 774,500 of budgeted income, a 735,050 expense budget, and a planned net of 39,450. Enter, say, negative 10 against marketing, and its 45,000 budget drops by 4,500, the total expense budget falls to 730,550, and the planned net rises to 43,950, all without disturbing the actual plan on the Budget sheet. It is a scratchpad for testing budget moves, not a commitment.
The last block is where the reserve target earns its place. The sheet compares the planned net against the reserve target set on Settings, which in the sample is 10 percent of budgeted income, or 77,450. The planned net of 39,450 falls 38,000 short of that target, a gap the sheet states in a single red line. That is a planning insight the plan alone does not surface: the budget balances and even shows a surplus, yet it does not reach the reserve the business set as its goal. The What-if sheet is where a business can see how much would have to change to close that gap.
The dashboard: seven numbers and a verdict
With the plan set, the actuals entered, and the months-completed figure current, the Dashboard reads the year at a glance. A status banner across the top states the pacing in one sentence and turns from a green check to a warning when spending runs ahead of plan. Below it sit seven KPI tiles:
| Tile | Sample value | What it means |
|---|---|---|
| Total expense budget | 735,050 | The full-year expense plan |
| Spent to date | 414,230 | Actual expenses through the months completed |
| Remaining budget | 320,820 | Budget left to spend |
| % budget used | 56.4% | Spent to date as a share of the budget |
| % of year elapsed | 58.3% | Months completed out of twelve, the pacing reference |
| Projected year-end | 710,109 | Expenses at the current run-rate |
| Projected vs budget | -24,941 | Run-rate projection against the plan, negative meaning under |
Beneath the tiles the dashboard carries a bar chart of budget against actual-to-date for each expense group, a cumulative-spend line that plots the running budget against the running actual month by month, and an expense-groups table repeating the budget, actual, remaining, and status for each group. The cumulative line makes the mid-year position vivid: the budget line climbs all twelve months while the actual line rises only through July and then holds flat, because no actuals have been entered past that point.
The number that no bank statement shows is the pairing of “spent to date” with ”% of year elapsed”. A business can always see what it has spent. Seeing that figure next to how far through the year it is, with a run-rate projection beside it, is most of the reason to keep a budget rather than just a ledger.
A worked month-end, start to finish
Putting the sheets in motion, a month-end in this workbook is short. Say the cafe has just closed its books for July. On the Actual sheet the owner enters July’s real figures in each income line and expense category, seventeen cells in all. On Settings, “months completed” moves from 6 to 7. That single change cascades: the Tracker now sums seven months into “actual to date”, recomputes each run-rate off a seven-month average, and re-flags every status; the Dashboard tiles update to 414,230 spent, 56.4 percent used against 58.3 percent elapsed, and a 710,109 projection; the pacing banner re-evaluates and stays green.
Reading the result takes a moment. Expenses are pacing just under the calendar, so the run-rate sits under budget rather than over. Facilities is on track because rent is fixed and predictable. Every income line is behind plan, projecting the year to land 44,900 under the revenue budget, which is the finding worth carrying into the next planning conversation. If the owner wants to test a response, the What-if sheet is one sheet over: trimming a discretionary group by a percentage shows immediately what it does to the planned net and how much of the reserve-target gap it would close. None of the reading requires touching a formula, and none of it waited until December to appear.
Excel or Google Sheets for a business budget
The template is an .xlsx file built on ordinary formulas, with no macros and no add-ons, so it behaves the same in Microsoft Excel and in Google Sheets after an upload. The currency dropdown, the SUMPRODUCT that gates actuals by the months-completed count, and the status flags all carry across. Google Sheets suits a business whose owner and bookkeeper want to open the same file from different places; Excel suits a business that prefers a local file on one machine. The structure described here builds identically in either, and moving the sheet from one to the other does not change a number.
Where the budget meets the books
A budget is only as current as the actuals feeding it, and those actuals come from the month’s bookkeeping. The natural companion to this template is a clean set of books to read the monthly totals from. Our Business Bookkeeping Spreadsheet Template ($29) records each transaction with a date, a category and an amount, then totals the ledger by category on its Categories sheet and month by month on its Monthly sheet. Those totals are what a month-end entry on the Actual sheet here reads from, and the workflow of keeping those books in a spreadsheet is its own walkthrough. Where a budget looks forward and holds the plan, a profit and loss statement looks backward and states the result, and the two read the same categories from opposite ends of the period.
For US businesses, the recordkeeping habit behind all of this is what the tax authorities expect anyway. The IRS notes that a business may pick any recordkeeping system that “clearly shows your income and expenses,” and the SBA’s small-business guidance frames managing your finances around exactly that separation of money in from money out. A monthly budget that already sorts income and spending into categories turns year-end preparation into a copy job rather than a reconstruction.
Which budget fits the job
- Monthly Business Budget Spreadsheet Template ($29) is the workbook this walkthrough follows: the plan, the actuals, the budget-versus-actual tracker, the what-if scratchpad, and the seven-KPI dashboard, built for a small business watching revenue against operating costs through the year.
- Business Bookkeeping Spreadsheet Template ($29) sits one step upstream, recording the transactions that become the monthly totals this budget reads.
Related
- How to Do Bookkeeping in a Spreadsheet - the transaction ledger that feeds the actuals side of a budget
- How to Build a Profit and Loss Statement in a Spreadsheet - the backward-looking counterpart that reports the same categories as results
- How to Forecast Sales in a Spreadsheet - building the revenue side of the plan before the year starts
Frequently asked questions
What is the difference between a business monthly budget and a profit and loss statement?
A budget is the plan you set before the period, and a profit and loss statement is the record of what actually happened. This workbook holds both sides: the Budget sheet is the plan by month, the Actual sheet is the record, and the Tracker sheet lines them up so the gap between planned and actual is visible category by category rather than only at year end.
Can I use this template for a personal or household budget?
The structure would work, but the categories are built for a business: income splits into sales lines, and expenses group into goods and supplies, payroll, facilities, marketing, software and fees, and admin. A household has no payroll or wholesale line, so a personal budget template with living-cost categories fits that job better. This one is aimed at a small business tracking revenue against operating costs.
How does the projected year-end figure work when I have only entered a few months?
It is a run-rate, not a forecast. The Tracker divides actual spending to date by the number of months you mark completed on Settings, then multiplies by twelve. With seven months entered, expenses of 414,230 average 59,176 a month, which projects to 710,109 for the year. The number assumes the remaining months look like the ones so far, so it moves each time you add a month of actuals.
Can I add or rename expense categories?
Yes. Categories are renamed directly on the Budget and Actual sheets, and every section ends with a blank row that already sits inside its subtotal, so naming that row adds a line without touching a formula. For more room, a row inserted between a section label and its subtotal is picked up by the group total and flows through to the Tracker and Dashboard.
Does changing the currency convert the numbers?
No. The Settings sheet has a currency dropdown with 35 symbols, and choosing one relabels every money column header and KPI across the workbook. It changes the label only and leaves the underlying figures untouched, so a business working in euros or pounds sees the right symbol without any conversion of the amounts.
Sources
- Manage your business - U.S. Small Business Administration
- Recordkeeping - Internal Revenue Service
About this article
Every figure, column name, formula, and feature description checked on 2026-09-10 against the shipped Monthly Business Budget workbook business-budget-monthly-pro-e65100d8b360.xlsx (Dashboard, Budget, Actual, Tracker, What-if, Settings, How to Use), and the Business Bookkeeping claims against business-bookkeeping-pro-c9ea354d6f7a.xlsx. SBA and IRS references checked against the live pages at writing time. Last reviewed September 2026.