
For a free FIRE timeline in seconds, a savings-rate calculator does the job. For a year-by-year plan you own, a spreadsheet template models the withdrawals, taxes, and changing expenses that simple calculators skip. For stress-testing against real market history, backtesting tools like cFIREsim. Most people who reach FIRE use two or three of these together rather than one.
The FIRE community (Financial Independence, Retire Early) has produced an enormous number of calculators, spreadsheets, and tools. Some are genuinely useful. Others oversimplify to the point of being misleading. After working through many of them, here’s what actually helps.
Quick picks: For a free instant calculation, FinancialAha’s FIRE Calculator gives a timeline based on savings rate and expenses. For detailed year-by-year projections in a spreadsheet you own, the Retirement Financial Planning template (one-time purchase) handles what-if scenarios, milestones, and income vs expense modeling. For historical backtesting, cFIREsim runs your plan against real market data (free). For the most comprehensive paid software, ProjectionLab ($129/year) covers Roth ladders and tax optimization.
You can run the quick timeline right here before reading further:
The Problem with Simple Calculators
A basic FIRE calculator asks for your savings, income, expenses, and expected return rate, then spits out a date. It feels satisfying to see “you can retire in 12 years” but the calculation hides important assumptions.
It assumes steady returns every year (markets don’t work that way). It ignores taxes on withdrawals. It doesn’t account for healthcare costs before Medicare eligibility. It treats expenses as flat when they change significantly through different life stages. And it usually ignores inflation beyond a simple adjustment.
Simple calculators are useful for a rough sense of direction. They’re not planning tools.
Detailed Spreadsheet Templates
This is where more serious FIRE planning happens. The Retirement Financial Planning Spreadsheet handles year-by-year projections including variable withdrawal rates, different return scenarios, and the ability to model expenses changing over time.
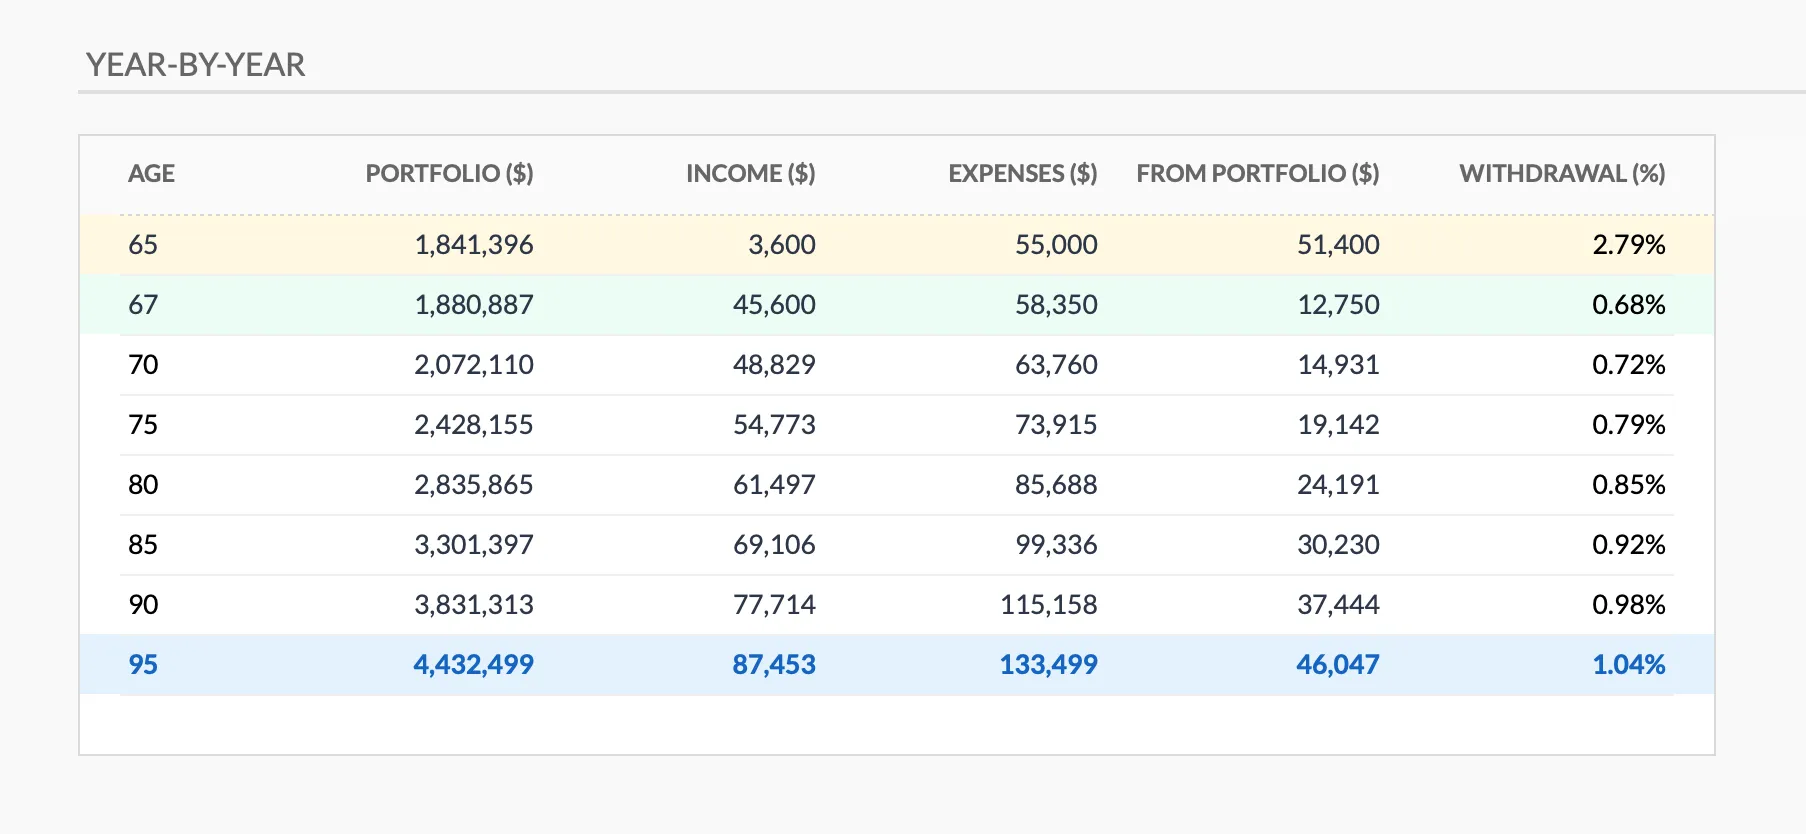 The year-by-year tab in the Retirement Financial Planning Spreadsheet (Premium tier) tracks portfolio, income, expenses, and the annual withdrawal rate across the full retirement horizon.
What spreadsheets do that calculators can’t: Model specific scenarios. Planning to work part-time for five years before fully retiring? Expecting a pension starting at 60? Want to see the impact of paying off a mortgage early? Spreadsheets let you build your actual situation rather than fitting into a generic formula.
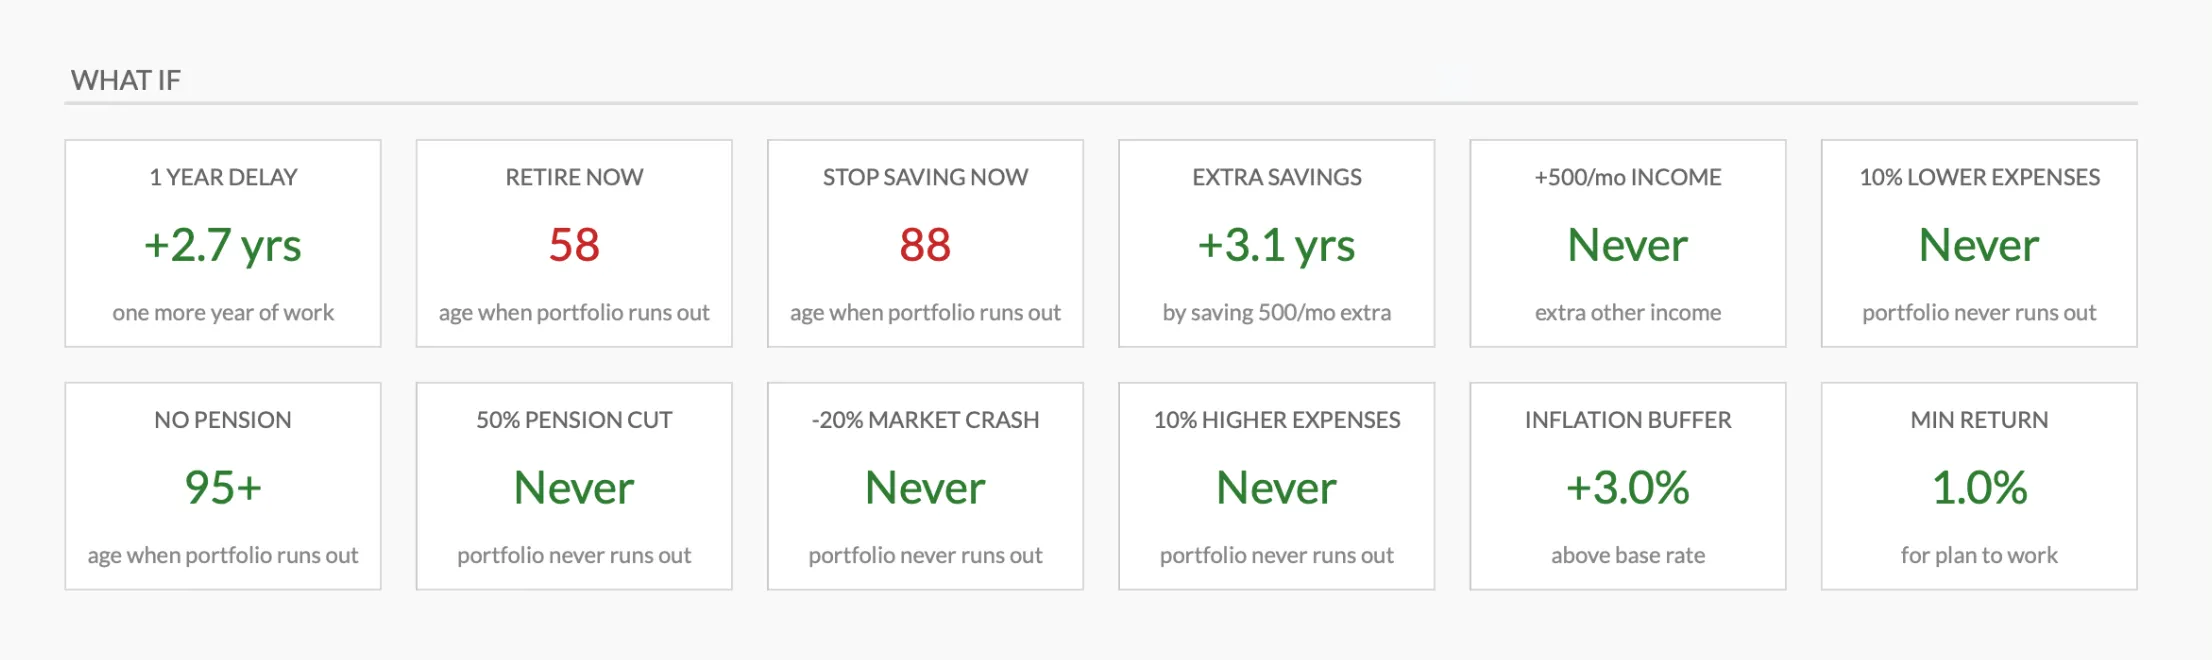 Built-in what-if cards recompute the plan for common shocks and choices, from a one-year delay to a 20% market crash, without touching a formula.
If you are weighing where to build all this, Google Sheets vs Excel for retirement planning walks through the trade-offs; this template is built for Google Sheets.
The Financial Planning Spreadsheet adds net worth tracking alongside projections, which helps FIRE planners see current position and future trajectory in one place.
The learning curve: Building a custom FIRE spreadsheet from scratch requires solid spreadsheet skills. Template-based approaches reduce this significantly - the formulas and structure are built, and you customize the inputs. Most people can adapt a well-built template in under an hour.
Popular Free Online Calculators
cFIREsim runs historical backtesting against actual market data rather than using assumed return rates. You set a portfolio value, withdrawal rate, and time horizon, and it shows what percentage of historical periods would have succeeded. This is genuinely useful for stress-testing a plan.
FIRECalc does similar historical analysis with more customizable inputs - Social Security timing, pension income, spending changes, portfolio allocation adjustments. The interface is dated but the math is solid.
The Mad Fientist Calculator tracks savings rate against a FIRE target with projections. Simple but effective for the accumulation phase when the main question is “how long until I hit my number?”
Networthify provides a clean, visual calculation of years to retirement based on savings rate. Good for the initial “is this even possible?” moment. Limited for detailed planning.
Apps and Software
Empower (free) - the retirement planning tool within Empower’s dashboard runs Monte Carlo simulations against your actual portfolio. If your investments are linked to Empower, this provides personalized projections with real asset allocation data. It’s one of the more sophisticated free tools available.
ProjectionLab ($129/year, plus a free Basic tier) - purpose-built for FIRE planning with scenario comparison, tax modeling, and Roth conversion ladders. For people deep into FIRE optimization, the detail level exceeds what most spreadsheets offer without custom formulas.
Boldin (formerly NewRetirement, free basic / $144/year PlannerPlus) - comprehensive retirement planning that handles FIRE scenarios alongside traditional retirement planning. Social Security optimization, tax bracket management, and healthcare cost modeling are all included.
For a wider look at the paid and free apps in this space, see our roundup of retirement planning software and tools.
What Matters for FIRE Planning
Sequence of returns risk. A 7% average return means different things depending on whether the bad years happen early or late in retirement. Tools that use Monte Carlo simulation or historical backtesting capture this. Simple average-return calculators don’t.
Tax treatment. Withdrawals from traditional 401(k), Roth IRA, and taxable brokerage accounts are all taxed differently. FIRE planning without tax consideration can be off by 20-30%. Spreadsheets handle this with separate columns for each account type.
Healthcare before Medicare. Medicare coverage generally starts at 65, so anyone retiring earlier bridges the gap with their own coverage. In the US that is often $500-$1,500/month for a family through marketplace insurance, and this single expense can shift a FIRE date by years.
Expense evolution. Early retirement spending often has phases - higher spending initially (travel, hobbies), lower in middle years, potentially higher again for healthcare later. Flat expense assumptions miss this entirely.
A Practical Approach
Most people who reach FIRE used multiple tools along the way. A simple calculator for initial motivation and rough planning. A detailed spreadsheet for year-by-year modeling as the date approaches. And backtesting tools like cFIREsim for final confidence checks.
Starting with a spreadsheet template that handles the core projections, then supplementing with free calculators for specific questions, provides a solid foundation without needing to pay for dedicated software. As the portfolio grows and the target date gets closer, more detailed modeling becomes worthwhile.
The most important calculation, though, is also the simplest: savings rate. How much of your income goes toward investments determines the timeline more than any other variable, so it is the number worth pinning down first. The FIRE Calculator turns a savings rate into a timeline in seconds, and the Retirement Financial Planning template picks up from there when you want the year-by-year detail on paper you own.
FIRE Tool Comparison
| Tool | Cost | Type | Historical Backtesting | Tax Modeling | Year-by-Year Projections | Best For |
|---|---|---|---|---|---|---|
| FinancialAha FIRE Calculator | Free | Web calculator | No | No | No | Quick FIRE timeline estimate |
| FinancialAha Retirement Planner | One-time | Google Sheets | No | Manual modeling | Yes | Detailed projections you own |
| cFIREsim | Free | Web app | Yes (historical) | Basic | Yes | Stress-testing against real market history |
| FIRECalc | Free | Web app | Yes (historical) | Basic | Yes | Customizable historical simulations |
| Networthify | Free | Web app | No | No | No | Visual savings rate to FI timeline |
| Mad Fientist Calculator | Free | Web app | No | No | No | Savings rate tracking during accumulation |
| Empower Dashboard | Free | Web app + portfolio | Monte Carlo | Partial | Yes | Linked portfolio projections |
| ProjectionLab | Free basic / $129/yr | Web app | Monte Carlo | Yes (Roth ladder, brackets) | Yes | Deep FIRE tax optimization |
| Boldin (formerly NewRetirement) | Free / $144/yr | Web app | Monte Carlo | Yes | Yes | Comprehensive retirement + FIRE |
Related
- Retirement Financial Planning Spreadsheet - detailed retirement projections
- Financial Planning Spreadsheet - net worth and financial goal tracking
- Best Retirement Planning Software and Tools - the wider paid and free app landscape
- Google Sheets vs Excel for Retirement Planning - choosing where to build your projections
- Prepare for Retirement: Your Guide to Financial Freedom
- Financial Independence Spreadsheet: 5 Options Ranked - the FI-specific spreadsheets compared side by side
- Financial Independence Data: FIRE and Wealth - FIRE numbers by city and country from government data
- Big Improvements to Our Retirement Planning Spreadsheet - the scenario and what-if updates behind the template above
Frequently asked questions
What is the 4% rule in FIRE?
The 4% rule suggests that withdrawing 4% of your portfolio in the first year of retirement, then adjusting for inflation annually, gives a high probability of the money lasting 30 years. It's based on historical US market data. Many FIRE planners use a more conservative 3.5% or 3% rate for longer retirements.
How much money do I need to FIRE?
The common formula is annual expenses multiplied by 25 (based on the 4% rule). So if you spend $40,000 per year, the target would be $1,000,000. This varies significantly based on withdrawal rate assumptions, expected investment returns, and how many years the money needs to last.
Are online FIRE calculators accurate?
Simple calculators provide useful estimates but miss important variables like tax implications, varying return sequences, healthcare costs, and changing expense levels. They're good starting points but not sufficient for detailed planning. Spreadsheets allow modeling these additional factors.
What's the difference between regular FIRE, lean FIRE, and fat FIRE?
These describe different spending levels in early retirement. Lean FIRE targets minimal expenses (often under $40,000/year), regular FIRE targets moderate spending ($40,000-$100,000/year), and fat FIRE targets higher spending (above $100,000/year). Each requires a different portfolio size.
Can I do FIRE planning entirely in a spreadsheet, or do I need paid software?
A spreadsheet handles the parts most people care about: year-by-year projections, withdrawal rates, separate accounts, and expenses that change over time. Paid tools like ProjectionLab or Boldin add automated Monte Carlo simulation and deeper tax modeling. For many people a template plus a free backtesting tool covers the planning without a subscription; the paid software earns its cost mainly for detailed tax and Roth-conversion optimization.
Which FIRE tool is worth starting with?
A free savings-rate calculator answers the first question, whether an early-retirement date is realistic at all, in seconds. Once the date gets closer, a spreadsheet you own lets you model your actual pension, part-time income, and mortgage payoff rather than a generic formula. The FinancialAha FIRE Calculator covers the quick timeline, and the Retirement Financial Planning template covers the year-by-year detail.
Does the FinancialAha retirement template run Monte Carlo simulations?
No. It builds deterministic year-by-year projections you can adjust by hand, with built-in what-if scenarios (retire now, one more year, a market crash, a pension cut). For probability-based Monte Carlo or historical backtesting, free tools like cFIREsim or Empower's dashboard pair well alongside it.
Sources
- ProjectionLab Pricing - ProjectionLab
- Boldin (formerly NewRetirement) Pricing - Boldin
- When does Medicare coverage start - Medicare.gov (U.S. Centers for Medicare & Medicaid Services)
About this article
Competitor prices for ProjectionLab and Boldin verified against each vendor's live pricing page. Template features described from the Retirement Financial Planning Spreadsheet's own year-by-year projection and what-if scenario tabs. Last reviewed August 2026.