免费 股票交易日志 电子表格模板
记录股票交易的买入、卖出和盈亏详情。通过累计盈亏计算跟踪交易表现。
Upgrade your spreadsheet
Here is how you unlock a better version.
- Full-featured Stock Trading Journal with dashboard and detailed analytics
- Pre-filled subcategories, sample scenarios, and helper calculations
- Larger data capacity for real-world usage
- Log up to 200 trades with ticker, date, direction (Long/Short), shares, entry price, exit price, strategy, and notes
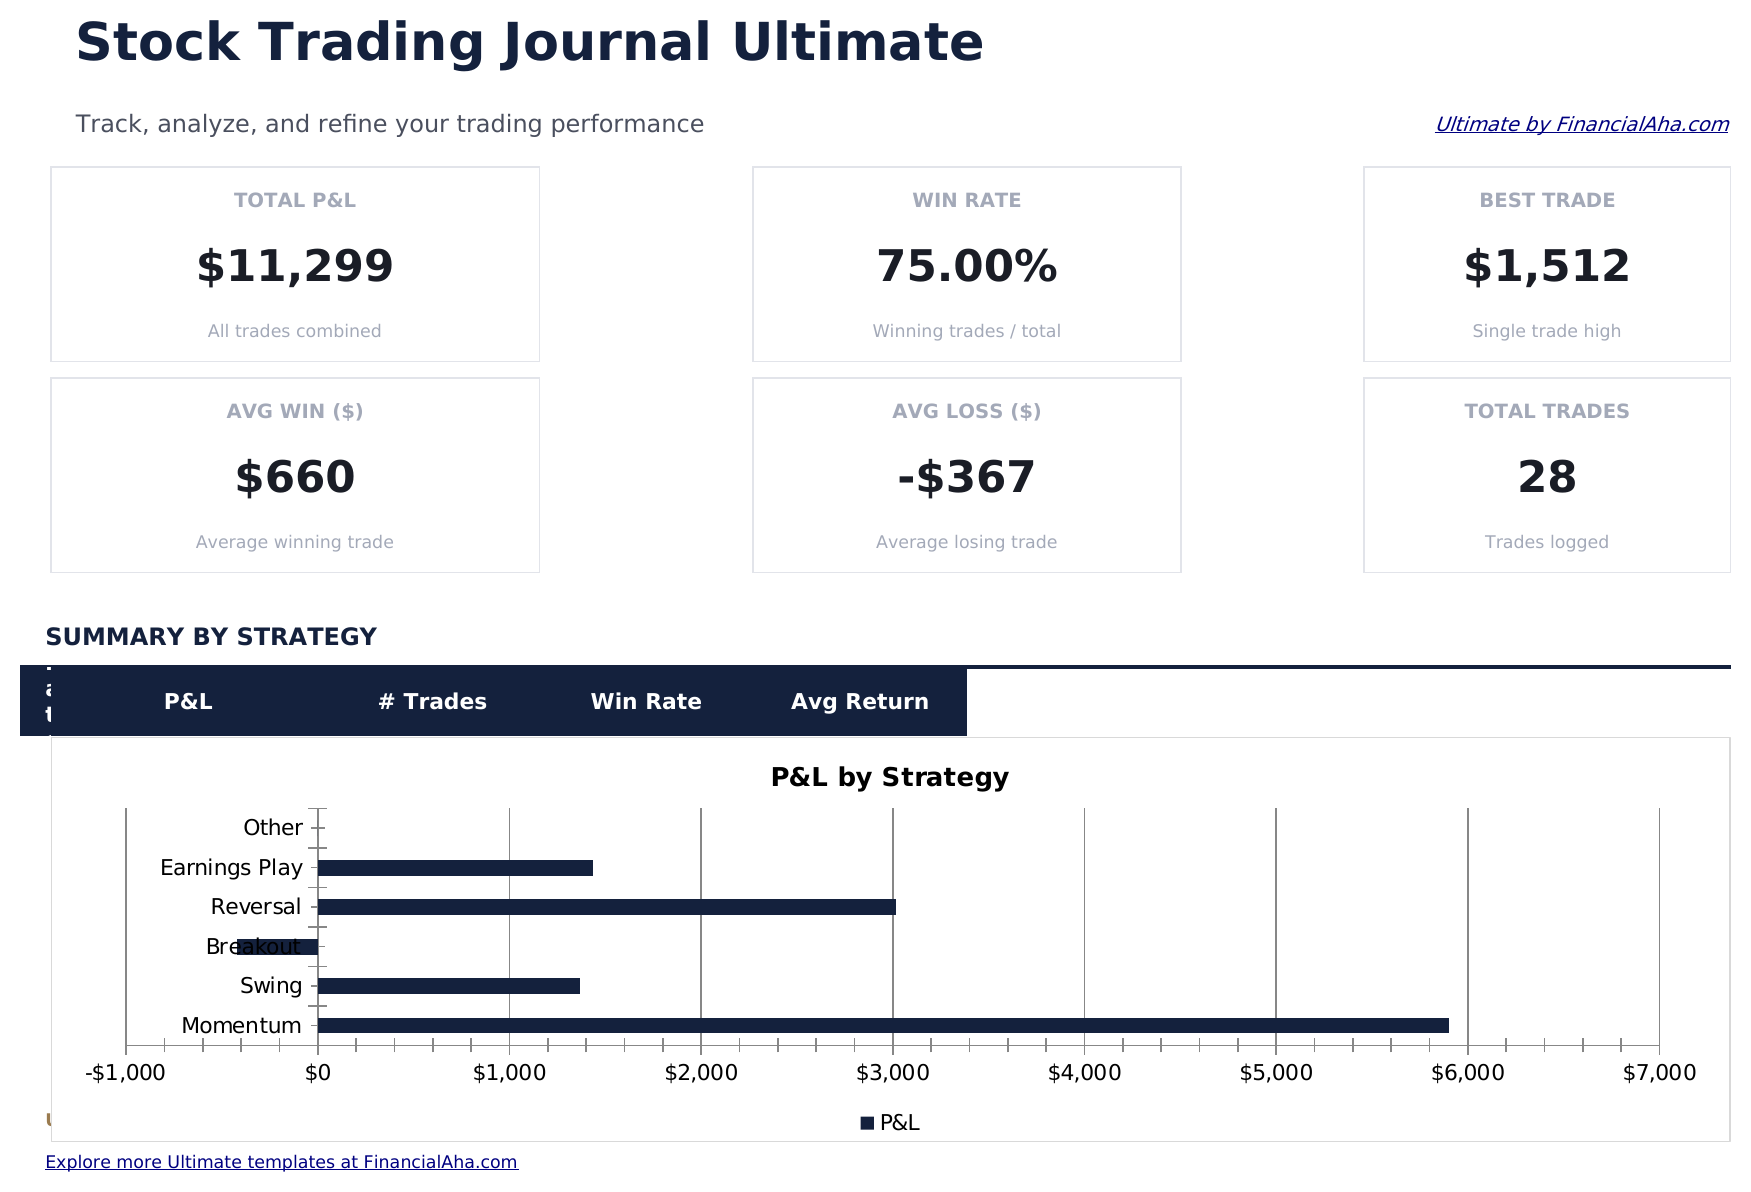
- Dashboard with 6 KPI cards: total P&L, win rate, best trade, average win, average loss, and total trades
- Performance Summary showing total trades, wins, losses, win rate, average gain, average loss, and largest win and loss by ticker
包含内容
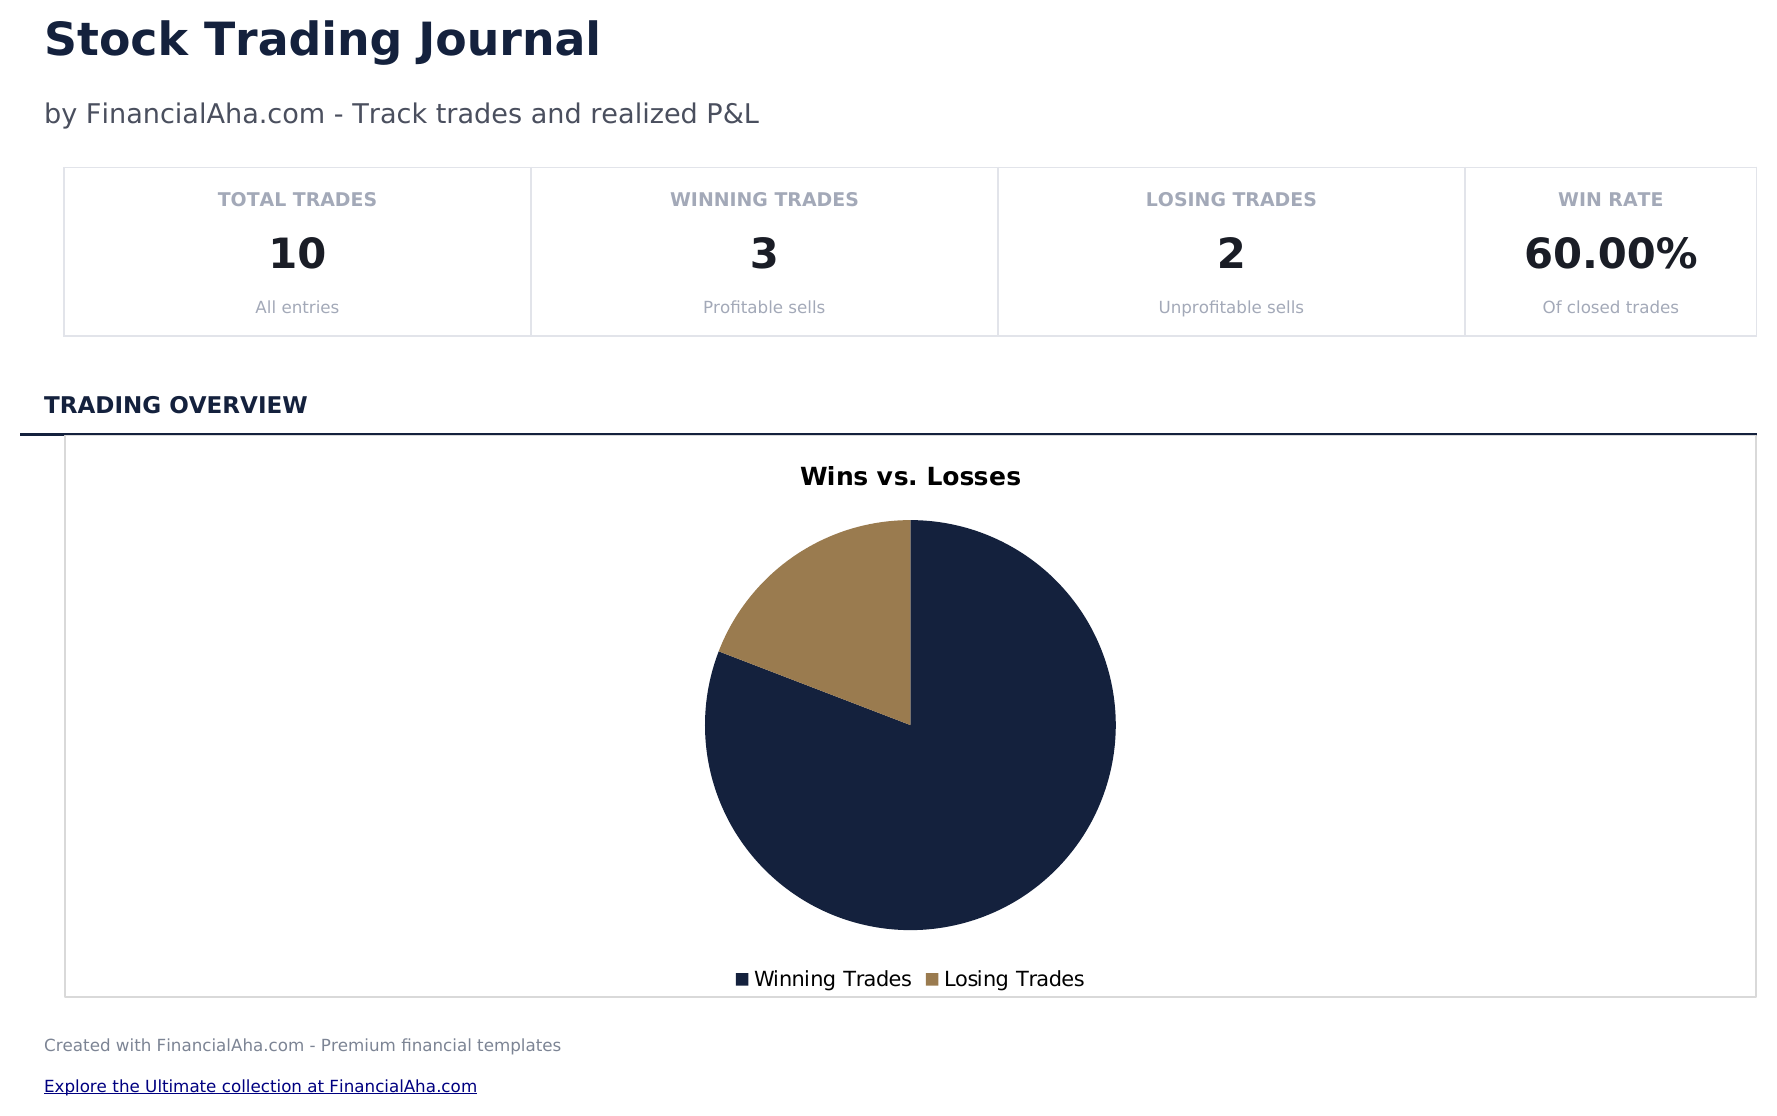
- 仪表板提供交易表现指标,显示总交易次数、胜率、平均回报和累计盈亏
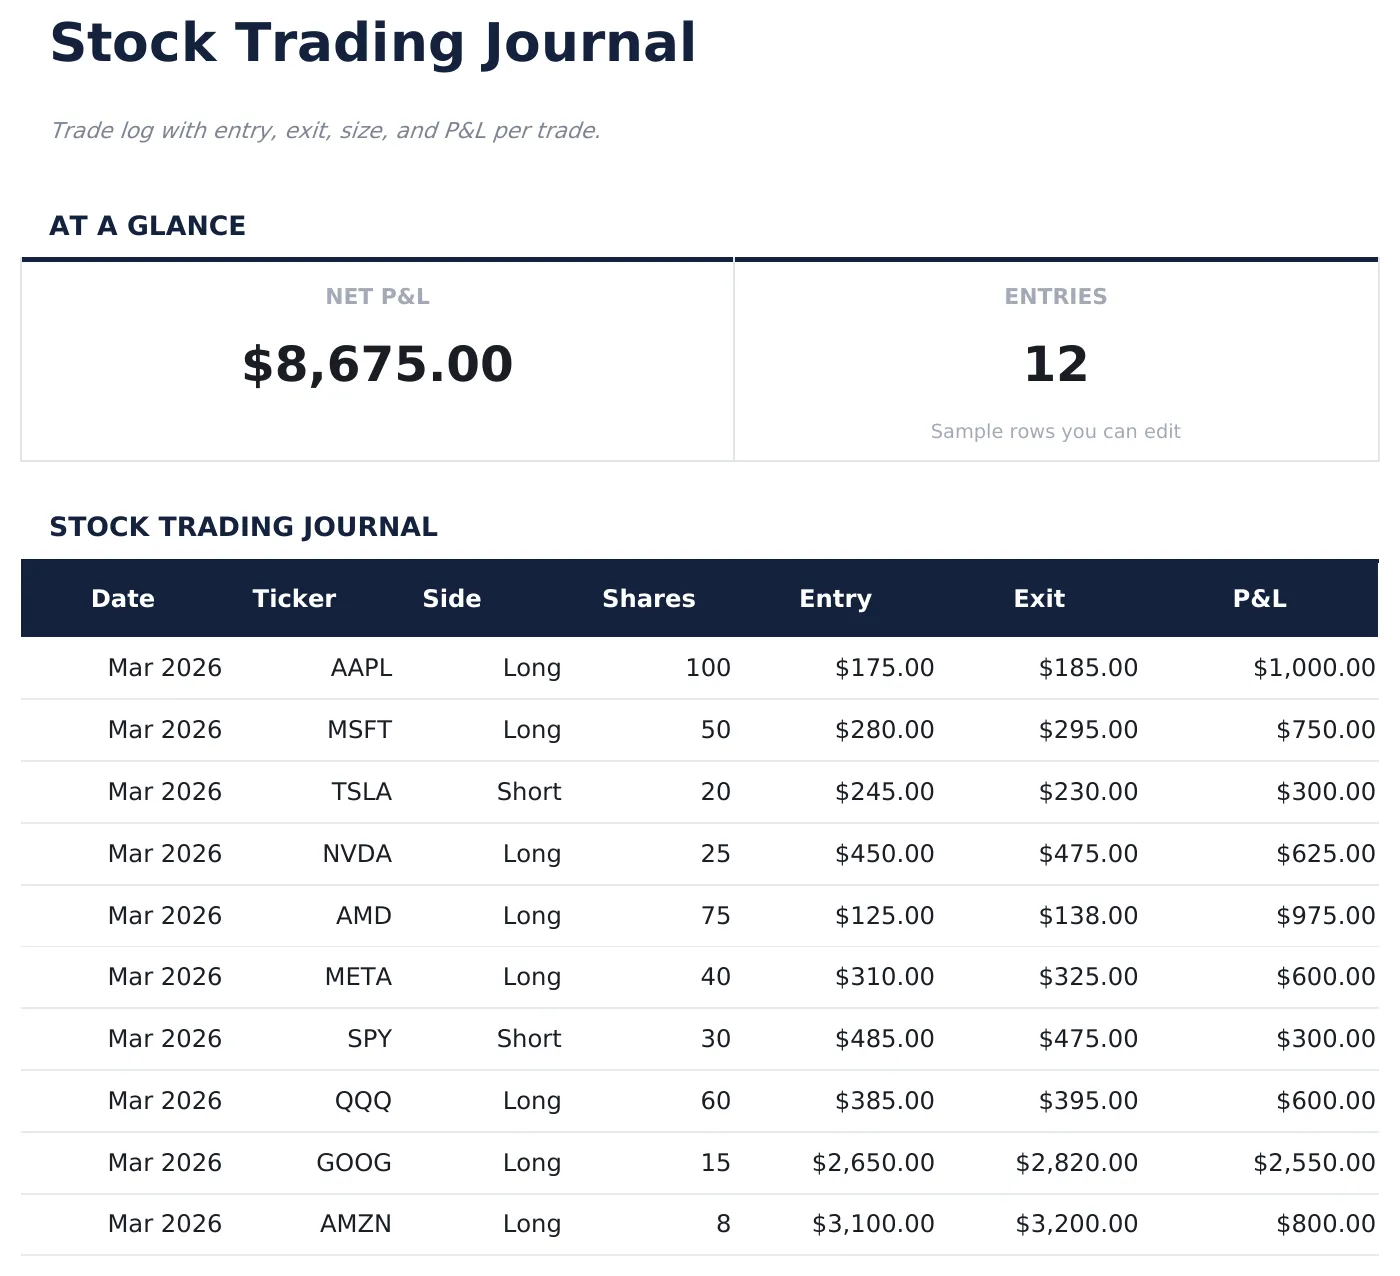
- 交易记录包含股票代码、买入日期、买入价、卖出日期、卖出价、股数和盈亏列
- 每笔交易的盈亏基于买入价、卖出价、股数和佣金成本自动计算
- 胜率和平均回报在每次交易录入后更新,并分别统计做多和做空数据
- 累计盈亏跟踪,配有彩色标记的输入单元格(黄色)和自动计算的表现指标(蓝色)
- 适用于 Microsoft Excel、Google Sheets 和 LibreOffice Calc,无需任何设置
Free、Essentials 与 Ultimate - 有什么区别?
- "Trade Log" sheet with labeled columns and pre-filled sample rows you can overwrite
- Column totals update automatically as you log new entries
- Consistent layout - no setup, no pivot tables, no macros
- Step-by-step "How to Use" guide included in a second sheet
- Works in Microsoft Excel, Google Sheets, and LibreOffice Calc - no setup or sign-up
- 包含 Free 的全部
- Full-featured Stock Trading Journal with dashboard and detailed analytics
- Pre-filled subcategories, sample scenarios, and helper calculations
- Larger data capacity for real-world usage
- $12 one-time purchase, lifetime access
- 包含 Essentials 的全部
- Log up to 200 trades with ticker, date, direction (Long/Short), shares, entry price, exit price, strategy, and notes
- Dashboard with 6 KPI cards: total P&L, win rate, best trade, average win, average loss, and total trades
- Performance Summary showing total trades, wins, losses, win rate, average gain, average loss, and largest win and loss by ticker
- Monthly P&L sheet aggregating trades by month: total trades, wins, losses, gross profit, gross loss, and net P&L per month
股票交易日志 模板的工作原理
Trade log with entry, exit, size, and P&L per trade. Open the spreadsheet, enter your own numbers, and let the formulas do the math.
此模板何时有用
- You want a simple log of trade log without connecting accounts or learning a new app.
- You need a record for taxes, reimbursement, or a quarterly review.
- You prefer one row per entry so you can sort, filter, and total later.
- You want something that opens in Excel, Google Sheets, or LibreOffice with no setup.
充分利用的小贴士
- Keep the column labels simple - the formulas work best when categories are consistent month to month.
- Log every trade regularly - once a week is a good rhythm for most people.
需要避免的常见错误
- Logging sporadically. A tracker only works if entries are consistent - weekly at minimum for most categories.
- Changing column labels after entering data. The formulas reference columns by position; renaming is fine, but moving columns breaks the totals.
- Letting the sheet balloon. When the row count gets unwieldy, archive older entries to a second file.
如何使用这个股票交易日志模板
记录每笔交易
为每笔完成的交易输入股票代码、买入日期、买入价、卖出日期、卖出价和股数。
记录交易理由
添加关于每次买入和卖出原因的备注。这有助于回顾交易决策模式。
查看交易结果
每笔交易的盈亏基于买入价、卖出价、股数和佣金自动计算。
检查表现指标
仪表板显示总交易次数、胜率、平均盈利、平均亏损和累计盈亏。
由 Claude AI 构建,经我们精心打磨。
我们使用 Claude AI 在深入研究后起草每个模板。然后由团队接手,优化布局、全面测试每个公式、修复边界情况,并打磨设计,直到达到我们自己愿意使用的标准。AI 完成了 80% 的工作,最后 20% 靠的是人工判断。
Upgrade your spreadsheet
Here is how you unlock a better version.
- Full-featured Stock Trading Journal with dashboard and detailed analytics
- Pre-filled subcategories, sample scenarios, and helper calculations
- Larger data capacity for real-world usage
- Log up to 200 trades with ticker, date, direction (Long/Short), shares, entry price, exit price, strategy, and notes
- Dashboard with 6 KPI cards: total P&L, win rate, best trade, average win, average loss, and total trades
- Performance Summary showing total trades, wins, losses, win rate, average gain, average loss, and largest win and loss by ticker
常见问题
能计算胜率吗?
可以。胜率为盈利交易次数除以总交易次数。仪表板在每次新交易录入后更新。
可以跟踪佣金吗?
可以。添加每笔交易的佣金成本。佣金会从盈利中扣除或计入亏损。
支持做空交易吗?
支持。对于做空交易,将卖空价作为买入价,回补价作为卖出价。盈亏计算对两个方向均正确。
能按股票代码查看表现吗?
按股票代码筛选或排序即可查看单只股票的所有交易。这有助于识别哪些股票盈利最多。
如何在 Google Sheets 中打开?
将 .xlsx 文件上传到 Google Drive,然后使用 Google Sheets 打开。所有公式和格式都会保留。
此模板使用什么许可证?
所有免费模板均采用 CC BY 4.0(知识共享署名)许可证发布。您可以自由使用、修改和分享,包括用于商业用途,只需注明来源为 FinancialAha.com。模板按原样提供,不构成财务建议。