企业预算 Essentials 模板
按月规划和跟踪企业收入与支出。涵盖运营成本、收入和部门预算。
包含内容
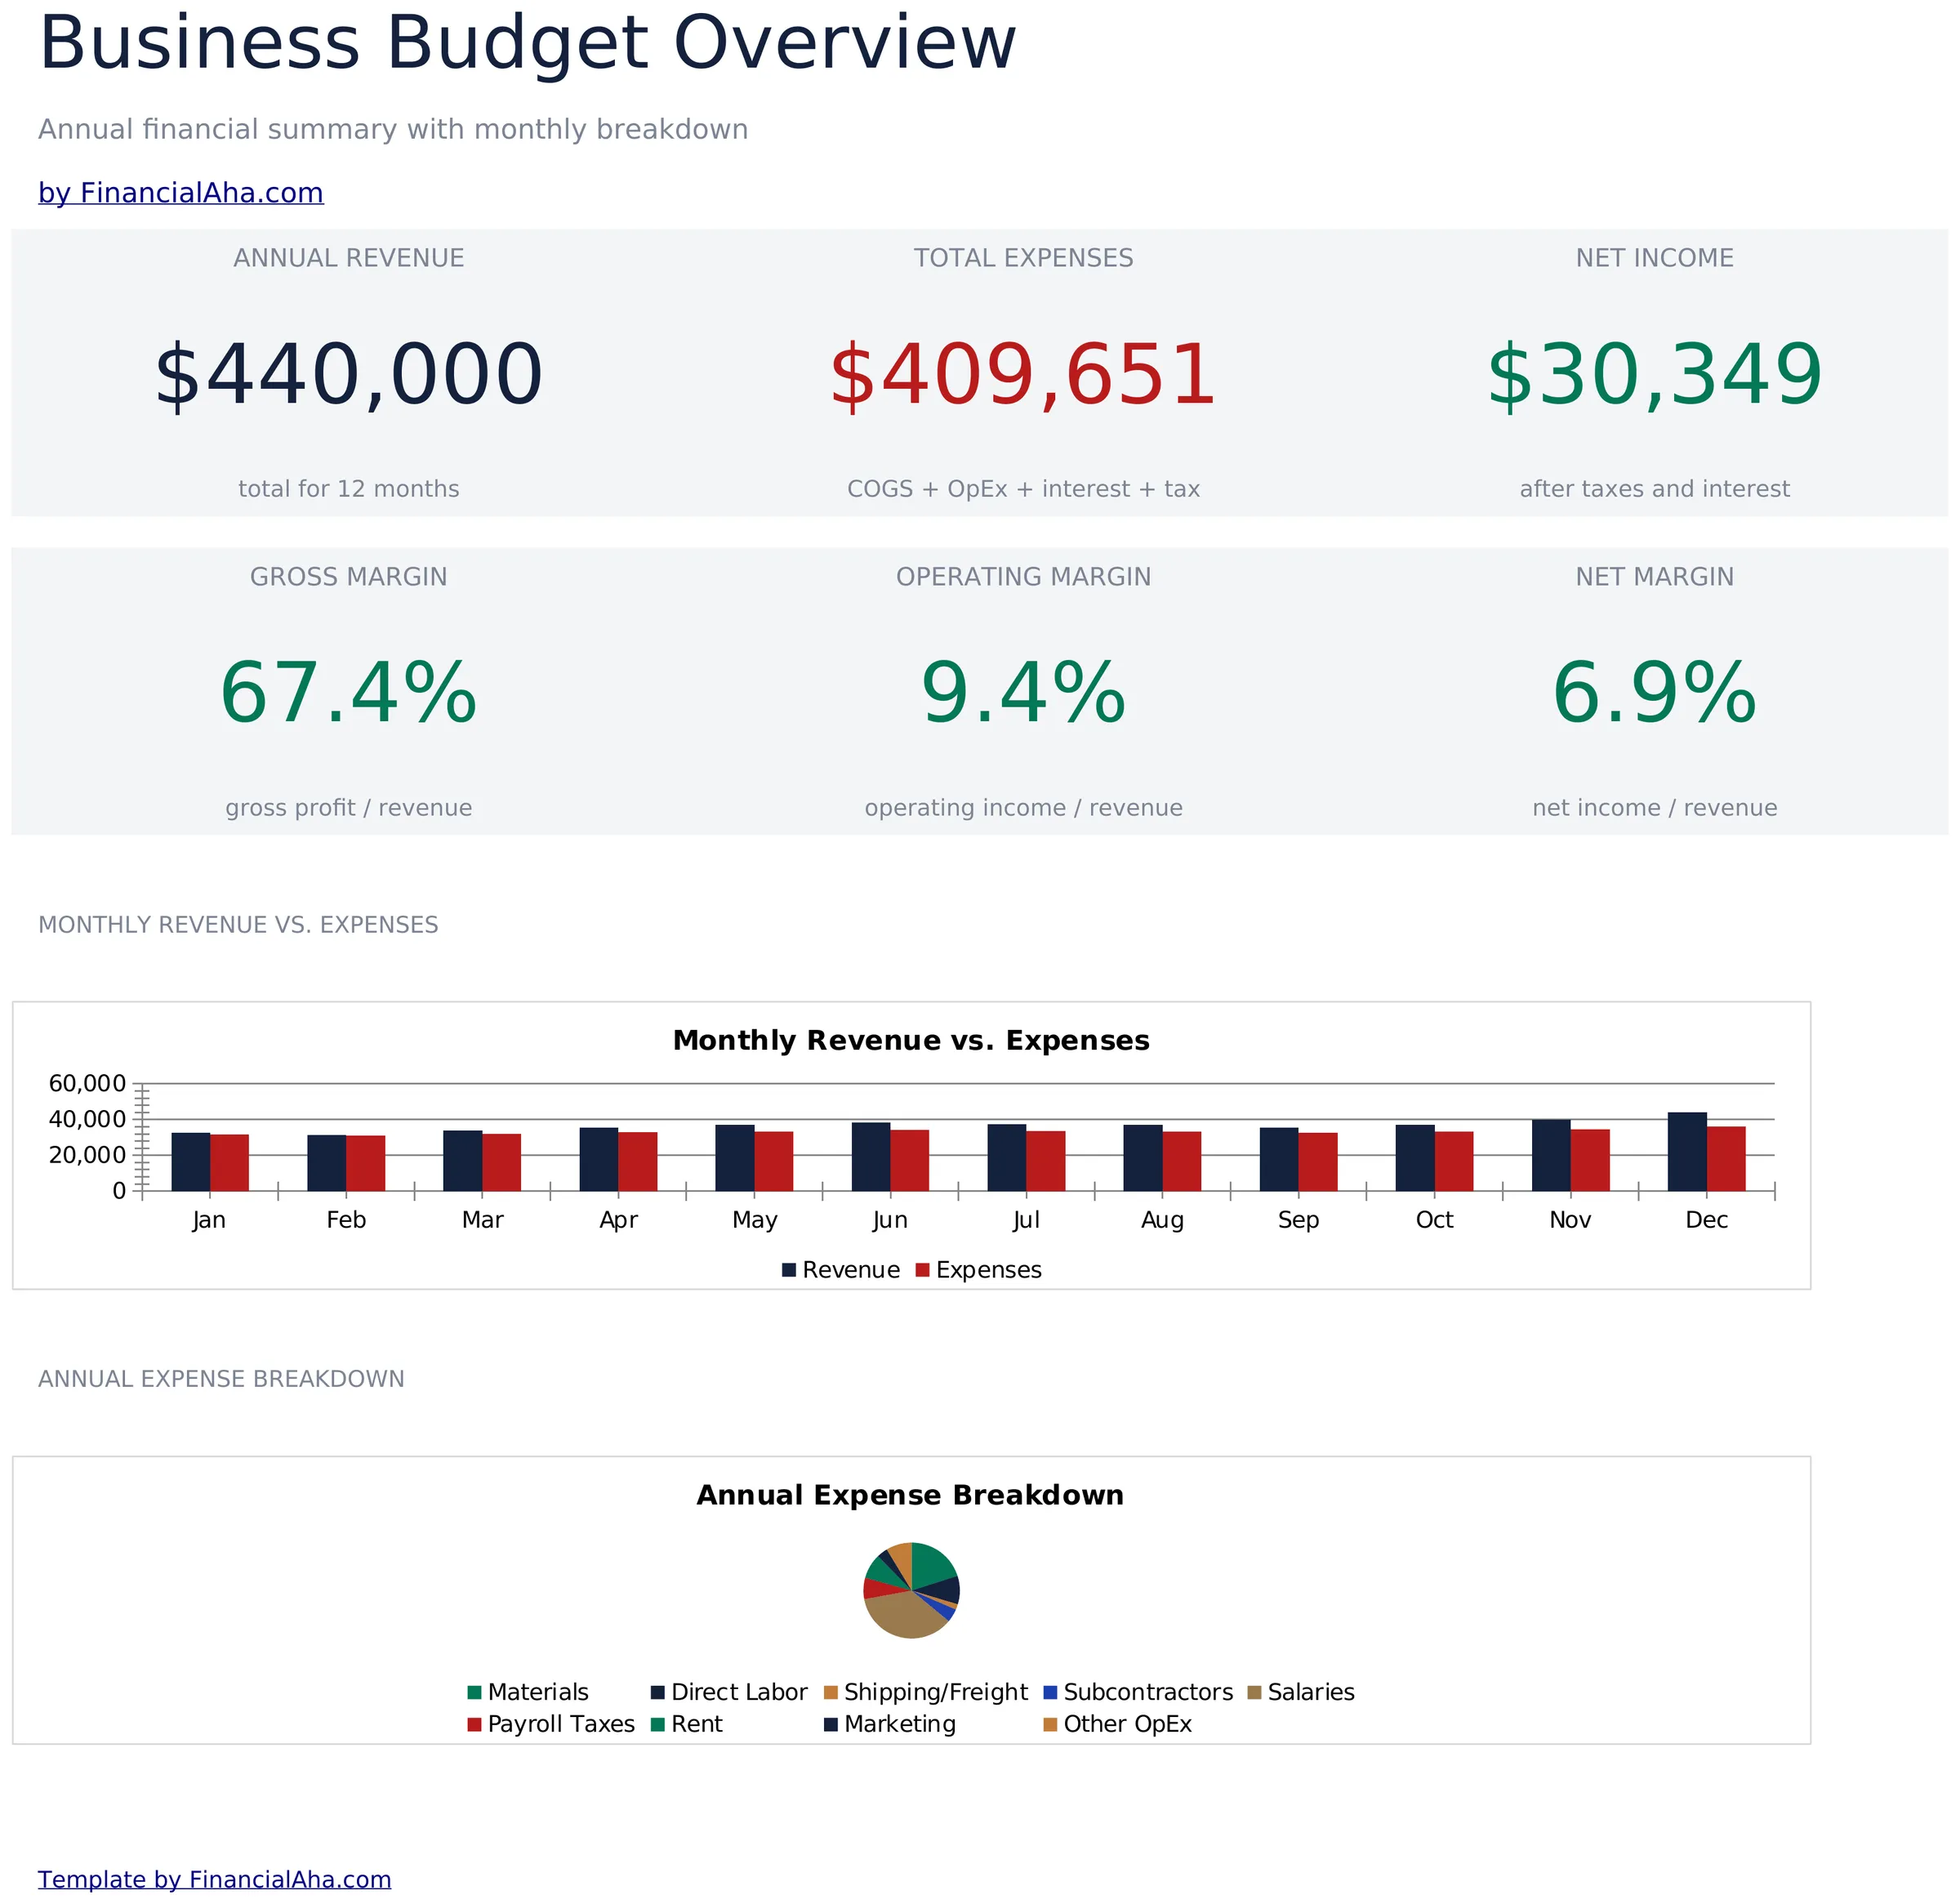
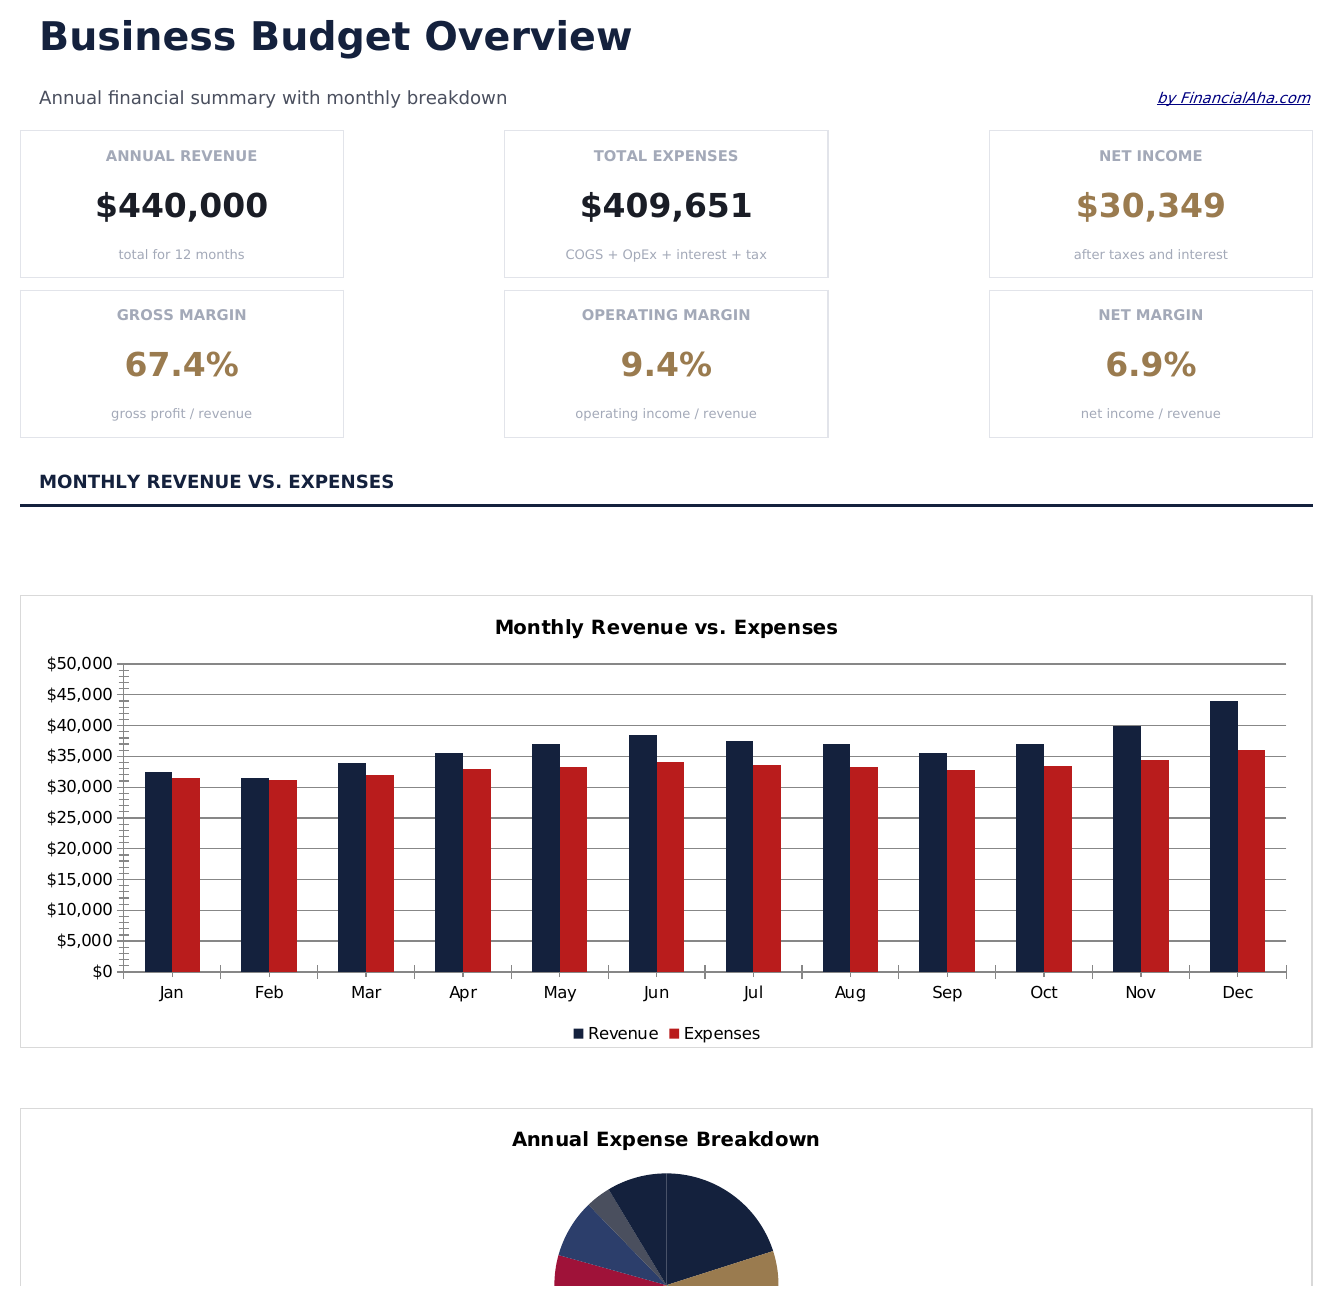
- 仪表板提供企业预算概览,显示总收入、总支出、净利润和预算使用率
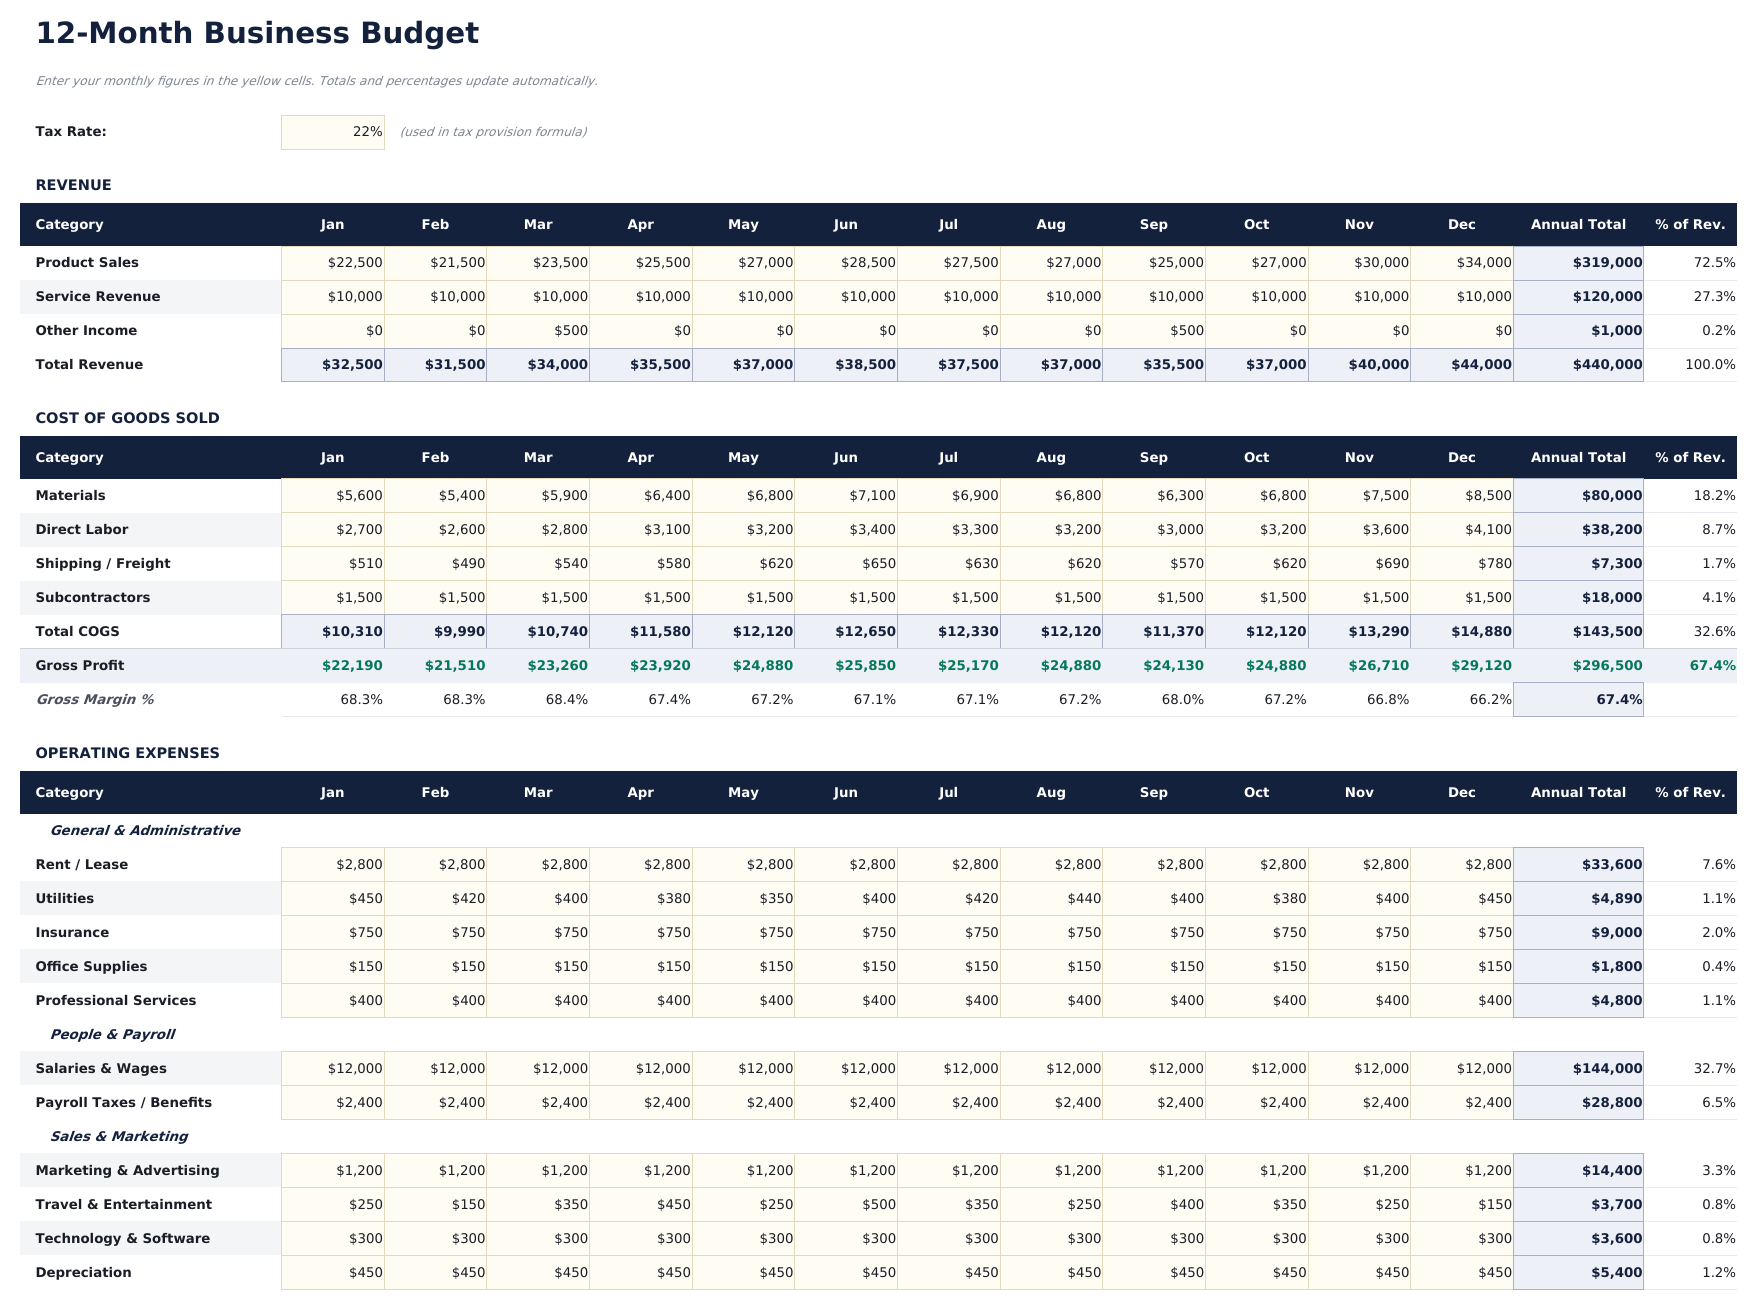
- 月度预算包含收入类别和支出明细项,涵盖工资、租金、营销、水电费和办公用品
- 部门或类别细分,支持对销售、运营、行政及其他团队进行单独预算跟踪
- 预算与实际对比列,自动计算每个收入和支出明细项的差异
- 彩色标记的差异指示器,突出显示有利和不利差异,并自动计算百分比
- 适用于 Microsoft Excel、Google Sheets 和 LibreOffice Calc,无需任何设置
Need more from this template?
The Essentials version covers everyday tracking. Ultimate goes further with multi-entity support, scenario analysis, and ultimate-grade reporting.
- 仪表板提供企业预算概览,显示总收入、总支出、净利润和预算使用率
- 月度预算包含收入类别和支出明细项,涵盖工资、租金、营销、水电费和办公用品
- 部门或类别细分,支持对销售、运营、行政及其他团队进行单独预算跟踪
- 预算与实际对比列,自动计算每个收入和支出明细项的差异
- 收入预算表,支持最多10个收入流、月度目标和年度总计,可编辑增长假设
- 费用预算表,涵盖最多15个费用类别,跨12个月,含月度和年度总计
- 部门预算表,将预算分配到最多6个部门,包含人员编制、薪资和运营费用明细
- 仪表板包含6个KPI卡片:预算收入、预算费用、净预算、最大费用类别、收入增长率和营业利润率
- 季度审查表比较Q1至Q4的预算与实际收入、费用和净收入,含偏差分析
预览
查看此模板的内容
如何使用这个企业预算模板
输入收入类别
列出每个收入来源及预算月度金额 - 产品销售、服务费、订阅收入或其他收入渠道。
添加支出明细项
按类别填写运营支出 - 工资、租金、营销、水电费、办公用品和保险的月度预算。
输入实际金额
随着月份推进,记录实际收入和支出。差异列会显示哪些项目超出或低于预算。
查看仪表板
仪表板汇总显示总收入、总支出、净利润和整体预算使用率及差异亮点。
Customer Reviews
What Our Customers Say
"If I get half as good at handling my finances as you are at customer service, this'll be the best $26 I've spent lately."
"Great tool! Simplifies financial planning without the hassle of complex spreadsheets."
"I recently purchased your super convenient spreadsheet, it really helps me!"
"They're great and super intuitive. Thank you!"
由 Claude AI 构建,经我们精心打磨。
我们使用 Claude AI 在深入研究后起草每个模板。然后由团队接手,优化布局、全面测试每个公式、修复边界情况,并打磨设计,直到达到我们自己愿意使用的标准。AI 完成了 80% 的工作,最后 20% 靠的是人工判断。
常见问题
可以按部门编制预算吗?
可以。按部门组织支出类别 - 销售、营销、运营、行政。添加部门小计即可实现部门预算跟踪。
差异跟踪如何运作?
模板会计算每个明细项的预算金额与实际金额之间的差异。有利差异(低于预算)和不利差异(超出预算)均以颜色标记。
可以扩展为全年预算吗?
可以。为每个月添加列,覆盖全部12个月。模板格式支持整个财政年度的月度跟踪。
适用于小型还是大型企业?
适用于任何规模的企业。小型企业使用较少的类别,大型企业可以添加更多明细项和部门细分。
如何在 Google Sheets 中打开?
将 .xlsx 文件上传到 Google Drive,然后使用 Google Sheets 打开。所有公式和格式都会保留。
更多 企业财务 Essentials 模板
亮点:
不如获取每一个 Ultimate 模板
全部 58 个 Ultimate 模板一次购买即可获得,仅需 $299 - 价值 $1,102,您可节省 $803。