Calculadora FIRE Modelo Essentials
Calcule metas de independência financeira com base nas despesas anuais e taxa de economia. Projete quando a renda de investimentos poderia cobrir os custos de vida.
O Que Está Incluído
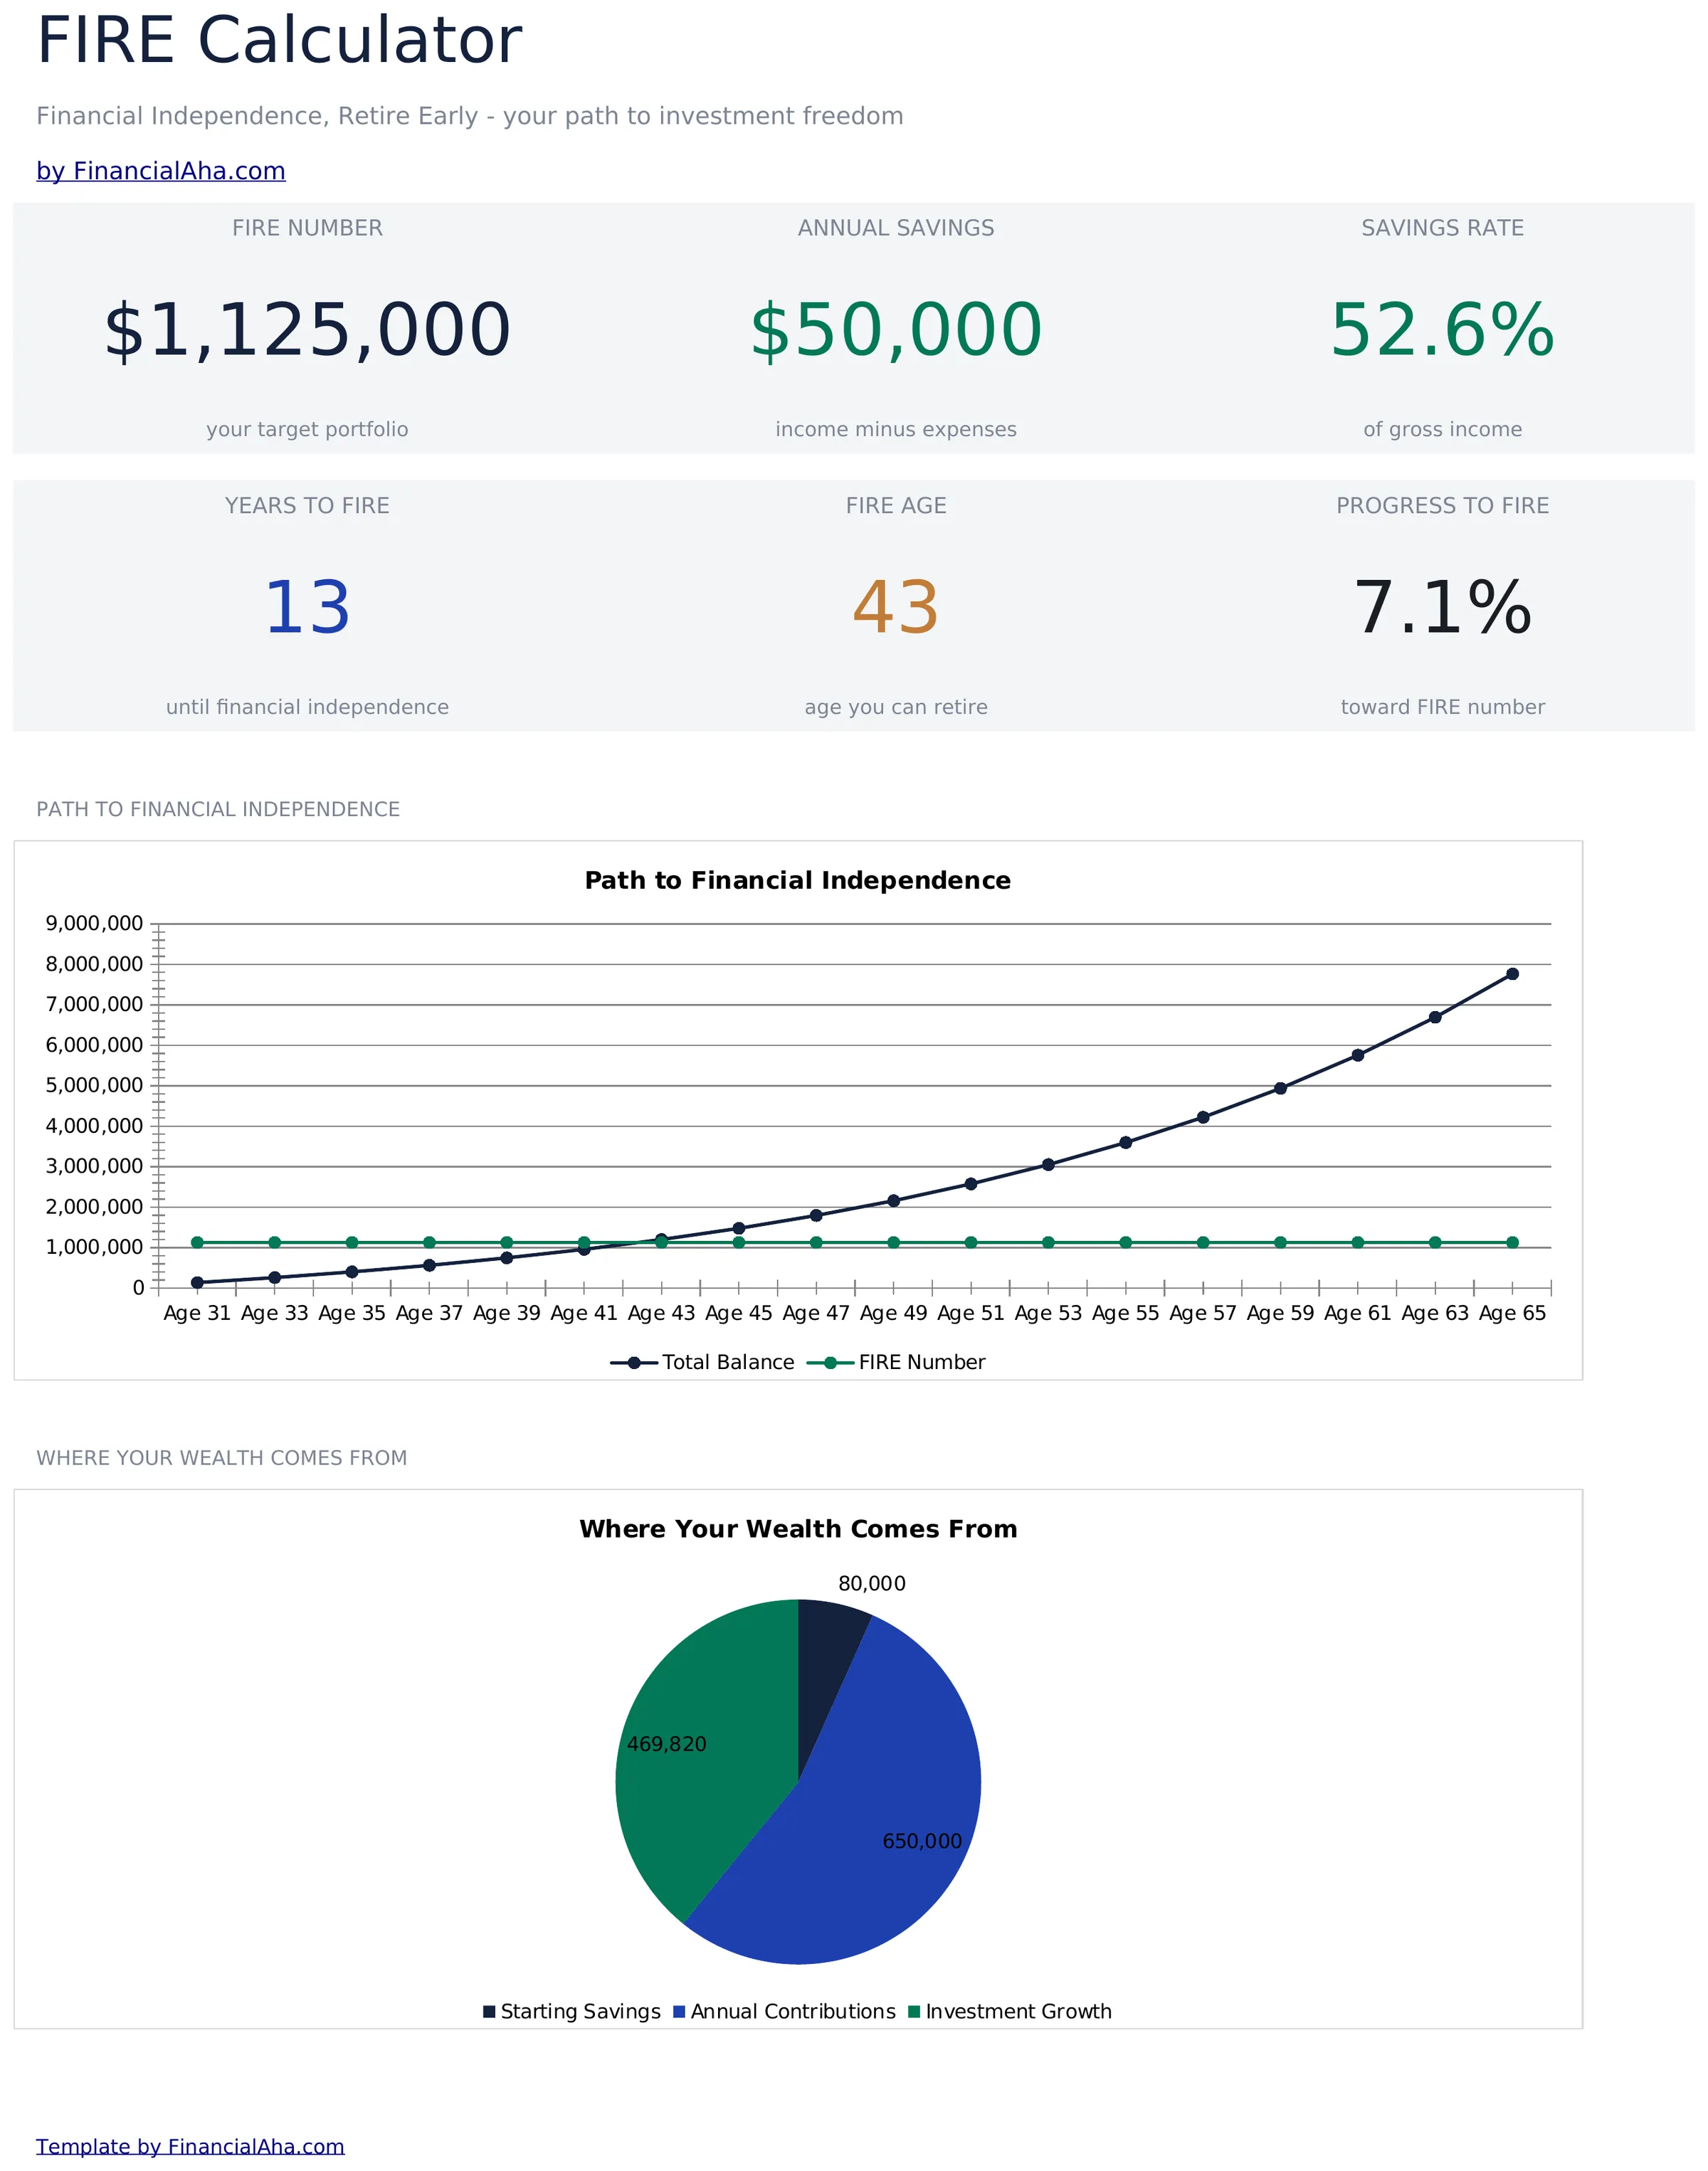
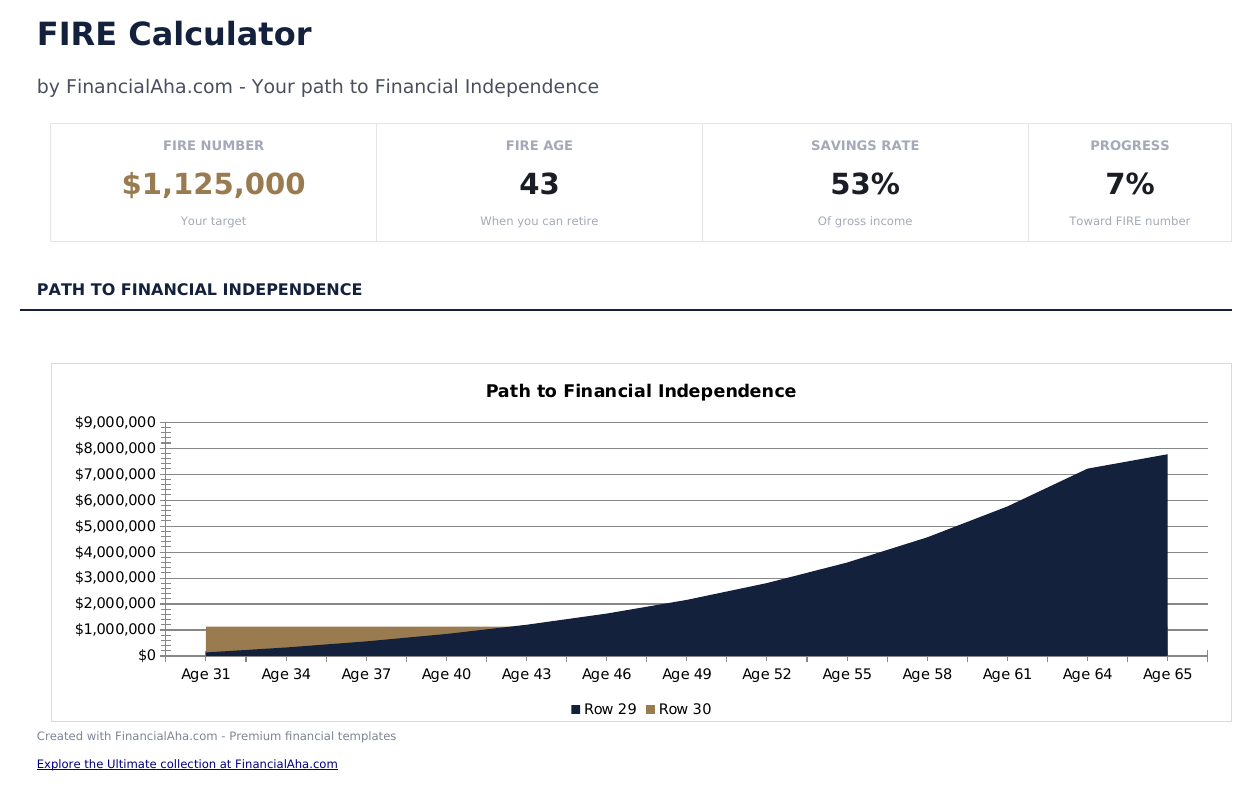
- Painel com número-alvo FIRE e linha do tempo projetada para independência financeira com base nas entradas atuais
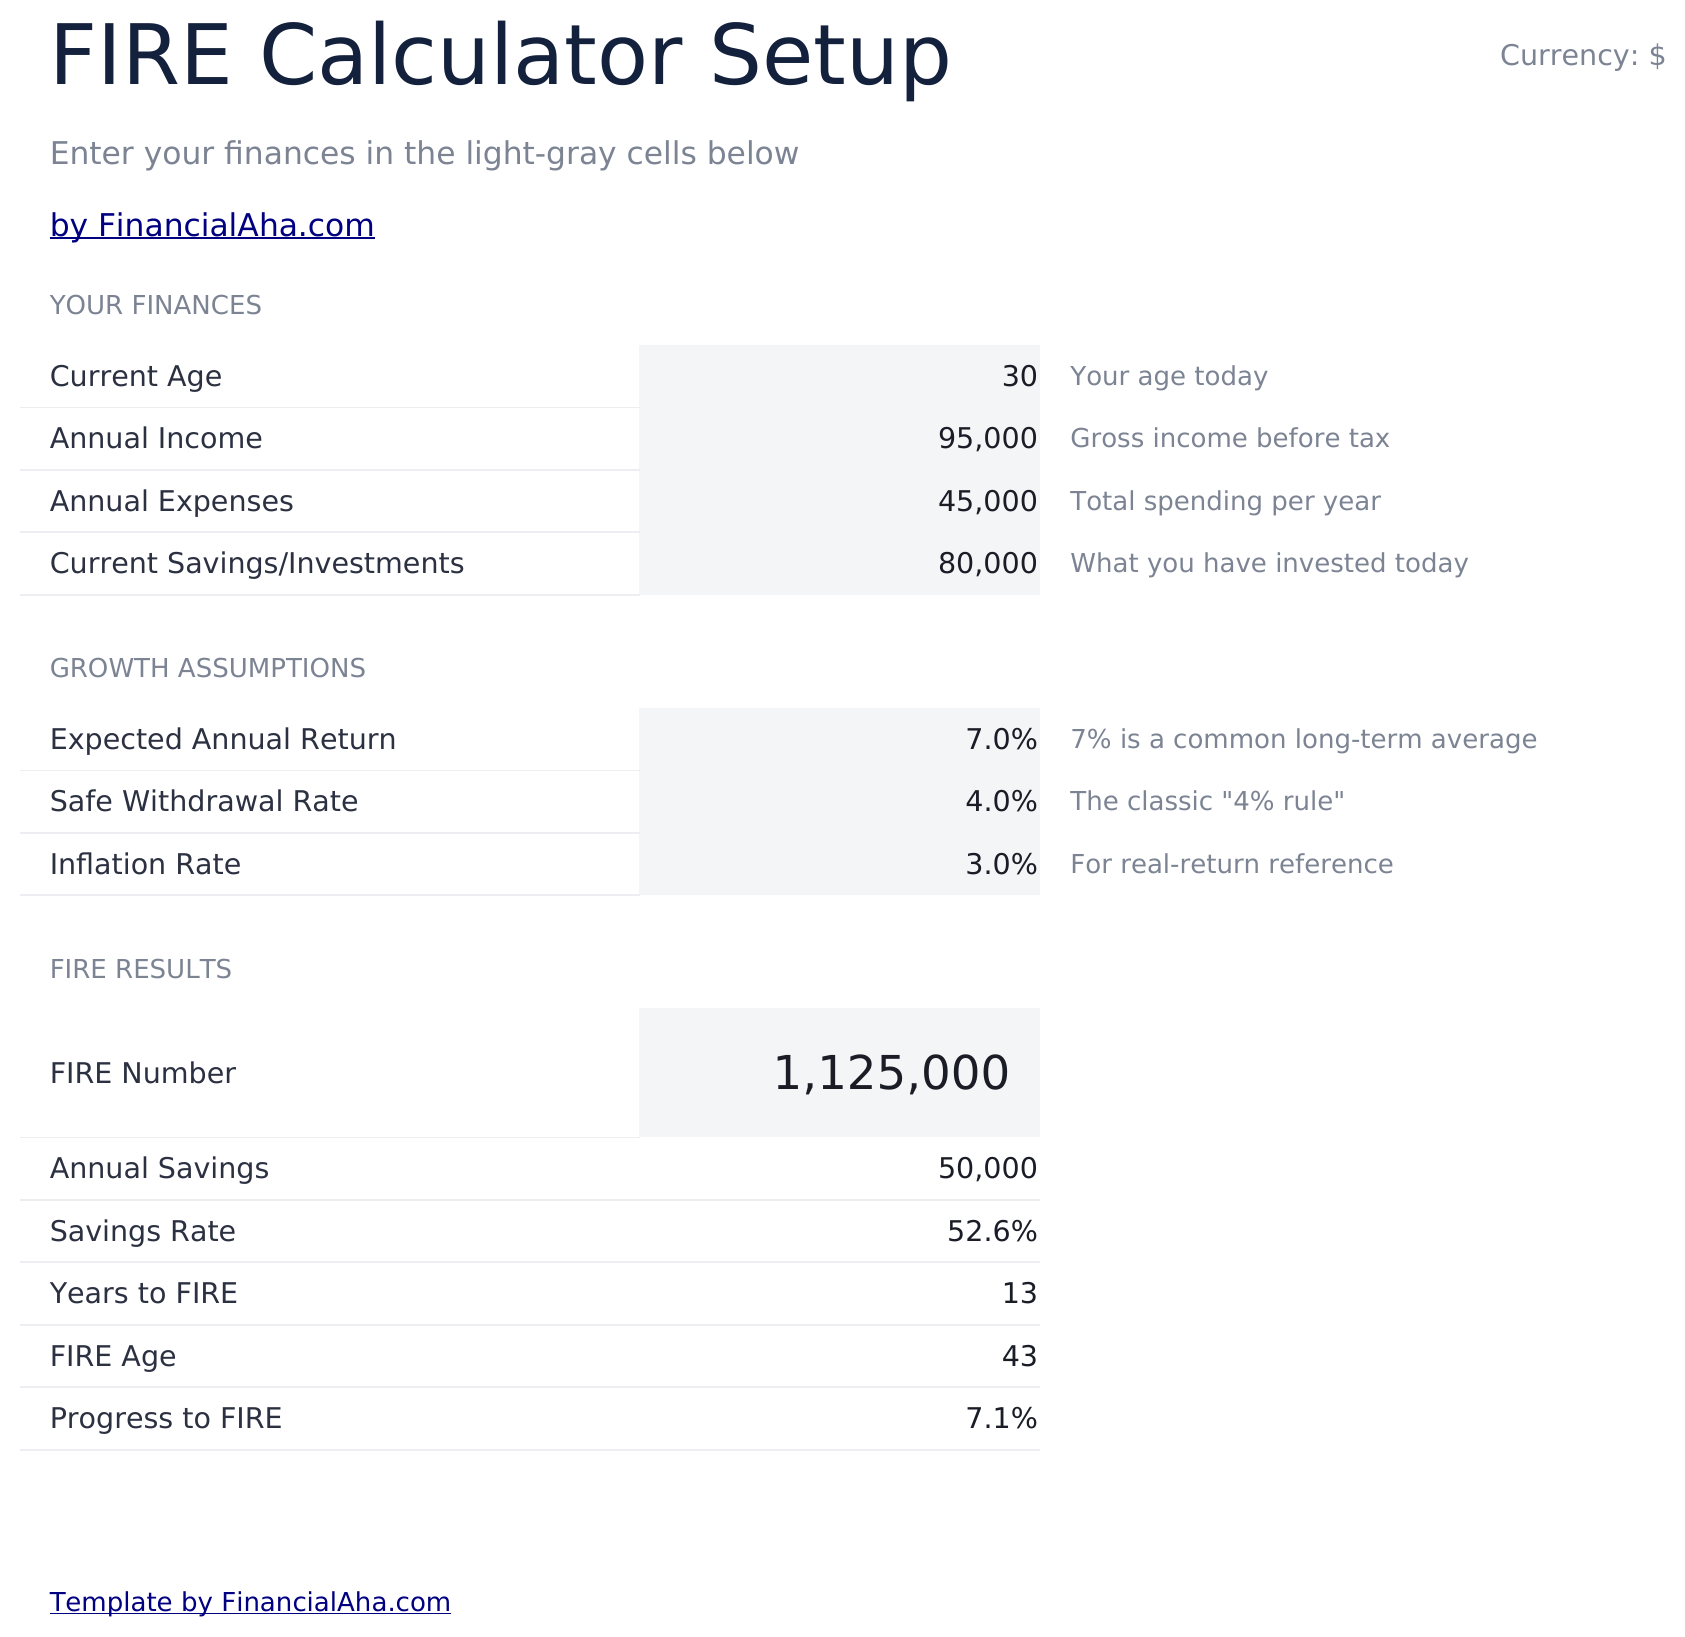
- Calculadora com campos de entrada para despesas anuais, economia atual, renda anual e taxa de economia
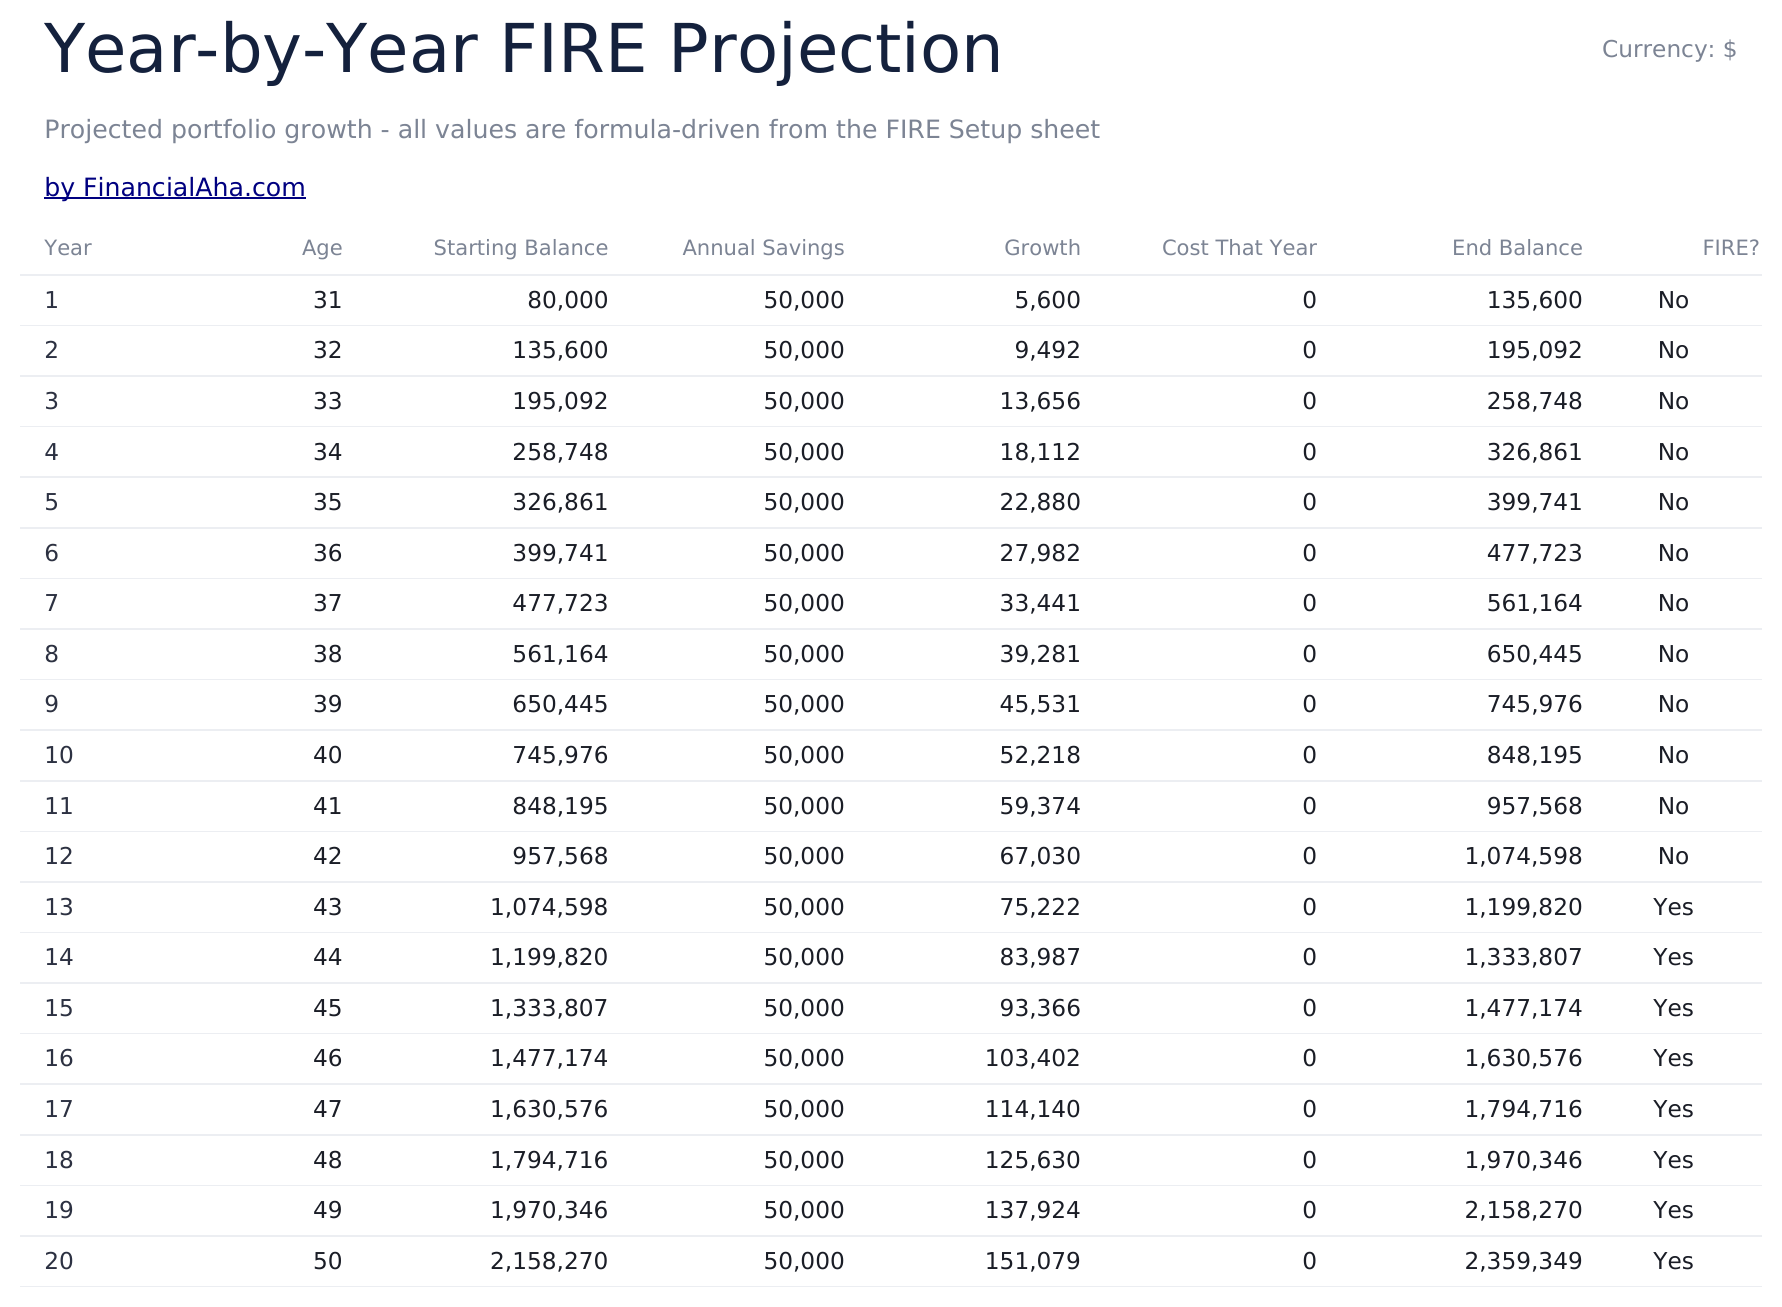
- Projeções de crescimento do investimento mostrando o saldo da carteira ano a ano no caminho para a independência financeira
- Modelagem da taxa de saque segura usando a regra dos 4% e percentuais de saque personalizáveis para planejamento
- Múltiplos cenários de números FIRE, incluindo metas magra, tradicional e gorda com entradas codificadas por cores
- Funciona em Microsoft Excel, Google Sheets e LibreOffice Calc sem necessidade de configuração
Need more from this template?
The Essentials version covers everyday tracking. Ultimate goes further with multi-entity support, scenario analysis, and ultimate-grade reporting.
- Painel com número-alvo FIRE e linha do tempo projetada para independência financeira com base nas entradas atuais
- Calculadora com campos de entrada para despesas anuais, economia atual, renda anual e taxa de economia
- Projeções de crescimento do investimento mostrando o saldo da carteira ano a ano no caminho para a independência financeira
- Modelagem da taxa de saque segura usando a regra dos 4% e percentuais de saque personalizáveis para planejamento
- Multi-cenário FIRE metas comparando lean, traditional, fat, e barista FIRE números lado a lado
- Painel com 6 KPIs: FIRE número, anos to FIRE, atual taxa de poupança, portfólio valor, anual despesas, e safe retirada valor
- Coast FIRE análise mostrando quando seu portfólio can grow para o FIRE número sem adicional contribuições
- Year-by-ano portfólio projeção mostrando poupança, investimento growth, e progresso toward the FIRE meta
- Retirada taxa modelando comparando 3%, 3.5%, 4%, e 4.5% taxas com portfólio longevity estimativas
Pré-visualização
Veja o que tem dentro desta planilha
Como Usar Esta Planilha de Calculadora FIRE
Digite as despesas anuais
Insira suas despesas anuais de vida atual. Este valor orienta o cálculo do número FIRE com base na taxa de saque.
Adicione economia e renda
Insira o saldo de economia atual, renda anual e sua taxa de economia atual. O modelo calcula o diferencial para a independência financeira.
Revise as metas FIRE
O painel mostra números FIRE magra, tradicional e gorda com base em suas despesas e na taxa de saque selecionada.
Verifique a linha do tempo
Projeções ano a ano estimam quando sua carteira pode atingir a meta FIRE com suas taxas de economia e crescimento de investimentos atuais.
Customer Reviews
What Our Customers Say
"If I get half as good at handling my finances as you are at customer service, this'll be the best $26 I've spent lately."
"Great tool! Simplifies financial planning without the hassle of complex spreadsheets."
"I recently purchased your super convenient spreadsheet, it really helps me!"
"They're great and super intuitive. Thank you!"
Criadas com Claude AI. Aperfeiçoadas por nós.
Usamos Claude AI para criar cada planilha, após uma pesquisa aprofundada. Depois, nossa equipe entra em ação. Refinamos o layout, testamos exaustivamente cada fórmula, corrigimos casos extremos e polimos o design até que pareça algo que nós mesmos usaríamos. A IA nos leva 80% do caminho. Os últimos 20% são puro julgamento humano.
Perguntas Frequentes
O que é o número FIRE?
O número FIRE é o tamanho da carteira necessário para que a renda de investimentos cubra as despesas de vida. Usando a regra dos 4%, é igual às despesas anuais multiplicadas por 25.
Qual é a diferença entre FIRE magra, tradicional e gorda?
FIRE magra visa um estilo de vida mínimo, FIRE tradicional corresponde aos gastos atuais e FIRE gorda visa um estilo de vida mais confortável ou com maior gasto.
Posso alterar a taxa de saque?
Sim. O campo de taxa de saque é editável. Taxas mais baixas (3%) exigem uma carteira maior, mas podem ser mais sustentáveis. Taxas mais altas (5%) precisam de menos, mas carregam mais risco.
Ele leva em consideração a Segurança Social?
Não diretamente. Se você espera renda da Segurança Social, reduza sua entrada de despesa anual por esse valor para ver a carteira necessária para cobrir a diferença restante.
Como abrir no Google Sheets?
Envie o arquivo .xlsx para o Google Drive e abra com o Google Sheets. Todas as fórmulas e formatações serão preservadas.
Mais modelos Essentials de Savings & Aposentadoria
Destaques:
Procurando planilhas premium?
Nossas planilhas pagas incluem painéis avançados com várias abas, gráficos nativos do Excel e atualizações contínuas.
Leve todos os modelos Ultimate
Todos os 58 modelos Ultimate em uma única compra por $299 - valor de $1,102, você fica com $803.