FIRE-Rechner Essentials-Vorlage
Berechnen Sie Ziele fuer finanzielle Unabhaengigkeit basierend auf Jahresausgaben und Sparrate. Projizieren Sie, wann Anlageertraege die Lebenshaltungskosten decken koennten.
Was enthalten ist
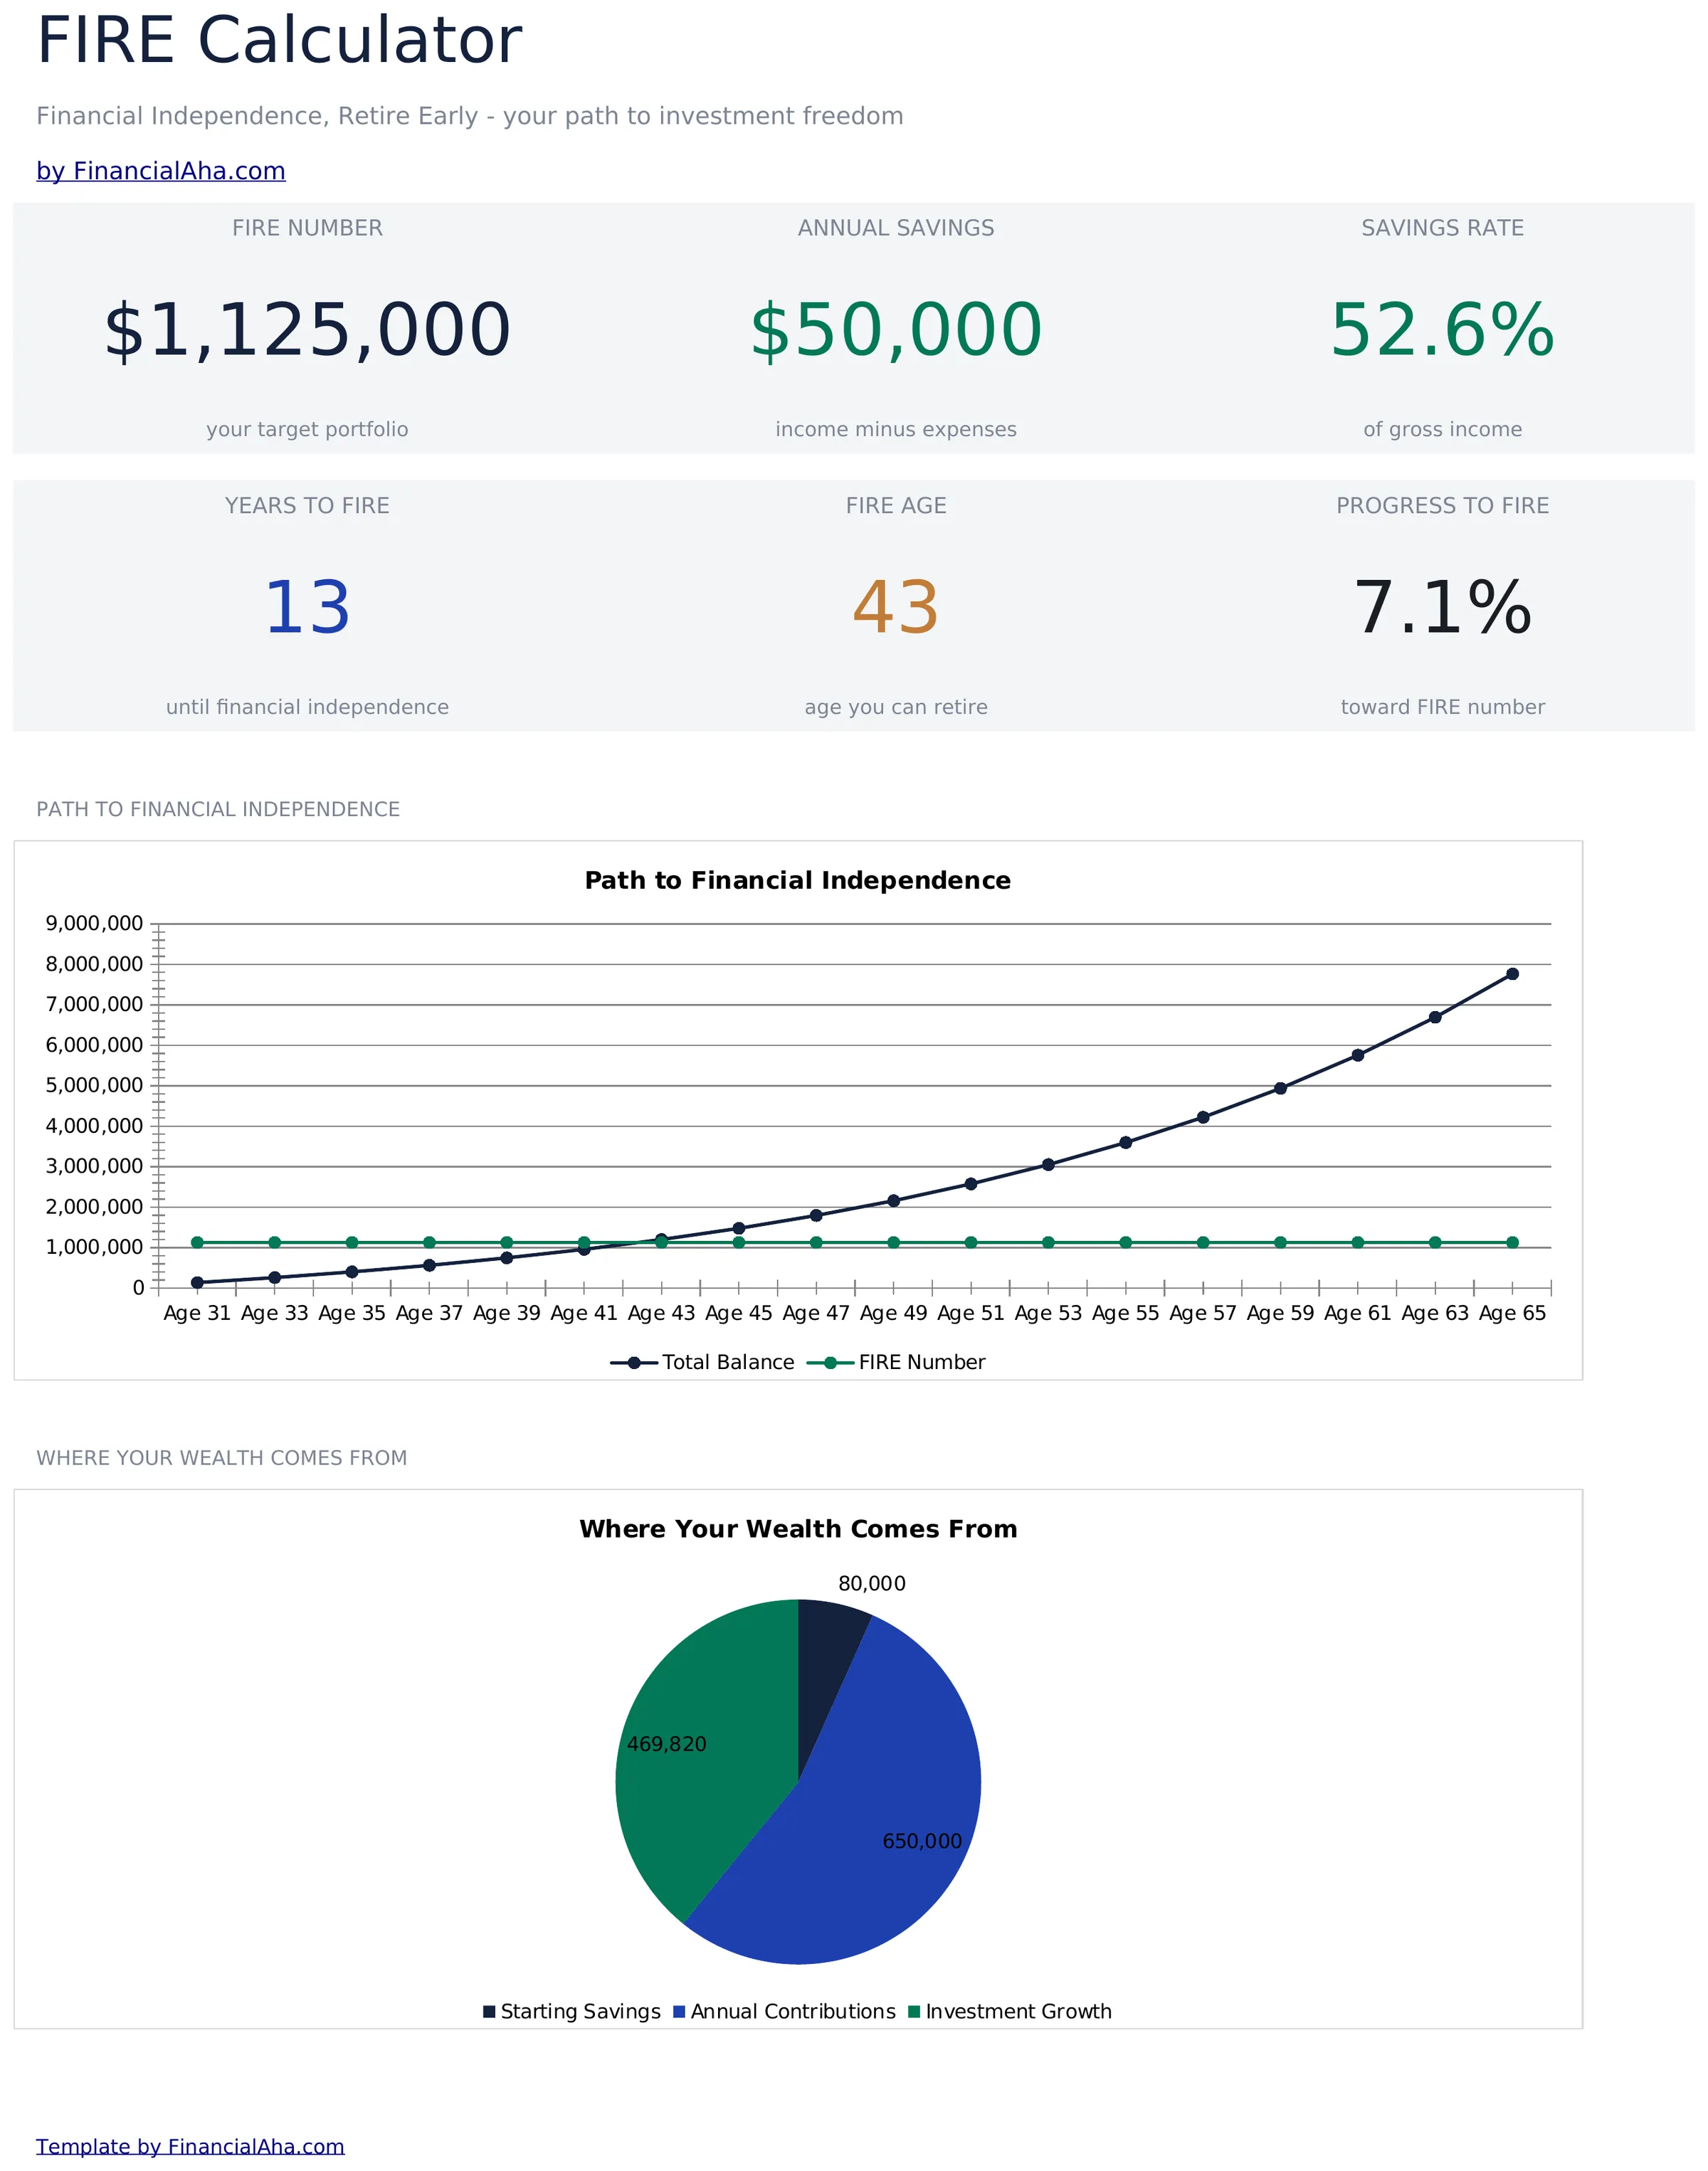
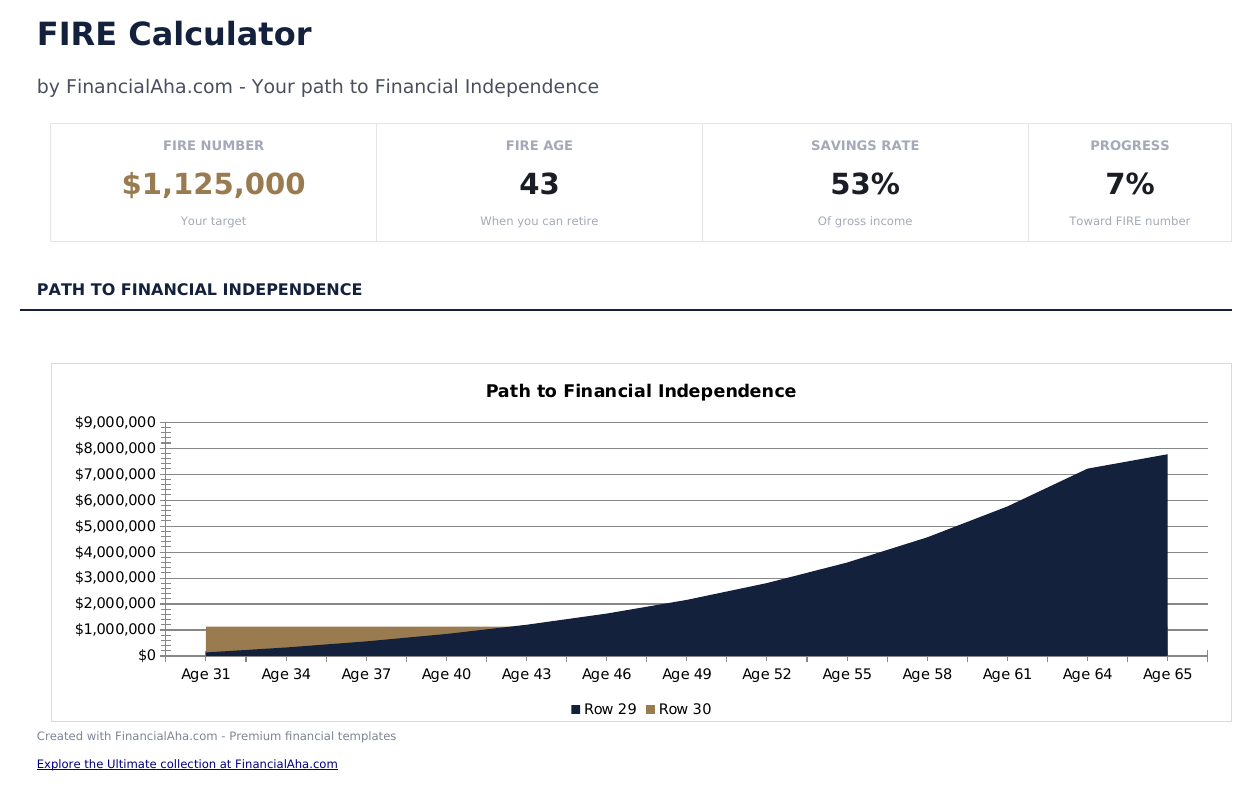
- Dashboard mit FIRE-Zielbetrag und projiziertem Zeitplan zur finanziellen Unabhaengigkeit basierend auf aktuellen Eingaben
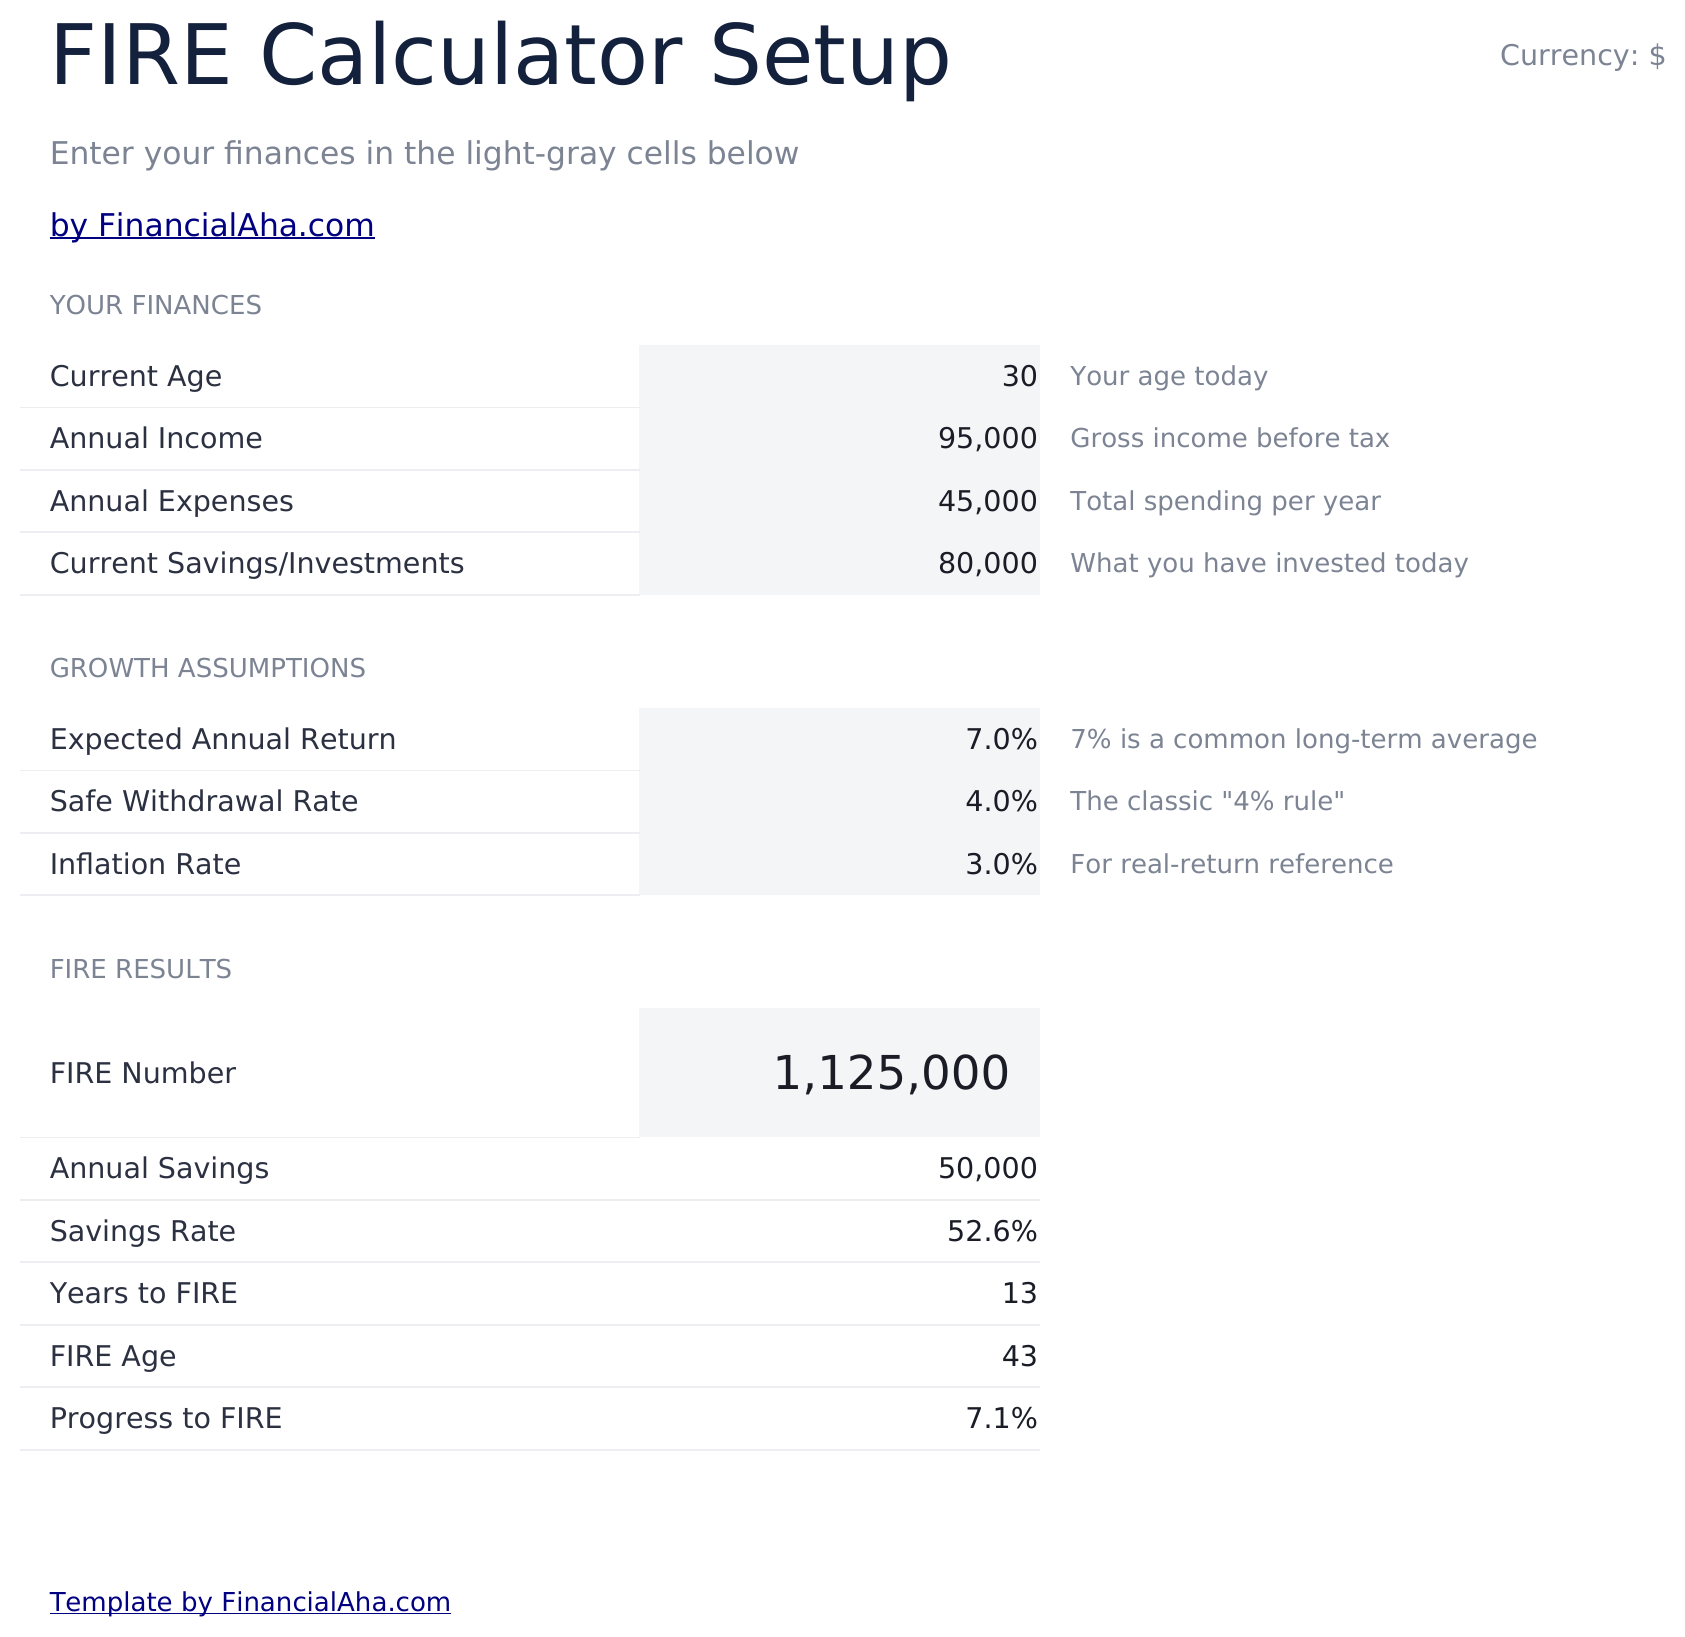
- Rechner mit Eingabefeldern fuer Jahresausgaben, aktuelles Erspartes, Jahreseinkommen und Sparrate
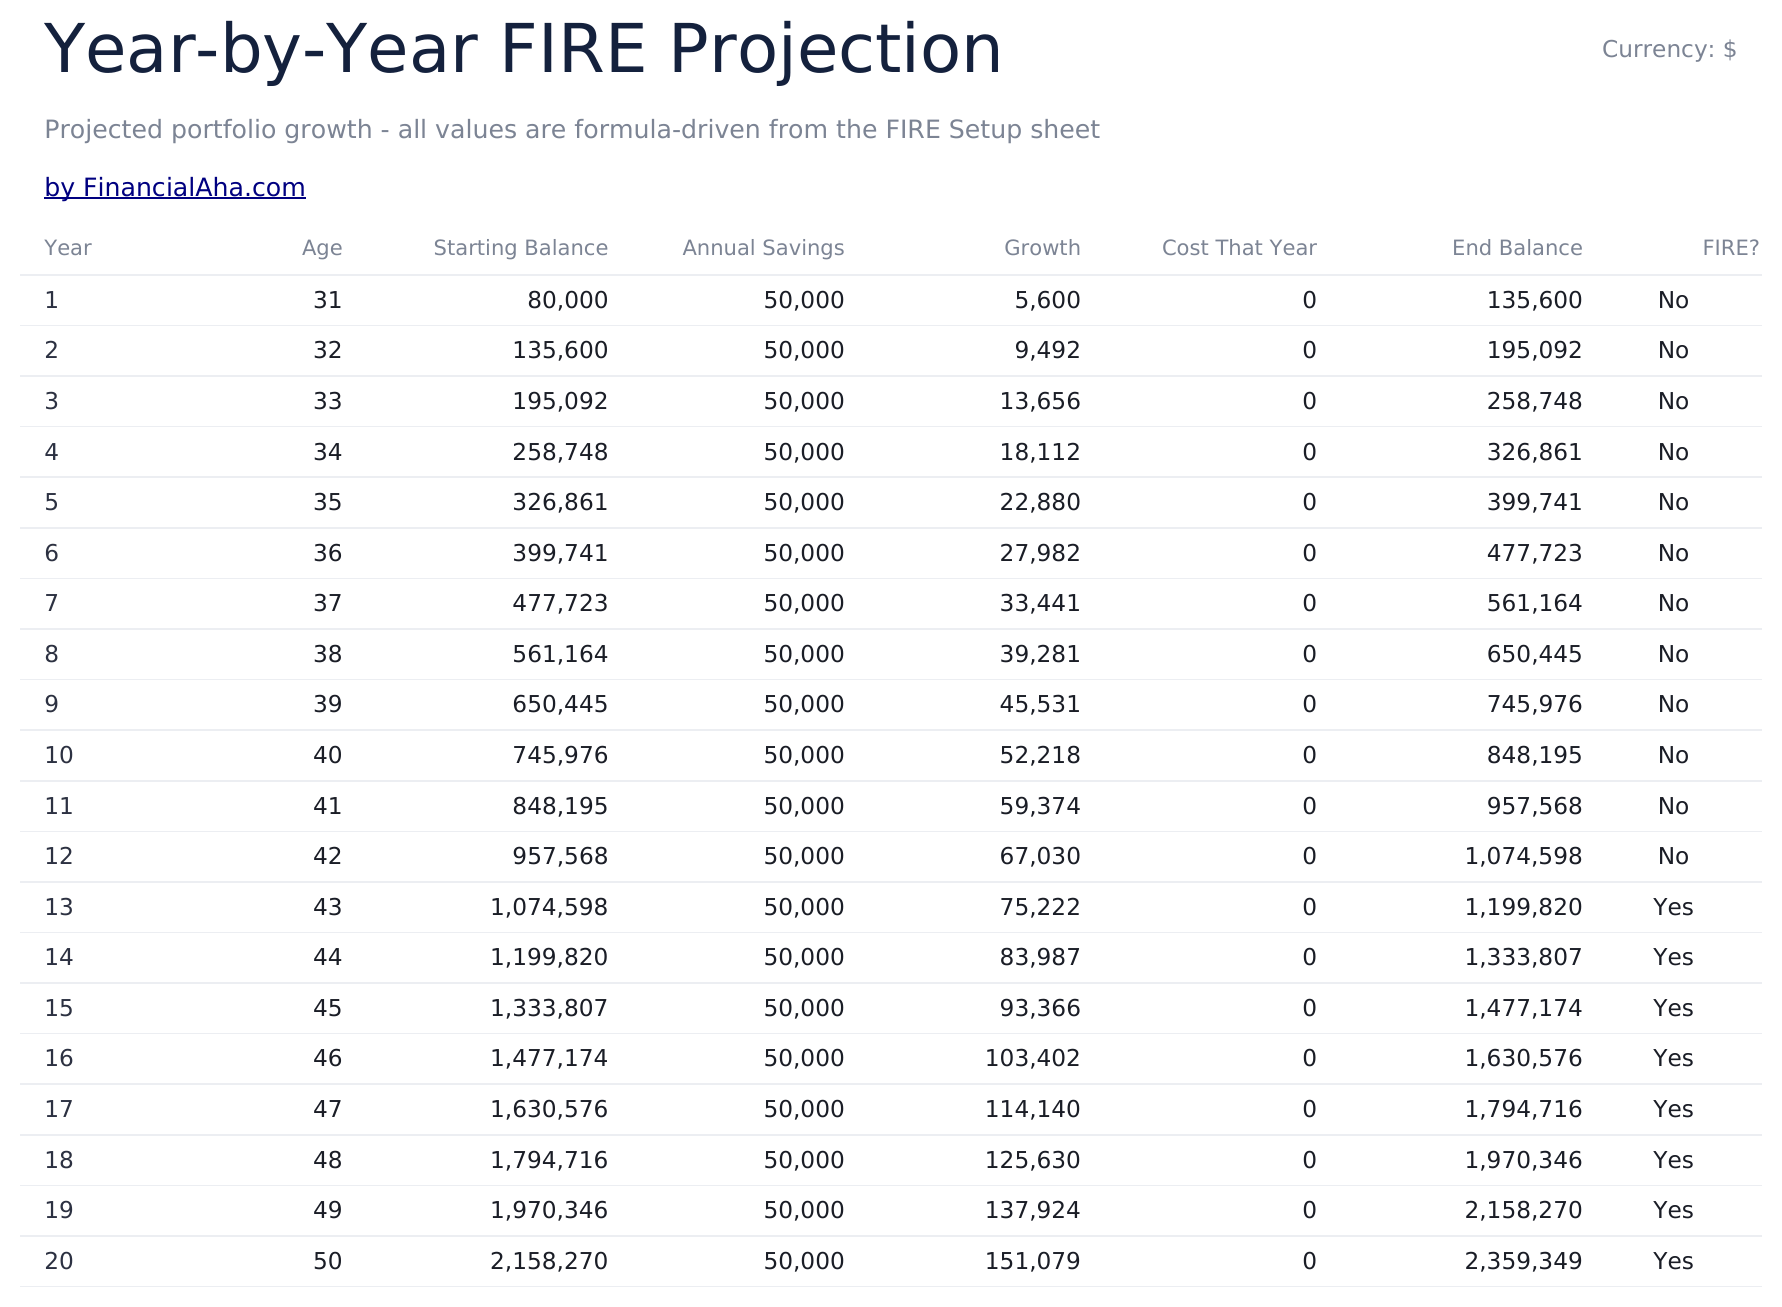
- Anlagenwachstumsprognosen mit jahresweiser Portfolioentwicklung auf dem Weg zur finanziellen Unabhaengigkeit
- Modellierung der sicheren Entnahmerate mit der 4%-Regel und anpassbaren Entnahmeprozentsaetzen fuer die Planung
- Mehrere FIRE-Szenarien einschliesslich Lean-, Traditional- und Fat-FIRE-Ziele mit farbcodierten Eingaben
- Funktioniert in Microsoft Excel, Google Sheets und LibreOffice Calc ohne Einrichtung
Need more from this template?
The Essentials version covers everyday tracking. Ultimate goes further with multi-entity support, scenario analysis, and ultimate-grade reporting.
- Dashboard mit FIRE-Zielbetrag und projiziertem Zeitplan zur finanziellen Unabhaengigkeit basierend auf aktuellen Eingaben
- Rechner mit Eingabefeldern fuer Jahresausgaben, aktuelles Erspartes, Jahreseinkommen und Sparrate
- Anlagenwachstumsprognosen mit jahresweiser Portfolioentwicklung auf dem Weg zur finanziellen Unabhaengigkeit
- Modellierung der sicheren Entnahmerate mit der 4%-Regel und anpassbaren Entnahmeprozentsaetzen fuer die Planung
- Multi-Szenario-FIRE-Ziele mit Vergleich von Lean-, traditionellem, Fat- und Barista-FIRE nebeneinander
- Dashboard mit 6 KPIs: FIRE-Zahl, Jahre bis FIRE, aktuelle Sparquote, Portfoliowert, Jahresausgaben und sicherer Entnahmebetrag
- Coast-FIRE-Analyse, die zeigt, wann Ihr Portfolio ohne weitere Beiträge zur FIRE-Zahl wachsen kann
- Jahresweise Portfolio-Prognose mit Ersparnissen, Investitionswachstum und Fortschritt zum FIRE-Ziel
- Entnahmeraten-Modellierung mit Vergleich von 3%, 3,5%, 4% und 4,5% Raten mit Schätzungen zur Portfolio-Lebensdauer
Vorschau
Sehen Sie, was in dieser Vorlage enthalten ist
So verwenden Sie diese FIRE-Rechner-Vorlage
Jahresausgaben eingeben
Geben Sie Ihre aktuellen jaehrlichen Lebenshaltungskosten ein. Dieser Wert bestimmt die FIRE-Zahl-Berechnung basierend auf der Entnahmerate.
Erspartes und Einkommen hinzufuegen
Geben Sie aktuelles Sparguthaben, Jahreseinkommen und Ihre aktuelle Sparrate ein. Die Vorlage berechnet die Luecke zur finanziellen Unabhaengigkeit.
FIRE-Ziele ueberpruefen
Das Dashboard zeigt Lean-, Traditional- und Fat-FIRE-Zahlen basierend auf Ihren Ausgaben und der gewaehlten Entnahmerate.
Zeitplan pruefen
Jahresweise Prognosen schaetzen, wann Ihr Portfolio bei Ihrer aktuellen Spar- und Anlagenwachstumsrate das FIRE-Ziel erreichen koennte.
Customer Reviews
What Our Customers Say
"If I get half as good at handling my finances as you are at customer service, this'll be the best $26 I've spent lately."
"Great tool! Simplifies financial planning without the hassle of complex spreadsheets."
"I recently purchased your super convenient spreadsheet, it really helps me!"
"They're great and super intuitive. Thank you!"
Erstellt von Claude AI. Verfeinert von uns.
Wir verwenden Claude AI, um jede Vorlage nach gründlicher Recherche zu entwerfen. Dann greift unser Team ein. Wir verfeinern das Layout, testen jede Formel auf Herz und Nieren, beheben Grenzfälle und polieren das Design, bis es sich anfühlt wie etwas, das wir selbst verwenden würden. Die KI bringt uns 80 % ans Ziel. Die letzten 20 % sind rein menschliches Urteilsvermögen.
Häufig gestellte Fragen
Was ist die FIRE-Zahl?
Die FIRE-Zahl ist die Portfoliogroesse, die noetig ist, damit Anlageertraege die Lebenshaltungskosten decken. Nach der 4%-Regel entspricht sie den Jahresausgaben multipliziert mit 25.
Was ist der Unterschied zwischen Lean-, Traditional- und Fat-FIRE?
Lean-FIRE zielt auf einen minimalen Lebensstil, Traditional-FIRE entspricht den aktuellen Ausgaben und Fat-FIRE zielt auf einen komfortableren oder ausgabenreicheren Lebensstil.
Kann ich die Entnahmerate aendern?
Ja. Das Entnahmeratenfeld ist bearbeitbar. Niedrigere Raten (3 %) erfordern ein groesseres Portfolio, sind aber moeglicherweise nachhaltiger. Hoehere Raten (5 %) benoetigen weniger, bergen aber mehr Risiko.
Wird die gesetzliche Rente beruecksichtigt?
Nicht direkt. Wenn Sie gesetzliche Renteneinnahmen erwarten, reduzieren Sie Ihre Jahresausgaben-Eingabe um diesen Betrag, um das Portfolio zu sehen, das zur Deckung der verbleibenden Luecke noetig ist.
Wie öffne ich diese Vorlage in Google Sheets?
Laden Sie die .xlsx-Datei auf Google Drive hoch und öffnen Sie sie mit Google Sheets. Alle Formeln und Formatierungen bleiben erhalten.
Weitere Essentials-Vorlagen: Sparen & Altersvorsorge
Highlights:
Auf der Suche nach Premium-Tabellenvorlagen?
Unsere kostenpflichtigen Vorlagen umfassen erweiterte mehrseitige Dashboards, native Excel-Diagramme und laufende Aktualisierungen.
Holen Sie sich stattdessen jede Ultimate-Vorlage
Alle 58 Ultimate-Vorlagen in einem Kauf für $299 - $1,102 Wert, Sie behalten $803.