70/20/10-budget Essentials-sjabloon
Verdeel inkomen in 70% levensonderhoud, 20% besparingen en 10% donaties of schuld. Een minimalistisch percentage-gebaseerd budgetraamwerk.
Wat zit erin
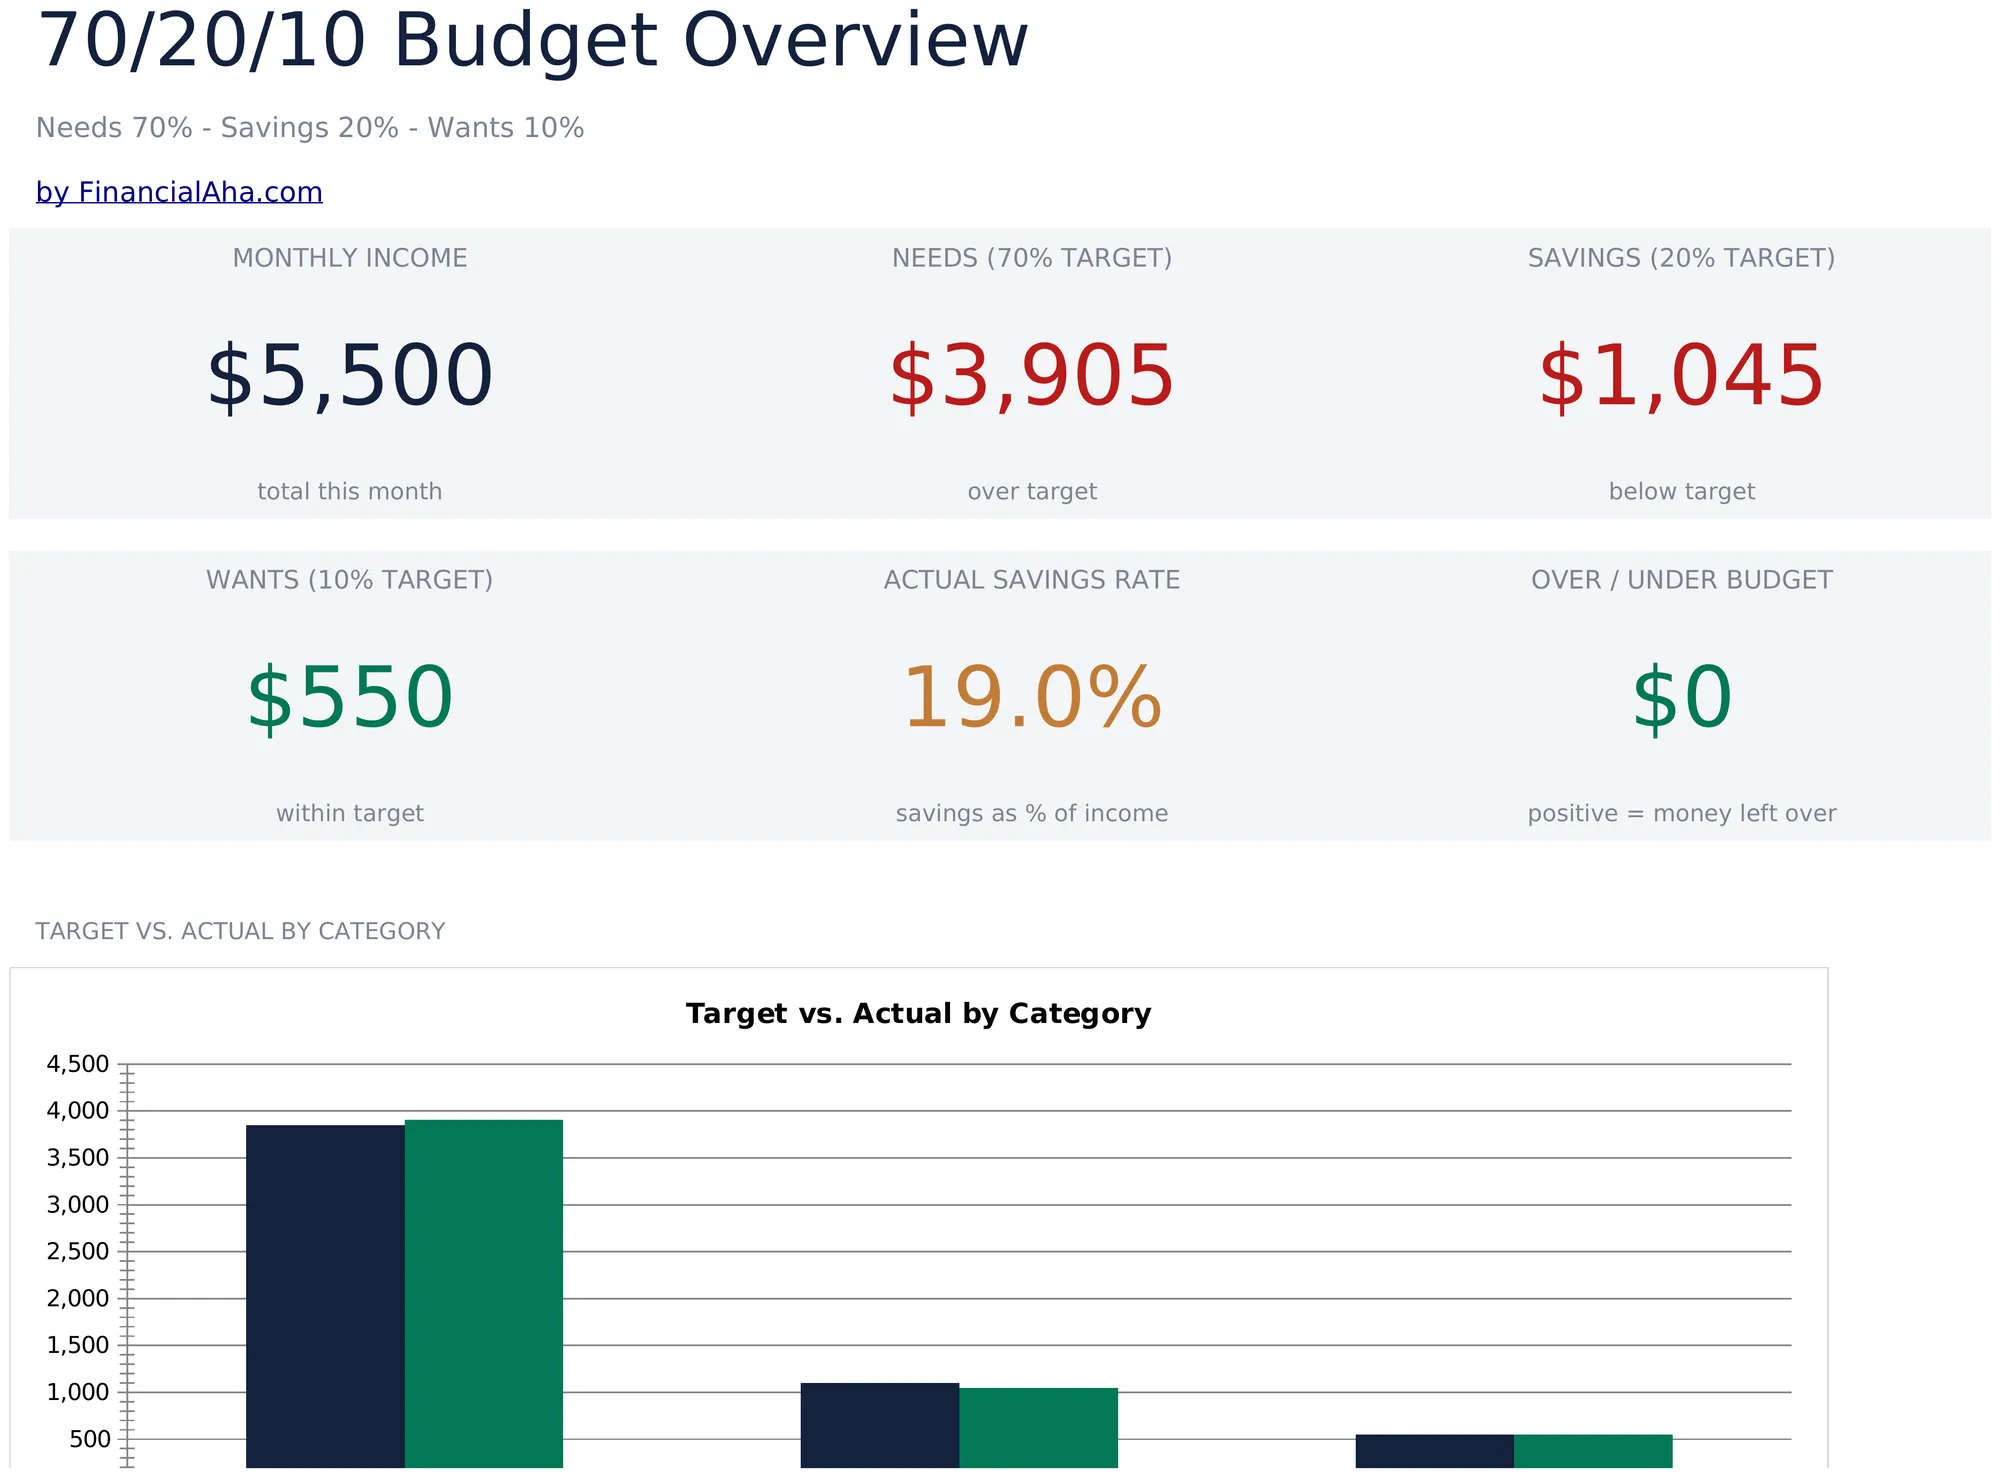
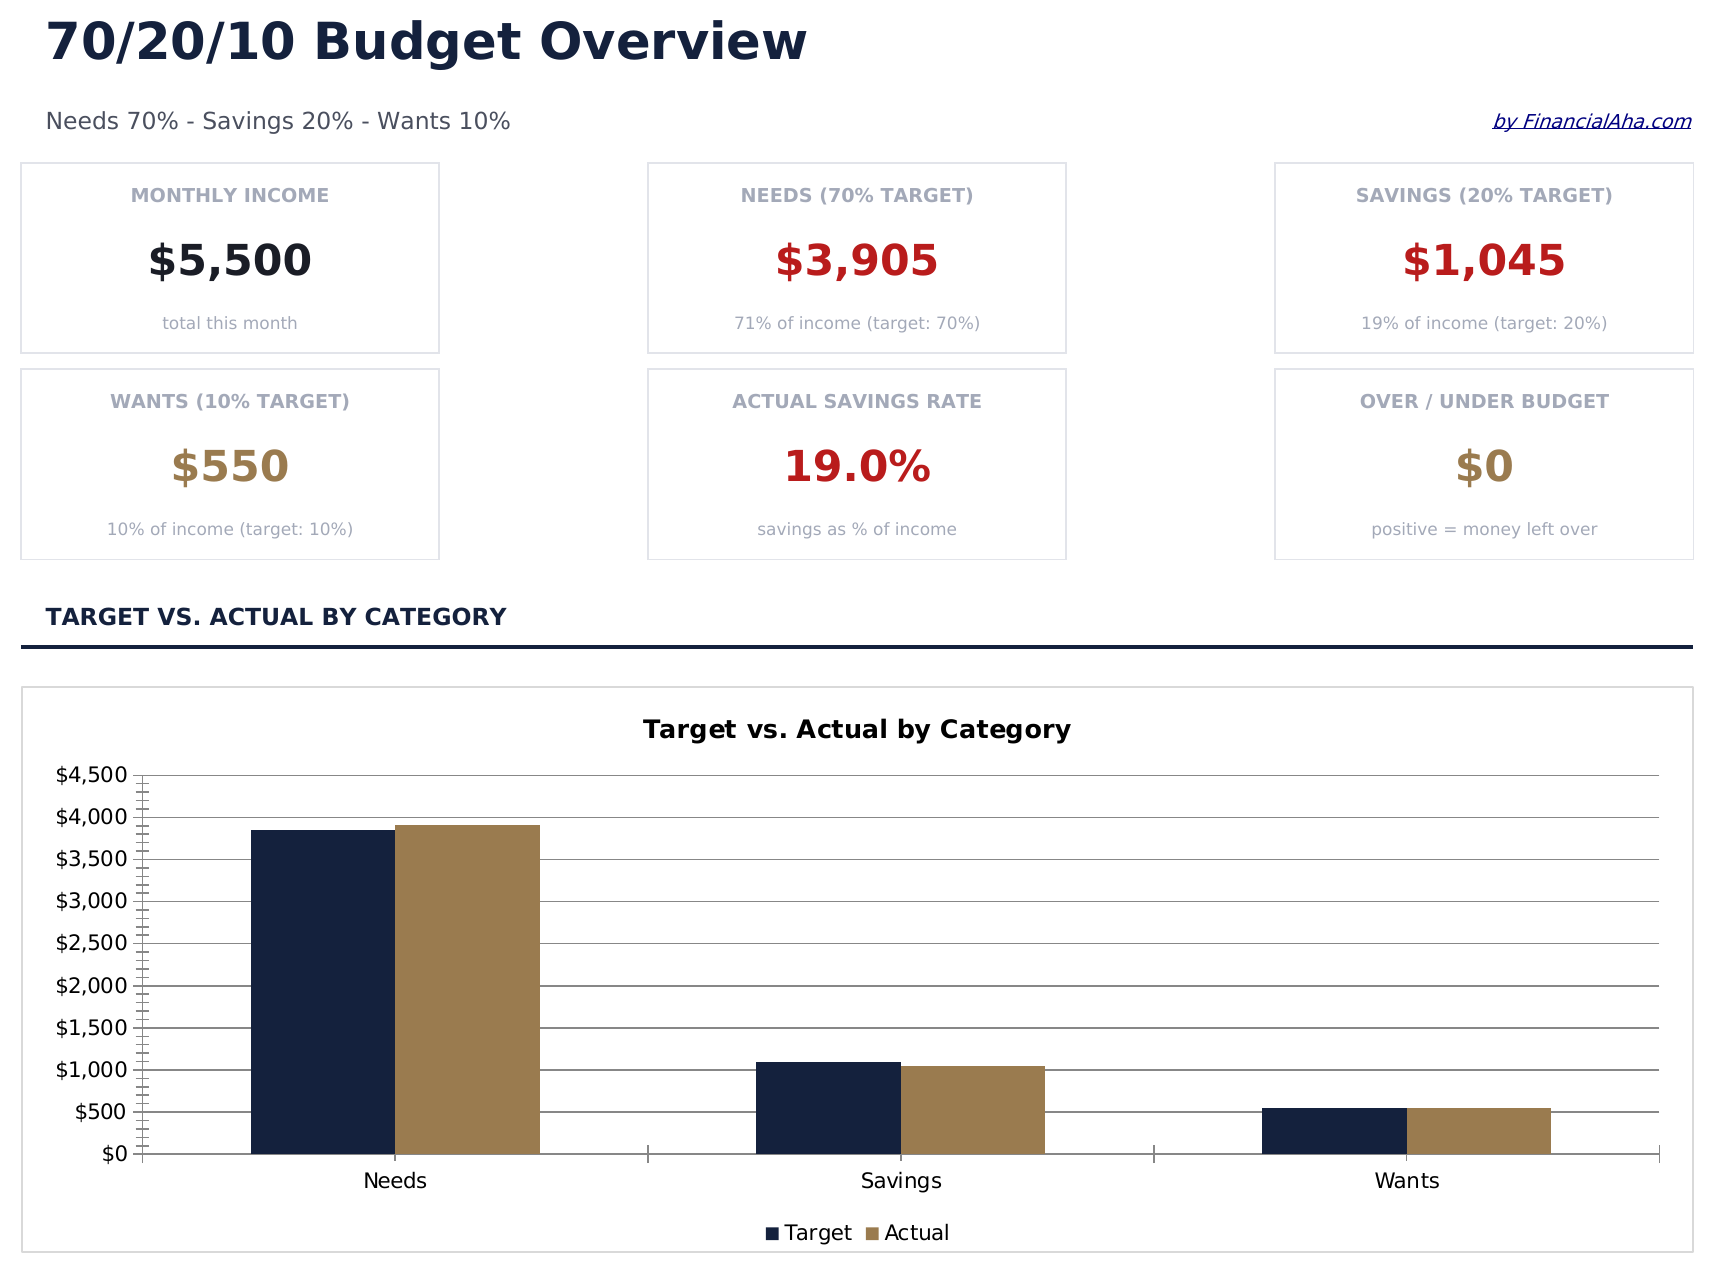
- Dashboard met 70/20/10-verdelingsweergave die levensonderhoud, besparingen en donatietoewijzingen visueel toont
- Automatische percentagetoewijzing die doelbedragen voor elke categorie berekent op basis van bruto-inkomen
- Budgettracker met formules voor huur, voeding, nutsvoorzieningen, verzekeringen en andere levenskosten
- Inkomensgebaseerde categoriedoelen met maandelijkse afwijkingssamenvatting die meer- of minderbesteding markeert
- Kleurgecodeerde invoervelden (geel) en automatisch berekende samenvattingscellen (blauw) voor begeleide gegevensinvoer
- Werkt in Microsoft Excel, Google Sheets en LibreOffice Calc zonder installatie
Need more from this template?
The Essentials version covers everyday tracking. Ultimate goes further with multi-entity support, scenario analysis, and ultimate-grade reporting.
- Dashboard met 70/20/10-verdelingsweergave die levensonderhoud, besparingen en donatietoewijzingen visueel toont
- Automatische percentagetoewijzing die doelbedragen voor elke categorie berekent op basis van bruto-inkomen
- Budgettracker met formules voor huur, voeding, nutsvoorzieningen, verzekeringen en andere levenskosten
- Inkomensgebaseerde categoriedoelen met maandelijkse afwijkingssamenvatting die meer- of minderbesteding markeert
- Dashboard met 6 KPI-kaarten: maandelijks inkomen, totaal levensonderhoud, totaal sparen, totaal schuld of giften, algeheel saldo en bijgehouden maanden
- Werkblad Budgettracker dat 70%, 20% en 10% bedragdoelen berekent uit maandelijks inkomen met werkelijk versus doel vergelijking per categorie
- Werkblad Levensonderhoud voor alle dagelijkse kosten - wonen, eten, vervoer, nutsvoorzieningen, verzekeringen en persoonlijke uitgaven - met subtotalen en 70% tracking
- Werkblad Sparen voor noodfonds, pensioen, beleggingen en kortetermijnspaardoelen met voortgangstracking en vergelijking met 20% doel
- Werkblad Schuld en Giften dat schuldbetalingen en liefdadigheidsgiften samen bijhoudt in de 10% categorie - elk met eigen subcategorierijen
Voorbeeld
Bekijk wat er in dit sjabloon zit
Hoe gebruik je dit 70/20/10-budget sjabloon
Voer maandelijks inkomen in
Voeg uw netto-inkomen bovenaan toe. Het sjabloon verdeelt het in 70% levensonderhoud, 20% besparingen en 10% donaties of schuld.
Vul levenskosten in
Wijs uw reguliere kosten toe - huur, voeding, nutsvoorzieningen, verzekeringen en vervoer - aan de 70% levensonderhoudscategorie.
Wijs besparingen en donaties toe
Voer spaarbijdragen in de 20%-categorie in en liefdadigheidsbijdragen of extra schuldbetalingen in de 10%-categorie.
Controleer de verdeling
Het dashboard toont werkelijk vs. doel voor elke categorie en laat zien of uw uitgaven overeenkomen met het 70/20/10-raamwerk.
Customer Reviews
What Our Customers Say
"If I get half as good at handling my finances as you are at customer service, this'll be the best $26 I've spent lately."
"Great tool! Simplifies financial planning without the hassle of complex spreadsheets."
"I recently purchased your super convenient spreadsheet, it really helps me!"
"They're great and super intuitive. Thank you!"
Gebouwd door Claude AI. Verfijnd door ons.
We gebruiken Claude AI om elk sjabloon te ontwerpen, na uitgebreid onderzoek. Daarna neemt ons team het over. We verfijnen de indeling, testen elke formule grondig, lossen randgevallen op en polijsten het ontwerp totdat het iets is dat we zelf ook echt zouden gebruiken. De AI brengt ons 80% van de weg. De laatste 20% is puur menselijk oordeel.
Veelgestelde vragen
Wat valt in de 10%-categorie?
De 10%-categorie is doorgaans voor liefdadigheid, donaties, tienden of extra schuldbetalingen boven het minimum. U kunt het gebruiken voor welk doel dan ook dat bij uw prioriteiten past.
Is dit gebaseerd op bruto- of netto-inkomen?
Het sjabloon werkt met netto-inkomen (na belasting). Voer het bedrag in dat u daadwerkelijk meeneemt van uw loon.
Kan ik de percentages aanpassen?
Ja. De percentagecellen zijn bewerkbaar. Wijzig ze naar elke verhouding die beter past bij uw inkomsten en uitgavenrealiteit.
Wat als ik geen 20% kan sparen?
Het sjabloon toont de afwijking zodat u kunt zien hoe ver u ervanaf zit. Zelfs beginnen met een kleiner spaarpercentage en in de loop van de tijd opbouwen is een geldige aanpak.
Hoe open ik dit in Google Sheets?
Upload het .xlsx-bestand naar Google Drive en open het vervolgens met Google Sheets. Alle formules en opmaak blijven behouden.
Meer Essentials-sjablonen voor Persoonlijk Budgetteren
Hoogtepunten:
Op zoek naar premium spreadsheet-sjablonen?
Onze betaalde sjablonen bevatten geavanceerde dashboards met meerdere werkbladen, ingebouwde Excel-grafieken en doorlopende updates.
Krijg in plaats daarvan elk Ultimate sjabloon
Alle 58 Ultimate sjablonen in één aankoop voor $299 - $1,102 waarde, u houdt $803 over.