70/20/10-Budget Essentials-Vorlage
Teilen Sie Einkommen in 70% Lebenshaltungskosten, 20% Sparen und 10% Spenden oder Schulden auf. Ein minimalistisches prozentbasiertes Budgetierungsprinzip.
Was enthalten ist
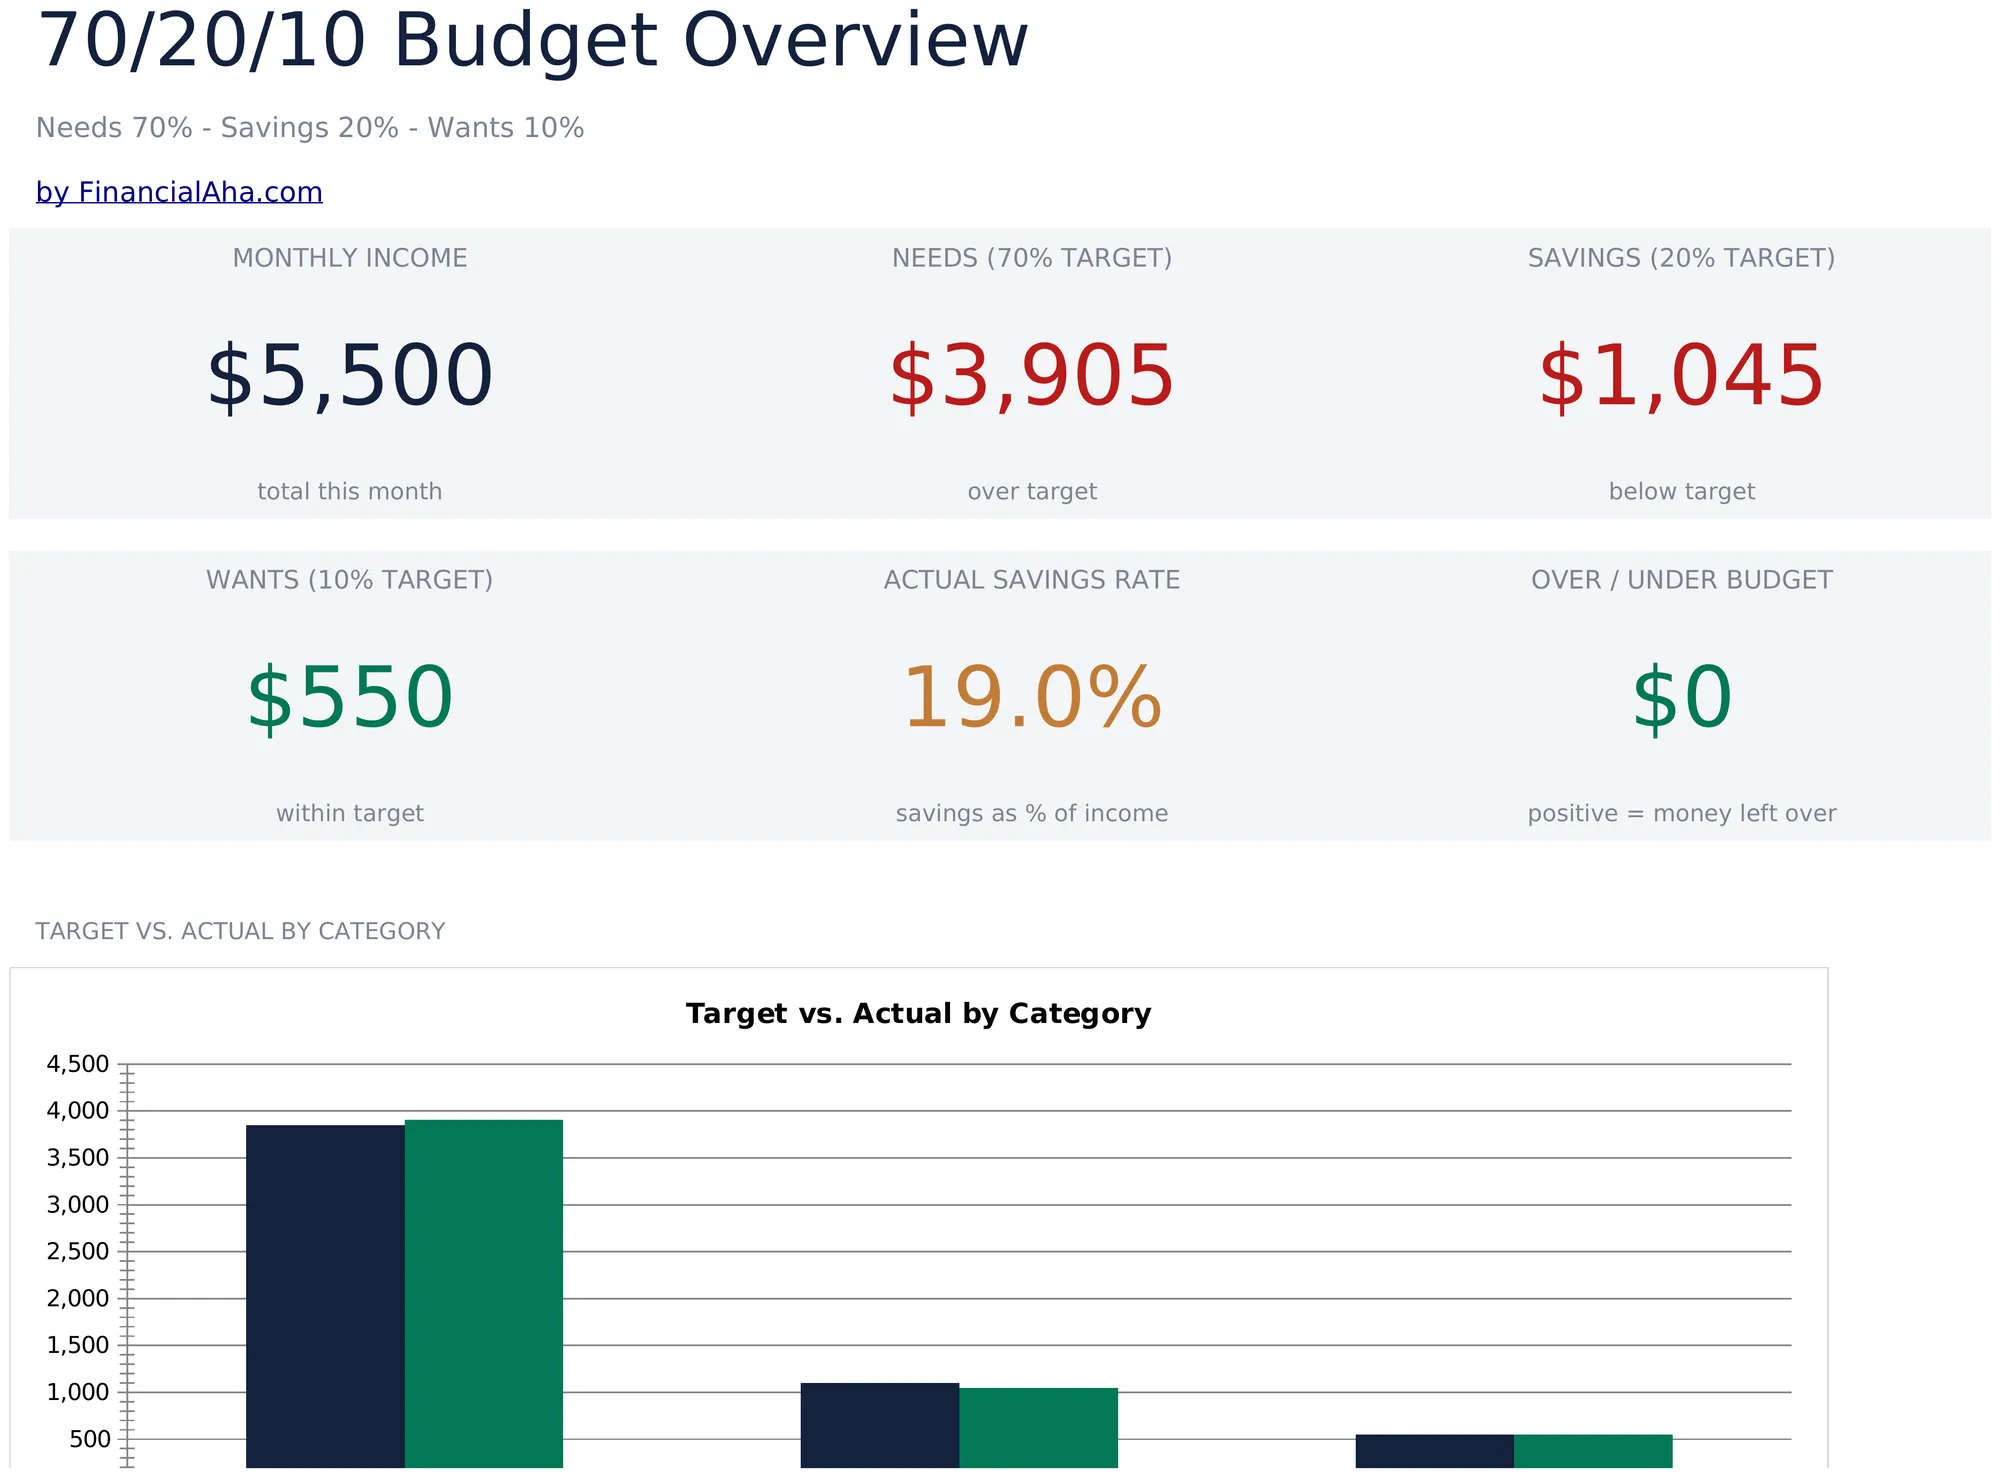
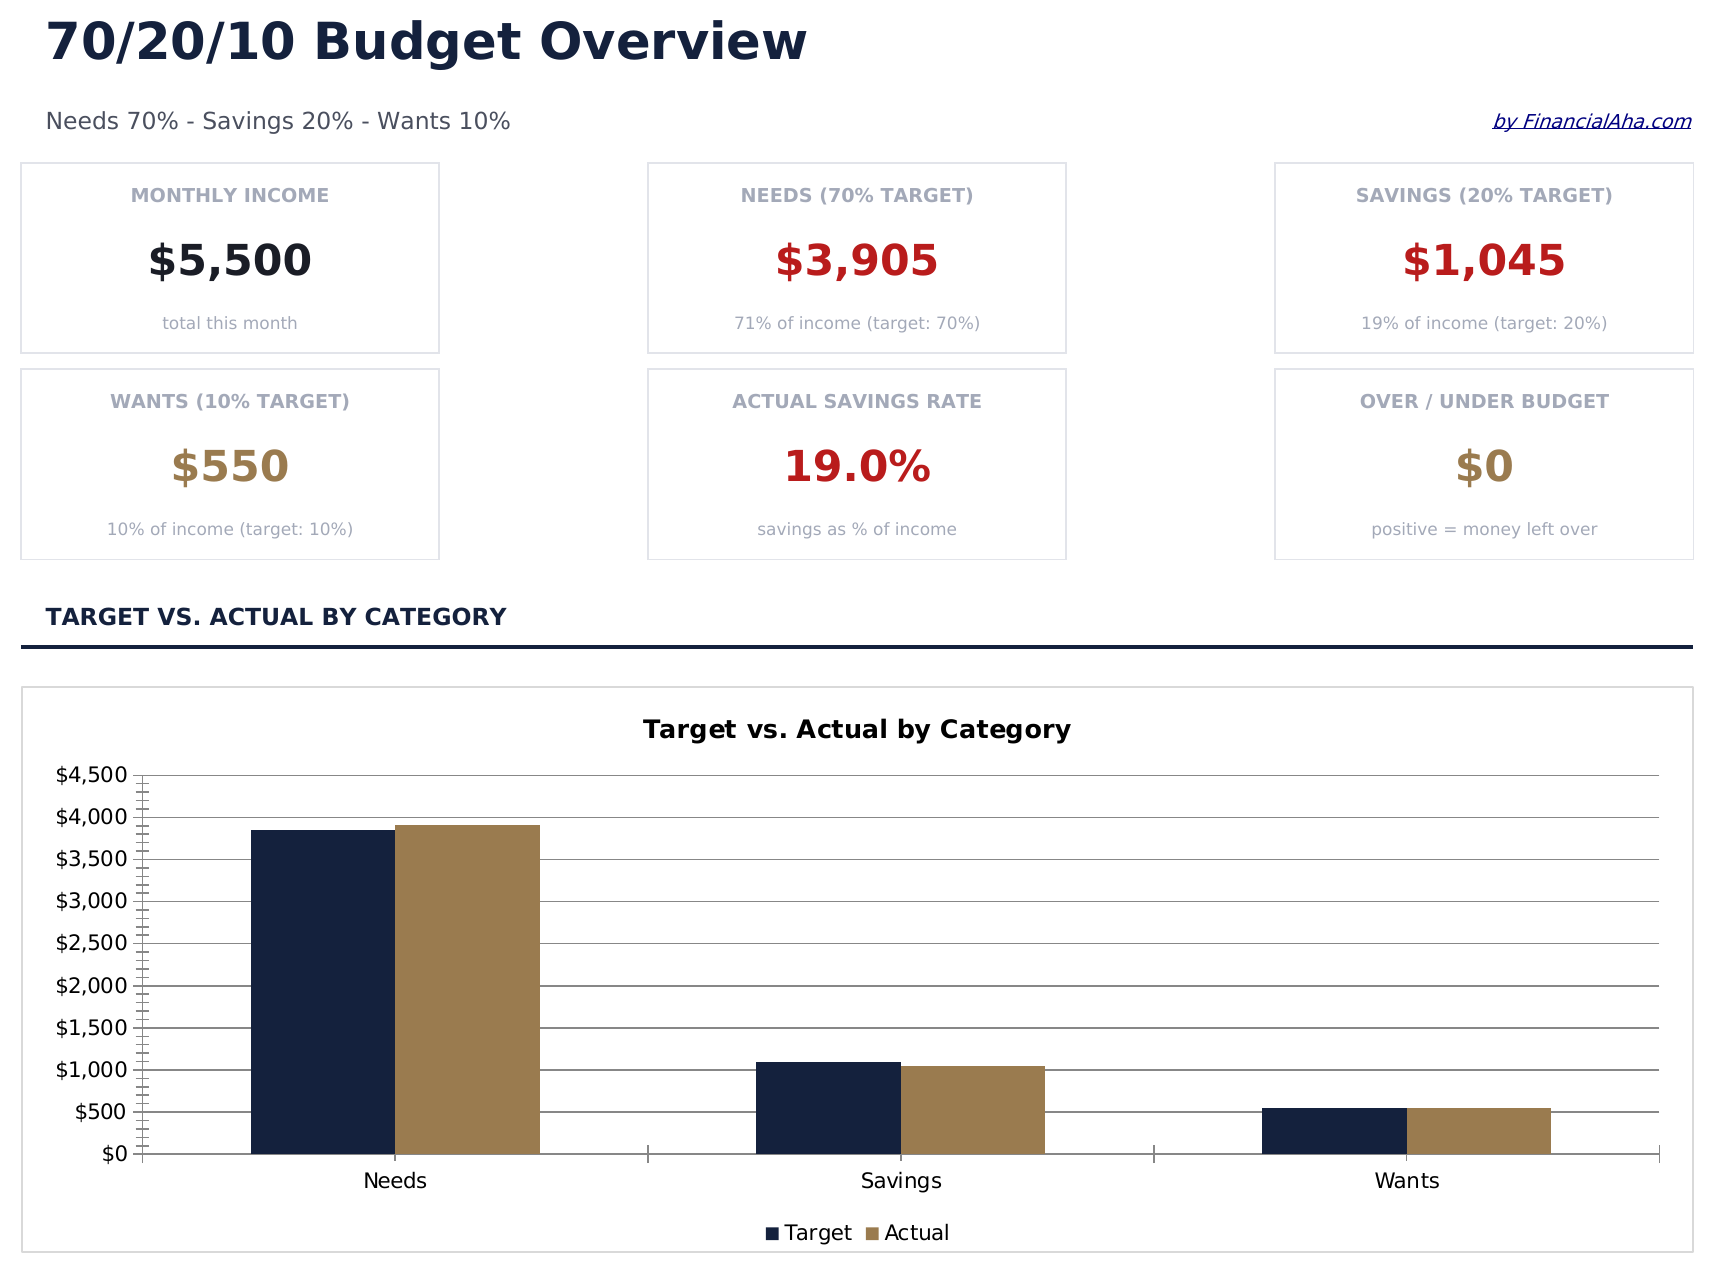
- Dashboard mit 70/20/10-Aufteilungsansicht, die Lebenshaltungskosten, Sparen und Spendenallokationen visuell darstellt
- Automatische Prozentzuweisung, die Zielbetraege fuer jede Kategorie aus dem Bruttoeinkommen berechnet
- Budgettracker mit Formeln fuer Miete, Lebensmittel, Nebenkosten, Versicherung und andere Lebenshaltungskosten
- Einkommensbasierte Kategorieziele mit monatlicher Abweichungszusammenfassung, die ueber- oder Unterausgaben hervorhebt
- Farbcodierte Eingabefelder (gelb) und automatisch berechnete Zusammenfassungszellen (blau) fuer gefuehrte Dateneingabe
- Funktioniert in Microsoft Excel, Google Sheets und LibreOffice Calc ohne Einrichtung
Need more from this template?
The Essentials version covers everyday tracking. Ultimate goes further with multi-entity support, scenario analysis, and ultimate-grade reporting.
- Dashboard mit 70/20/10-Aufteilungsansicht, die Lebenshaltungskosten, Sparen und Spendenallokationen visuell darstellt
- Automatische Prozentzuweisung, die Zielbetraege fuer jede Kategorie aus dem Bruttoeinkommen berechnet
- Budgettracker mit Formeln fuer Miete, Lebensmittel, Nebenkosten, Versicherung und andere Lebenshaltungskosten
- Einkommensbasierte Kategorieziele mit monatlicher Abweichungszusammenfassung, die ueber- oder Unterausgaben hervorhebt
- Dashboard mit 6 KPI-Karten: monatliches Einkommen, Lebenshaltungskosten gesamt, Sparen gesamt, Schulden oder Spenden gesamt, Gesamtsaldo und verfolgte Monate
- Budget-Tracker mit Berechnung der 70%-, 20%- und 10%-Euroziele aus dem monatlichen Einkommen mit Ist-Soll-Vergleich pro Bereich
- Tabellenblatt Lebenshaltungskosten für alle täglichen Kosten - Wohnen, Essen, Transport, Nebenkosten, Versicherung und persönliche Ausgaben - mit Zwischensummen und 70%-Verfolgung
- Tabellenblatt Sparen für Notfallfonds, Altersvorsorge, Anlagen und kurzfristige Sparziele mit Fortschrittsverfolgung und 20%-Zielvergleich
- Tabellenblatt Schulden und Spenden für Schuldenzahlungen und Spenden zusammen im 10%-Bereich - jeweils mit eigenen Unterkategoriezeilen
Vorschau
Sehen Sie, was in dieser Vorlage enthalten ist
So verwenden Sie diese 70/20/10-Budget-Vorlage
Monatliches Einkommen eingeben
Fuegen Sie Ihr Nettoeinkommen oben hinzu. Die Vorlage teilt es in 70% Lebenshaltungskosten, 20% Sparen und 10% Spenden oder Schulden auf.
Lebenshaltungskosten eintragen
Weisen Sie Ihre regelmaessigen Kosten - Miete, Lebensmittel, Nebenkosten, Versicherung und Transport - dem 70%-Lebenshaltungskostenbereich zu.
Sparen und Spenden zuweisen
Tragen Sie Sparbeitraege im 20%-Bereich und wohltaetige Spenden oder zusaetzliche Schuldenzahlungen im 10%-Bereich ein.
Aufschluesselung pruefen
Das Dashboard zeigt Ist- vs. Sollwerte fuer jeden Bereich und zeigt, ob Ihre Ausgaben mit dem 70/20/10-Prinzip uebereinstimmen.
Customer Reviews
What Our Customers Say
"If I get half as good at handling my finances as you are at customer service, this'll be the best $26 I've spent lately."
"Great tool! Simplifies financial planning without the hassle of complex spreadsheets."
"I recently purchased your super convenient spreadsheet, it really helps me!"
"They're great and super intuitive. Thank you!"
Erstellt von Claude AI. Verfeinert von uns.
Wir verwenden Claude AI, um jede Vorlage nach gründlicher Recherche zu entwerfen. Dann greift unser Team ein. Wir verfeinern das Layout, testen jede Formel auf Herz und Nieren, beheben Grenzfälle und polieren das Design, bis es sich anfühlt wie etwas, das wir selbst verwenden würden. Die KI bringt uns 80 % ans Ziel. Die letzten 20 % sind rein menschliches Urteilsvermögen.
Häufig gestellte Fragen
Was gehoert in den 10%-Bereich?
Der 10%-Bereich ist typischerweise fuer wohltaetige Spenden, Zuwendungen, Kirchensteuer oder zusaetzliche Schuldenzahlungen ueber die Mindestzahlungen hinaus. Sie koennen ihn fuer den Zweck verwenden, der zu Ihren Prioritaeten passt.
Basiert dies auf Brutto- oder Nettoeinkommen?
Die Vorlage funktioniert mit Nettoeinkommen (nach Steuern). Geben Sie den Betrag ein, den Sie tatsaechlich von Ihrem Gehalt erhalten.
Kann ich die Prozentsaetze anpassen?
Ja. Die Prozentzellen sind bearbeitbar. Aendern Sie sie in ein beliebiges Verhaeltnis, das Ihre Einkommens- und Ausgabenrealitaet besser widerspiegelt.
Was ist, wenn ich nicht 20% sparen kann?
Die Vorlage verfolgt die Abweichung, damit Sie sehen koennen, wie weit Sie vom Ziel entfernt sind. Auch mit einem kleineren Sparprozentsatz zu beginnen und ihn im Laufe der Zeit zu steigern, ist ein valider Ansatz.
Wie öffne ich diese Vorlage in Google Sheets?
Laden Sie die .xlsx-Datei auf Google Drive hoch und öffnen Sie sie mit Google Sheets. Alle Formeln und Formatierungen bleiben erhalten.
Weitere Essentials-Vorlagen: Persoenliches Budget
Highlights:
Auf der Suche nach Premium-Tabellenvorlagen?
Unsere kostenpflichtigen Vorlagen umfassen erweiterte mehrseitige Dashboards, native Excel-Diagramme und laufende Aktualisierungen.
Holen Sie sich stattdessen jede Ultimate-Vorlage
Alle 58 Ultimate-Vorlagen in einem Kauf für $299 - $1,102 Wert, Sie behalten $803.