
To project net worth, start with your current figure, add each year's savings, and grow the running total at an assumed return, so Year N equals (prior year plus annual savings) times (1 plus the return rate). Run it across 5, 10, and 20 years at a few different return assumptions to see a range rather than a single number. The worked example below turns $50,000 today, plus $12,000 saved a year at a 7% return, into roughly $102,500 after three years.
Knowing your current net worth is valuable. Projecting where it’ll be in 5, 10, or 20 years? That transforms static numbers into a roadmap.
Planning tools: The Financial Planning Template includes built-in projection features, while the Net Worth Tracker provides the historical data to base forecasts on.
Net worth projections help you understand if your current trajectory leads where you want to go.
Why Project Net Worth
Visualize Progress
Seeing “on track for $1M by age 55” makes abstract goals concrete.
Test Scenarios
What if you increased savings by $200/month? Projections show the impact.
Identify Gaps
Projections showing you falling short? Worth knowing now rather than discovering it too late.
Motivate Action
Watching projected numbers grow reinforces the value of consistent saving.
Basic Projection Formula
The Components
Future Net Worth = Current Net Worth + Future Savings + Investment GrowthSimplified Annual Projection
Year N Net Worth = (Year N-1 Net Worth + Annual Savings) × (1 + Return Rate)Example
Starting with:
- Net worth: $50,000
- Annual savings: $12,000
- Expected return: 7%
Year 1: ($50,000 + $12,000) × 1.07 = $66,340
Year 2: ($66,340 + $12,000) × 1.07 = $83,824
Year 3: ($83,824 + $12,000) × 1.07 = $102,532
Setting Assumptions
Savings Rate
Conservative: Current savings amount, no increases
Moderate: Current savings plus 2-3% annual increases
Optimistic: Planned significant increases
Investment Returns
| Assumption Level | Annual Return |
|---|---|
| Conservative | 5% |
| Moderate | 7% |
| Optimistic | 9% |
Historical stock market average runs around 10%, but lower assumptions account for bonds, fees, and volatility.
Inflation Adjustment
For real purchasing power, reduce the return assumption by the inflation rate. The U.S. Bureau of Labor Statistics tracks inflation through the Consumer Price Index, which has historically run in the 2-3% range over long periods:
- Nominal 7% return
- 3% inflation
- Real 4% return
A nominal projection shows the raw future balance; a real projection shows what that balance would buy in today’s money.
Time Horizon
Worth projecting at least to retirement age. Longer timeframes show the more dramatic compounding effects.
Building a Projection Spreadsheet
Column Structure
| Year | Age | Starting NW | Savings | Return | Ending NW |
|---|---|---|---|---|---|
| 2026 | 35 | $50,000 | $12,000 | 7% | $66,340 |
| 2027 | 36 | $66,340 | $12,000 | 7% | $83,824 |
| 2028 | 37 | $83,824 | $12,000 | 7% | $102,532 |
Formulas
Ending Net Worth:
=(StartingNW + Savings) × (1 + ReturnRate)Next Year Starting NW:
=Previous Year Ending NWCompound Growth Formula (Shortcut)
For a lump sum plus regular contributions:
FV = PV × (1+r)^n + PMT × (((1+r)^n - 1) / r)Where:
- FV = Future Value
- PV = Present Value (current net worth)
- r = Annual return rate
- n = Number of years
- PMT = Annual contribution
This shortcut treats contributions as arriving at the end of each year, so it runs slightly below the year-by-year table above, which adds savings at the start of the year before growing them. The gap is small and both are valid ways to model it.
To try your own figures without building the sheet first, the compound interest calculator runs the same present value, contribution, rate, and time inputs:
Sample Projections
Conservative Scenario
Assumptions:
- Current net worth: $75,000
- Annual savings: $10,000
- Return: 5%
- Years: 20
| Year | Net Worth |
|---|---|
| Today | $75,000 |
| Year 5 | $154,000 |
| Year 10 | $254,000 |
| Year 15 | $382,000 |
| Year 20 | $546,000 |
Moderate Scenario
Assumptions:
- Current net worth: $75,000
- Annual savings: $15,000
- Return: 7%
- Years: 20
| Year | Net Worth |
|---|---|
| Today | $75,000 |
| Year 5 | $197,000 |
| Year 10 | $369,000 |
| Year 15 | $610,000 |
| Year 20 | $948,000 |
Aggressive Scenario
Assumptions:
- Current net worth: $75,000
- Annual savings: $24,000
- Return: 8%
- Years: 20
| Year | Net Worth |
|---|---|
| Today | $75,000 |
| Year 5 | $262,000 |
| Year 10 | $537,000 |
| Year 15 | $942,000 |
| Year 20 | $1,536,000 |
Including Debt Payoff
Impact of Debt Elimination
Debt payoff has a dual effect:
- Reduces liabilities (increases net worth)
- Frees cash for savings (accelerates growth)
Projection with Debt Phase
Years 1-5: Debt focus
- Extra payments reduce debt
- Minimal investment growth
Years 6+: Debt-free acceleration
- Previous debt payments redirect to investing
- Faster wealth building
Example
Current: -$10,000 net worth (assets less debt)
Phase 1 (Years 1-3): Direct $800/month at clearing roughly $30,000 of debt. Net worth climbs toward zero as the balances shrink.
Phase 2 (Years 4-20): Redirect that same $800/month ($9,600/year) into investments at a 7% return.
Starting Phase 2 from around $0, the numbers work out to:
- Year 3: about $0 net worth (debt cleared)
- Year 10: about $89,000
- Year 20: about $317,000
Working through a real recovery timeline is the focus of the negative net worth recovery plan.
Scenario Modeling
“What If” Questions
What if I increase savings 10%? Run the projection with $11,000 instead of $10,000 savings.
What if market returns are lower? Try 5% instead of 7% return.
What if I retire 5 years early? Shorter accumulation phase, longer withdrawal phase.
Multiple Scenarios Side by Side
| Scenario | Year 10 | Year 20 |
|---|---|---|
| Current path | $254,000 | $546,000 |
| +$5K savings | $320,000 | $720,000 |
| Higher returns (8%) | $318,000 | $844,000 |
| Both | $397,000 | $1,091,000 |
Goal-Based Projections
Working Backward
Have a target? Work backward:
Goal: $1,000,000 by age 55 (20 years away) Current: $100,000 Assumed return: 7%
Required annual savings: Solving the same compounding formula for the contribution that lands on $1,000,000: ≈ $14,000/year needed
Gap Analysis
| Element | Your Situation | Required |
|---|---|---|
| Current NW | $100,000 | - |
| Annual savings | $12,000 | $14,000 |
| Gap | - | $2,000/year |
This shows the choice: find roughly $2,000 more to save each year, or adjust the target. A related look at net worth milestones before 40 covers how those interim targets tend to be set.
Visualizing Projections
Growth Chart
A line chart showing net worth over time works well:
- X-axis: Years/Age
- Y-axis: Net worth
- Multiple lines for different scenarios
Milestone Markers
Add markers for goals:
- $100K milestone
- $500K milestone
- Retirement target
Confidence Ranges
Instead of a single line, showing a range helps:
- Optimistic scenario (top)
- Expected scenario (middle)
- Conservative scenario (bottom)
Updating Projections
When to Update
Worth refreshing:
- Annually with actual numbers
- Major life changes like new job, marriage, children
- Assumption changes when return expectations shift
Actual vs. Projected
Worth comparing projections to reality:
| Year | Projected | Actual | Variance |
|---|---|---|---|
| 2024 | $83,000 | $89,000 | +$6,000 |
| 2025 | $103,000 | $98,000 | -$5,000 |
Recalibrating
Consistently above or below projections? One approach is adjusting assumptions to match reality.
Limitations of Projections
What Projections Don’t Capture
- Market volatility (returns aren’t constant)
- Life surprises (job loss, health, windfalls)
- Inflation changes
- Tax impacts
- Behavioral changes
Treat Projections as a Range, Not a Prediction
Worth treating projections as directional guidance rather than precise prediction. They answer “approximately where am I headed?” not “exactly what will I have?”
Monte Carlo Alternative
For more sophisticated projections, Monte Carlo simulations run thousands of scenarios with varying returns. Dedicated planning software sometimes offers this. A spreadsheet projection like the one described here works differently: it runs a single set of assumptions and produces one path, which is why running it two or three times at different return rates is how the range gets built.
Using Planning Tools
Financial Planning Template
The Financial Planning Template includes:
- A Projection tab with a projection end year and six assumptions: income, expenses, assets growth, assets yield, debt change and inflation
- A month-by-month projection of assets, debt and net worth running to that end year, drawn as a chart
- A Goals tab holding eight targets, including net worth, liquid money, assets value and a debt ceiling, which the Summary marks as reached or not
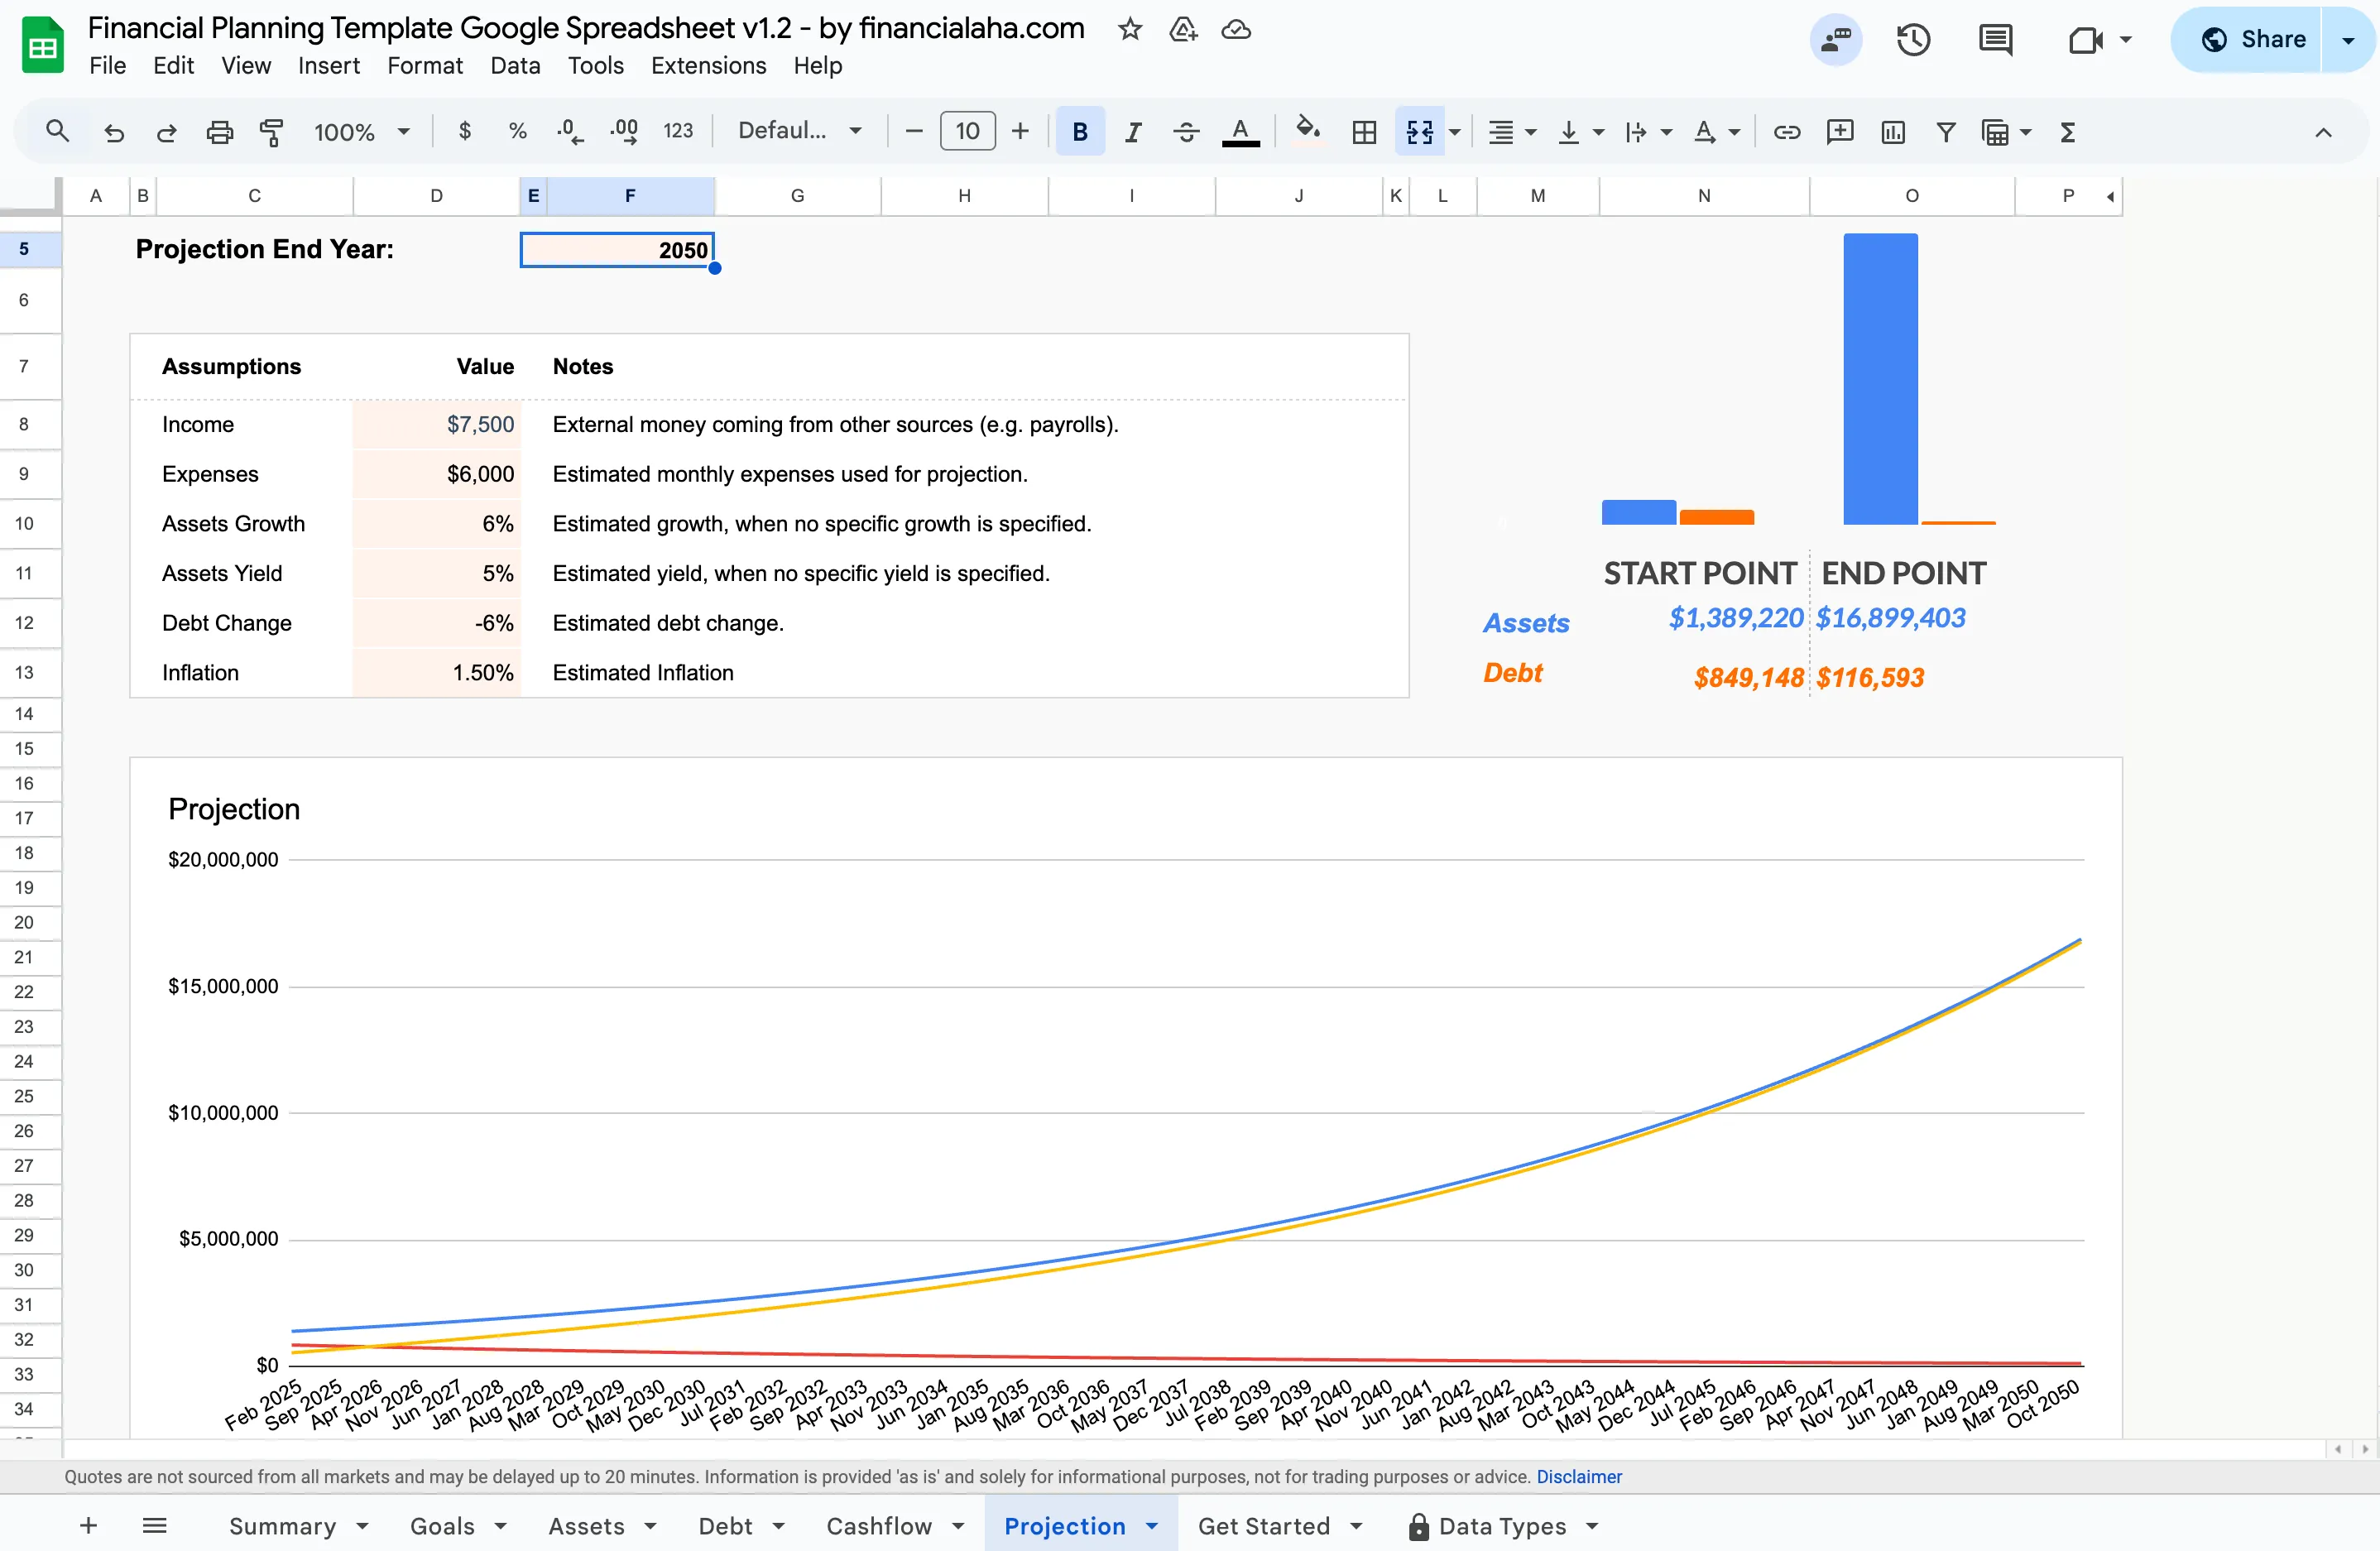 The Projection tab in the Financial Planning Template (Premium tier): set your assumptions, and the start-point and end-point figures for assets and debt, along with the chart, update automatically.
This template is built for the kind of forward-looking analysis covered in this article. It runs one set of assumptions at a time, so comparing scenarios means changing an assumption and reading the new end point rather than seeing several paths side by side.
Net Worth Tracker
The Net Worth Tracker provides:
- Assets and Liabilities tabs where every month you record is its own column
- A Summary with net worth, the change against last month, the year-to-date change and a Net Worth Over Time area chart
- A Milestones tab where each target is marked reached along with the date it happened
It records what has already happened rather than projecting forward, which is what makes it the source of the starting figure and the trend a projection is built on.
One approach is using both: the Net Worth Tracker for monthly tracking and the Financial Planning Template for the forward projection.
Related
- Net Worth Tracking for Beginners
- Financial Planning Template - Built-in projections
- Net Worth Tracker - Monthly history to project from
- Net Worth Milestones Before 40
- How Often to Calculate Net Worth
Net worth projections turn planning from guesswork into an informed picture. Modeling a few scenarios based on savings rate, investment returns, and time shows the range your trajectory could fall into, and where a change would move it. A practical starting point is the three-line formula near the top of this article: drop your current net worth, annual savings, and a return assumption into it, or into the compound interest calculator above, and extend the horizon out to the age you care about.
Frequently asked questions
How accurate are net worth projections?
Directionally useful, not precisely accurate. They show the path, not the exact destination.
What return rate should I use?
For long-term, broadly diversified investments, 6-7% is a common baseline. Some people adjust based on their asset allocation.
Should I include home equity in projections?
Worth including, though recognizing it's illiquid. One approach is projecting liquid net worth separately from total net worth.
Should I project in today's dollars or future dollars?
Both are used. A nominal projection grows at the full return, say 7%, and shows the raw future balance. A real projection subtracts inflation, using something closer to 4%, and shows what that balance buys in today's money. The U.S. Bureau of Labor Statistics tracks the inflation rate through the Consumer Price Index if you want a figure to subtract.
Why doesn't my spreadsheet match an online compound interest calculator?
Usually a timing difference. The formula in this article adds each year's savings and then grows it, which treats contributions as arriving at the start of the year. Many calculators add contributions at the end of the year, or compound monthly instead of annually, so they land slightly lower or higher. The gap is small over one year and widens over decades.
Sources
- Consumer Price Index - U.S. Bureau of Labor Statistics
About this article
Every projection figure in this article was recalculated with the compounding formula shown here: each year's balance is the prior balance plus annual savings, grown at the stated return rate. The inflation-adjustment step references the U.S. Bureau of Labor Statistics Consumer Price Index. Template features were checked on 2026-09-10 against the shipped Financial Planning Google Sheet (Summary, Goals, Assets, Debt, Cashflow, Projection tabs) and the shipped Net Worth Tracker Google Sheet (Summary, Assets, Liabilities, Milestones, Setup tabs). Last reviewed September 2026.