
Seven net worth milestones that indicate financial progress before age 40, what moves the timeline, how the gaps between them tend to feel, and how to mark one without undoing it.
Net worth milestones provide checkpoints. Rather than comparing yourself to others, these benchmarks measure progress against your own potential. They are not prescriptive, since life circumstances vary enormously, but they offer useful reference points for understanding where you stand.
Here are seven worth tracking, not as rigid targets but as indicators of financial health that many people find motivating.
| # | Milestone | What it measures | Typical age range |
|---|---|---|---|
| 1 | Positive net worth | Assets exceed liabilities | Mid to late 20s |
| 2 | Fully funded emergency fund | 3-6 months of essential expenses in accessible cash | Late 20s to early 30s |
| 3 | Net worth equals one year’s income | Net assets match gross annual salary | Early 30s |
| 4 | Consumer debt eliminated | No credit card or personal loan balances | Late 20s to mid-30s |
| 5 | Net worth equals two times income | Net assets at twice gross annual salary | Mid-30s |
| 6 | One year’s income in retirement accounts | Retirement balances alone match salary | Late 20s to early 30s |
| 7 | Net worth equals three times income | Net assets at three times gross annual salary | Late 30s to 40 |
The age ranges are typical rather than expected, and the section on timelines below covers what moves them.
1. Positive Net Worth
The first milestone is simple but significant: assets exceeding liabilities. For many people starting with student loans or early-career debt, crossing from negative to positive takes years. But reaching zero means the trajectory has shifted. You’ve stopped digging and started climbing, and that inflection point is worth recognizing.
Most people reach this milestone in their mid-to-late 20s, though the timeline varies significantly based on educational debt, career field, and starting circumstances. Someone graduating debt-free might hit this immediately; someone with $100,000 in student loans faces a longer path.
2. Fully Funded Emergency Fund
Having 3-6 months of essential expenses saved provides a buffer against the unexpected. This typically translates to $10,000-$30,000 depending on your monthly costs, and an emergency fund calculator can size the target against your own expenses. The money sits accessible, neither invested in retirement accounts nor tied up in home equity, ready for job loss or major emergencies.
This milestone often comes in the late 20s to early 30s, though it depends heavily on income stability and expenses. Some prioritize this before any other financial goal; others build it gradually while also paying down debt or investing.
3. Net Worth Equals One Year’s Income
When net worth reaches one year’s gross salary, it represents a meaningful marker. At $60,000 income, this means $60,000 in net assets. You’ve accumulated a full year’s earnings, money that can grow and compound over time.
Early 30s is a common timeline for reaching this milestone. Income growth through the late 20s and early 30s helps, as does the accumulation of retirement contributions and any home equity.
4. Consumer Debt Eliminated
Zero credit card and personal loan debt clears the path for wealth building. Mortgage and student loans may remain, since they typically carry lower interest rates and serve specific purposes, but high-interest consumer debt drains resources that could otherwise grow.
Most people who prioritize this reach it between their late 20s and mid-30s. The timeline depends heavily on how much debt existed initially and how aggressively it was addressed.
5. Net Worth Equals Two Times Income
At twice annual income, compound growth starts becoming visible in portfolio statements. With a $70,000 income, this milestone means $140,000 in net assets. The gap between one and two times income often closes faster than reaching one times, because previous savings generate returns that accelerate progress.
Mid-30s is typical for this milestone, assuming relatively consistent saving and investing since the early career years.
6. One Year’s Income in Retirement Accounts
This milestone focuses specifically on retirement savings rather than total net worth. Fidelity’s benchmark suggests 1x salary by 30 and 3x by 40, so this milestone aligns with that earlier target. Having a full year’s income dedicated to retirement provides a foundation for decades of growth.
Late 20s to early 30s is the typical timeline, though workplace retirement plan access and match availability significantly affect the pace.
7. Net Worth Equals Three Times Income
At $80,000 income, this milestone means $240,000 in net assets. Reaching 3x income creates meaningful financial flexibility: the ability to weather extended setbacks, consider career changes, or simply feel less constrained by financial pressure.
Late 30s to age 40 is typical for reaching this milestone, which aligns with Fidelity’s 3x by 40 retirement guideline but includes all assets, not just retirement accounts.
Factors That Affect Your Timeline
Everyone’s path to these milestones looks different. Understanding the factors that influence timing helps contextualize your own progress without unhelpful comparisons.
Income level matters significantly. Higher income creates more room for saving after covering essentials. This isn’t about blame or merit, just mathematical reality. Two people with identical savings rates will reach milestones at different times if their incomes differ.
Debt starting point shapes the early years dramatically. Starting with $100,000 in student loans requires a longer climb than graduating debt-free. The same applies to credit card debt, car loans, or medical debt that accumulated before earning power increased.
Location affects what’s possible. High cost-of-living areas consume more income for housing, transportation, and daily expenses. Someone saving 20% in a low-cost city keeps more dollars than someone saving 20% in an expensive metro, even when the percentage is identical. The same geography gap turns up in the average net worth by state figures.
Career trajectory typically helps over time. Income usually rises through the 30s as experience accumulates and skills develop. Earlier milestones may take longer; later ones often accelerate as income grows.
What the Gaps Between Milestones Feel Like
The first $100,000 has a reputation for being the hardest stretch, an observation usually traced back to Charlie Munger. The arithmetic behind it is straightforward. Early on, almost all of the growth comes from money you set aside yourself, because the balance is too small for returns to contribute much. Once the balance is larger, returns start doing a visible share of the work, and the second $100,000 typically arrives faster than the first. The math behind compounding shows why the curve steepens as the balance grows.
Between milestones, progress can feel like it has stopped. That flat stretch is usually a measurement problem rather than a progress problem, because milestones sit far apart by design. Monthly tracking shows movement that milestone-to-milestone tracking hides, so the distance between $50,000 and $100,000 can feel endless while the monthly numbers are still climbing.
Comparison distorts the view in the other direction. Someone reaching $500,000 at 30 doesn’t change what $50,000 at 45 represents. Starting points, debt loads, incomes and family circumstances differ enough that comparisons between two people carry very little information. Measured against your own previous numbers, the same milestone list becomes far more readable.
Accelerating Toward Milestones
While timelines vary, some factors fall within your control. These approaches tend to accelerate progress regardless of starting point.
Increasing savings rate is the most controllable factor. The difference between saving 10% and 20% of income compounds dramatically over a decade, and small increases of even 1-2% per year add up significantly.
Eliminating high-interest debt creates guaranteed returns equal to the interest rate. Paying off a 20% credit card balance is equivalent to earning 20% on an investment, a return impossible to guarantee in markets.
Investing consistently matters more than timing. Regular contributions regardless of market conditions builds wealth over time. Waiting for the “right moment” to invest often costs more than imperfect timing.
Avoiding lifestyle inflation directs raises toward wealth building rather than spending. When income increases, maintaining current spending levels and saving the difference accelerates every milestone.
Marking a Milestone Without Undoing It
Financial progress rarely arrives with a ceremony. Unlike a promotion or a graduation, nothing external happens when net worth crosses a number that took three years to reach, and some people find that the absence of any marker makes the long stretches harder to sustain.
One approach that keeps the marking proportional is to cap it at 1% of the milestone amount.
| Milestone | 1% marker budget |
|---|---|
| $10,000 | $100 |
| $50,000 | $500 |
| $100,000 | $1,000 |
| $250,000 | $2,500 |
There is no research behind the 1% figure and it isn’t an established rule. It simply ties the size of the marker to the size of the milestone, so that recognizing progress doesn’t measurably reverse it. Adjusting the figure for how long the milestone took, or skipping it entirely, changes nothing about the underlying numbers.
Some milestones are worth treating more cautiously. A number reached mainly because markets rose 20% in a year reflects timing as much as saving, and it can reverse just as quickly. A number likely to be crossed back the following month, because of a known large expense or a volatile portfolio, is a fragile place to plant a flag. A milestone shared publicly can also land badly with people whose circumstances are very different, which is worth weighing before posting it.
Tracking Progress
Calculating net worth at least annually provides the data needed to track milestone progress. Quarterly tracking offers more granular feedback without becoming obsessive. Consistency is what makes the series usable: same method, same timing, comparable results over time. To place yourself against the list, start with a single current figure:
Recording the date each milestone was reached, along with how long it took and what was happening at the time, turns a column of numbers into a record that reads back years later. An illustrative log looks like this:
| Milestone | Date reached | Months since previous | Average per month |
|---|---|---|---|
| $0 (break even) | Jan 2024 | ||
| $25,000 | Nov 2024 | 10 | ~$2,500 |
| $50,000 | Aug 2025 | 9 | ~$2,780 |
| $100,000 | Jul 2026 | 11 | ~$4,550 |
Those figures are made up rather than one reader’s real series, but the shape is worth reading carefully. The calendar gaps barely change, and the last one is actually longer than the one before it, while the amount accumulated each month nearly doubles across the three steps. Milestones spaced further apart in dollars take longer even when the underlying pace is rising, which is one reason the calendar gap between milestones is a poor measure of progress on its own.
When tracking, note which milestones you’ve passed and which are next. Looking at trajectory matters as much as current position. Are you moving in the right direction? Is the pace accelerating or slowing? Extending that trajectory forward is what net worth projections do, turning a savings rate and a growth assumption into an estimated future line. The Net Worth Tracker shows current net worth with the change since last month and the year-to-date change beside it, and a NET WORTH OVER TIME chart covers the longer history. Milestones there are ones you define yourself on a Milestones tab, where targets can be added, edited or removed, and the date each one is reached fills in automatically. The Summary reports how many have been reached and how far along the next one is, though the months-between and per-month columns in the table above are not part of it.
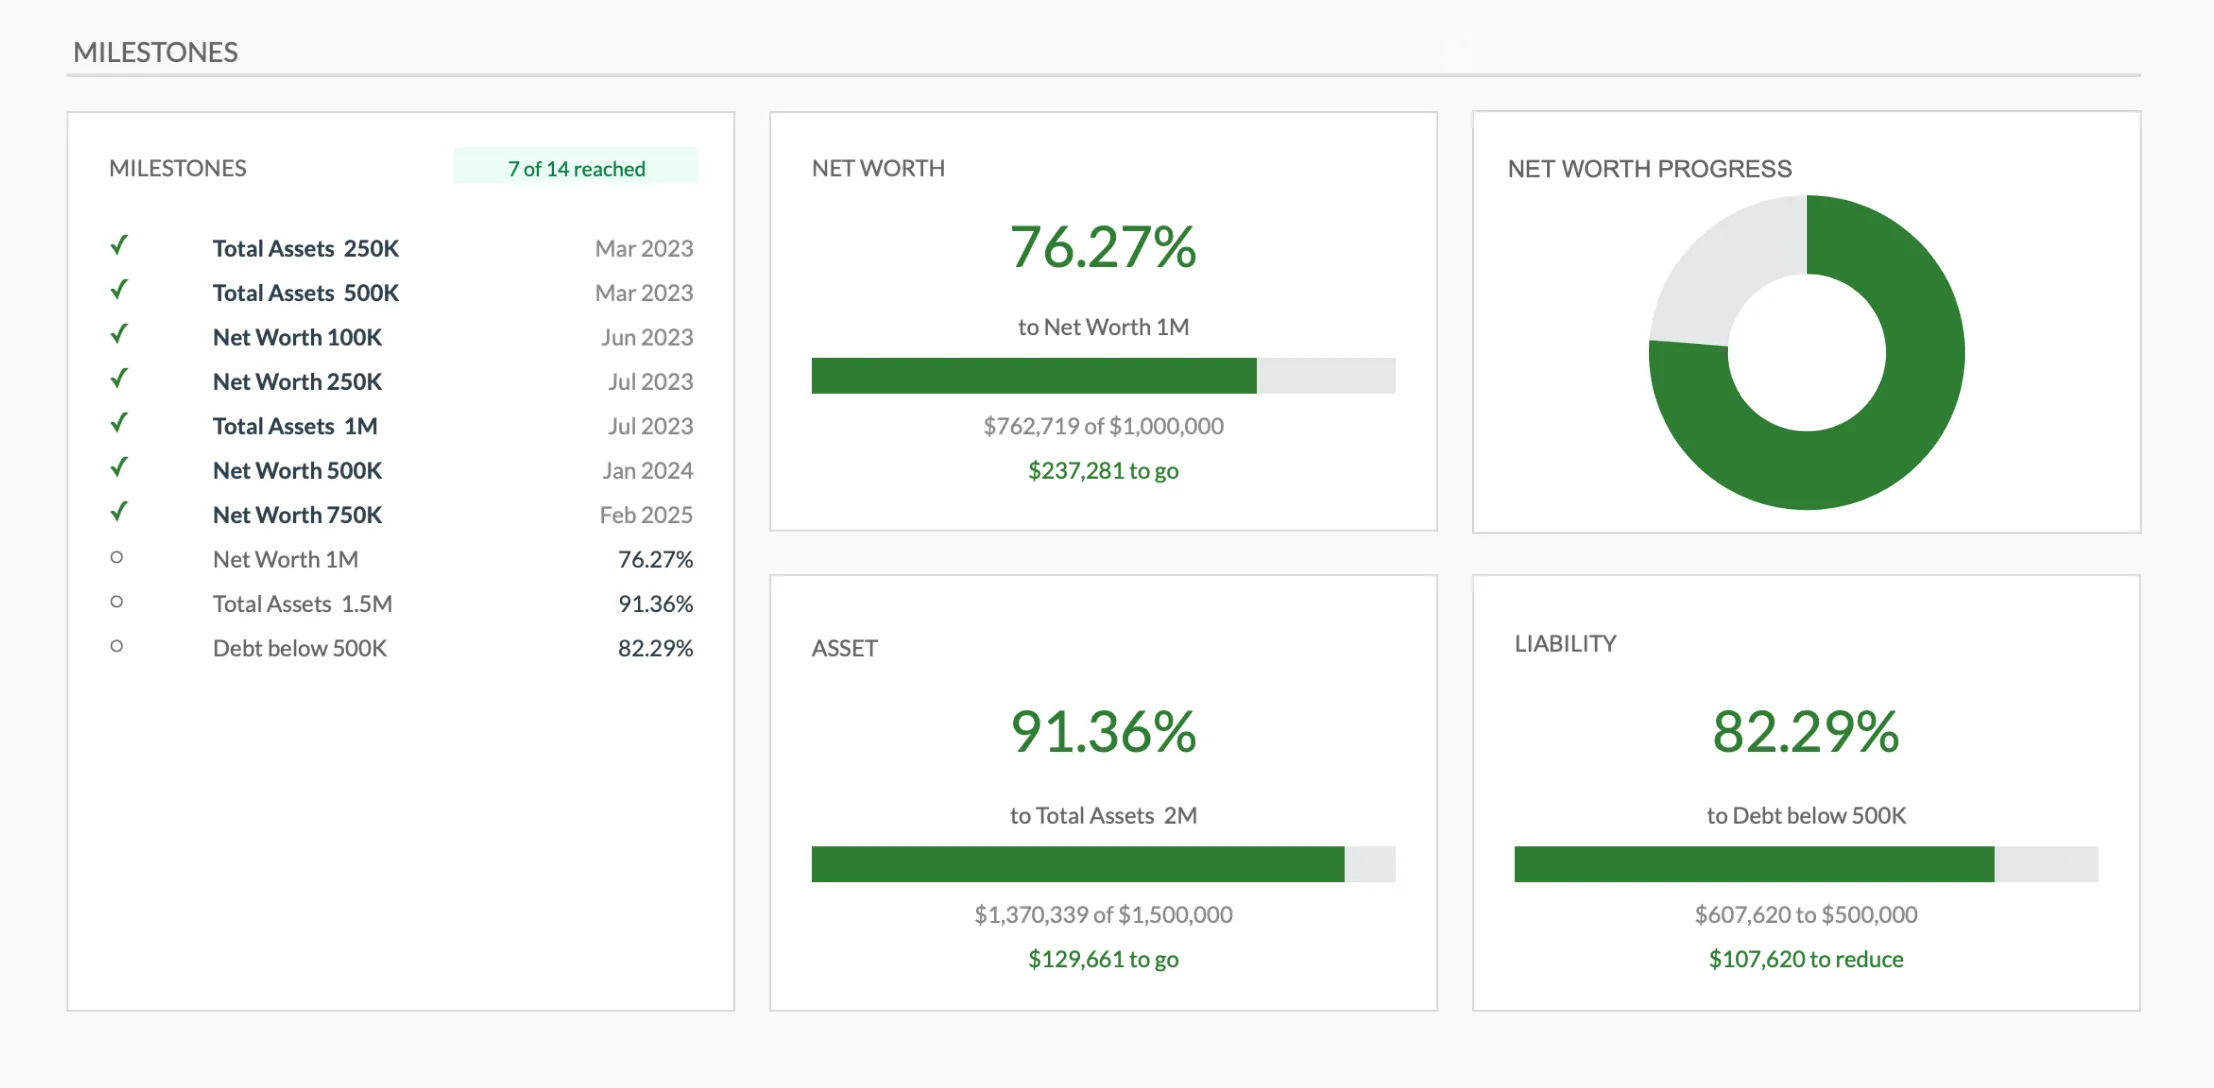
The Milestones dashboard in the Premium Net Worth Tracker records the date each milestone was reached and tracks progress toward the next one.
Related
Frequently asked questions
What if I'm behind these milestones?
Trajectory matters more than matching arbitrary timelines. Improvement from where you started is the meaningful measure.
Does home equity count?
Yes. Include home value minus mortgage balance. Some people also track liquid net worth separately to understand accessible assets.
Can I include retirement accounts?
Yes. Assets are assets, even with early withdrawal penalties. Include 401(k)s and IRAs at their current value.
What if I drop back below a milestone I already passed?
It happens, through market drops, emergencies or a change in circumstances. The number moving down doesn't erase the saving that got you there, and the same contributions carry you back across it.
How do these milestones relate to Fidelity's retirement benchmarks?
Fidelity's 1x-salary-by-30 and 3x-by-40 figures count retirement accounts only. Milestones 3, 5 and 7 here use the same multiples but measure total net worth, which includes home equity, cash and taxable investments alongside retirement balances, so the total-net-worth version tends to arrive sooner than the retirement-only one.
Does a higher income make these milestones easier or harder to reach?
Both, in different ways. Higher income leaves more room to save after essentials, but the income-multiple milestones (1x, 2x, 3x) also move the target up as pay rises, so a large raise can push the next multiple further away even as the dollar total climbs.
Sources
- How much do I need to retire? - Fidelity Investments
About this article
Retirement milestones checked against Fidelity's age-based savings guidelines (1x salary by 30, 3x by 40, 6x by 50, 8x by 60) Template capabilities checked on 2026-09-10 against the shipped Premium Net Worth Tracker Google Sheet (Summary, Assets, Liabilities, Milestones and Setup tabs) Last reviewed September 2026.