
Median US household net worth runs from about $39,000 under age 35 to roughly $410,000 at ages 65 to 74, based on the Federal Reserve's 2022 Survey of Consumer Finances. Your percentile is the share of households your age worth less than you: the 50th is the exact middle, the 90th is the top 10%. The average sits four to five times higher than the median because ultra-wealthy households pull it up, so the median is the more honest benchmark.
Percentile calculators are popular for a reason. Knowing where you fall compared to others your age provides context that a raw number alone cannot.
The Net Worth Percentile Calculator shows your ranking instantly based on Federal Reserve data. No signup required.
How Percentiles Work
A percentile is not a grade. Being at the 40th percentile does not mean you are failing - it means 40% of people in your age group have a lower net worth than you.
- 25th percentile - one in four people have less
- 50th percentile (median) - the exact middle
- 75th percentile - only one in four have more
- 90th percentile - top 10% of your age group
Why People Check Their Percentile
Curiosity about where you stand financially is common, and it says nothing about your priorities. Most people looking up net worth percentiles are doing one of four things: testing a gut feeling that they are ahead or behind, gathering context before a decision such as retirement or a home purchase, processing a life change like a new job, an inheritance or a divorce, or simply satisfying curiosity about the wider population.
None of those motivations needs justifying. The data is just data. What it means for you depends on your circumstances and your goals.
Net Worth by Age Group
Data from the Federal Reserve Survey of Consumer Finances (SCF). These figures represent household net worth in the United States.
| Age Group | 25th Percentile | Median (50th) | 75th Percentile | 90th Percentile |
|---|---|---|---|---|
| Under 35 | $3,900 | $39,000 | $152,600 | $372,200 |
| 35 - 44 | $19,100 | $135,600 | $415,000 | $1,049,700 |
| 45 - 54 | $51,300 | $247,200 | $800,000 | $1,973,600 |
| 55 - 64 | $81,800 | $364,500 | $1,122,200 | $2,960,900 |
| 65 - 74 | $87,000 | $409,900 | $1,176,100 | $2,997,400 |
| 75+ | $93,600 | $335,600 | $975,200 | $2,699,000 |
A few things stand out. The jump between the 50th and 75th percentile is large in every age group. And net worth peaks in the 65-74 bracket before declining as retirees draw down assets.
These figures come from the 2022 SCF, the most recent survey published, and are stated in 2022 dollars. Results from the 2025 survey are not expected until late 2026.
Why Median Matters More Than Average
Averages get pulled up by outliers. If nine people each hold $50,000 and one holds $10 million, the average across the ten is $1,045,000 while the median stays at $50,000. Across all US households the average net worth sits above $1 million, which is why that figure looks so far removed from most people’s experience.
| Age Group | Median | Average | Gap |
|---|---|---|---|
| Under 35 | $39,000 | $183,500 | 4.7x |
| 35 - 44 | $135,600 | $549,600 | 4.1x |
| 45 - 54 | $247,200 | $975,800 | 3.9x |
| 55 - 64 | $364,500 | $1,566,900 | 4.3x |
| 65 - 74 | $409,900 | $1,794,600 | 4.4x |
| 75+ | $335,600 | $1,624,100 | 4.8x |
The average runs roughly 4 to 5 times the median in every bracket. That gap exists because a small number of ultra-wealthy households skew the average upward. The median reflects what a typical household actually looks like.
Comparing yourself to the average is comparing yourself to a number inflated by billionaires. The median is the more honest benchmark.
How to Calculate Your Net Worth
Net worth is straightforward: assets minus liabilities.
Assets include:
- Bank accounts (checking, savings)
- Investment accounts (brokerage, 401k, IRA, Roth, HSA)
- Real estate (market value)
- Vehicles (current value, not purchase price)
- Cash value of any permanent life insurance policy
- Other assets (business equity, crypto, valuable property)
Liabilities include:
- Mortgage balance
- Student loans
- Auto loans
- Credit card debt
- Home equity lines of credit
- Other debts (personal loans, medical debt)
What does not count: income and credit scores. Net worth is a snapshot of what you own minus what you owe on a given day, so a large salary paired with heavy spending and debt can still produce a low figure, and a modest salary paired with steady saving can produce a high one.
The Net Worth Calculator walks through each category, and building the same statement in Google Sheets keeps the math updating on its own. Once you have your total, the Net Worth Percentile Calculator shows where it falls for your age. Some people also track liquid net worth separately, setting real estate aside to see what could actually be reached quickly.
What Your Percentile Does and Does Not Tell You
It provides context. A net worth of $200,000 means something very different at 28 than at 58. Percentiles add that context.
It does not account for cost of living. $300,000 in net worth goes much further in rural Tennessee than in San Francisco. The data is national, though the average net worth by state figures show how far the regional gaps run.
It is a snapshot, not a trajectory. Someone at the 40th percentile with a high savings rate and no debt is in a fundamentally different position than someone at the 60th percentile with a house they are struggling to afford.
It can become an unhealthy obsession. Useful as an occasional check-in. Less useful as a daily fixation. Financial progress is better measured against your own goals than against strangers.
Factors That Affect Where You Fall
Percentiles compress very different situations into a single figure. A few factors do most of the work behind any given ranking.
Position inside your own bracket. A 34-year-old medical resident carrying $300,000 of student debt and a 34-year-old who has been working since 18 sit in the same row of the table with almost nothing else in common.
Savings rate, not just income. A higher income creates more room to build wealth, but the share of income kept tends to matter more over time. Some households earning $250,000 hold less net worth than households earning $80,000 who save consistently.
Inheritance and family support. The SCF does not separate inherited wealth from earned wealth. Two households at the 90th percentile can have arrived there by completely different routes.
Market timing. People who bought a home or invested heavily before a long run of appreciation look very different on paper from people who entered near a peak, and a good deal of that comes down to when they happened to be buying.
Debt decisions. Student loans and mortgages reduce net worth directly. Skipping college debt produces an early head start on the net worth line while often lowering lifetime earnings, a trade-off the calculation cannot show.
For a generational view of how these factors played out over time, the US Net Worth by Generation analysis compares Boomers, Gen X and Millennials at the same ages.
Tracking Your Number Over Time
A percentile is a snapshot. A series of snapshots taken over months and years becomes a trend, and the trend usually says more than any comparison with strangers. It shows whether net worth is growing, flat or shrinking, and it makes the effect of paying down debt or lifting a savings rate visible in a way a single reading cannot.
Monthly updates give the clearest view of the trend, though short-term market noise shows up in every reading. Quarterly updates keep enough data points to see direction without reacting to every move. Annual updates are the lightest option and still enough to see the shape of several years. The work itself is short either way: list the accounts, record current balances, subtract the debts. How often to run it is mostly a question of how much short-term market noise you want to sit through.
The Net Worth Tracker runs that calculation automatically and charts the change month by month. The Financial Planning Template tracks net worth against a goal figure, one of eight targets it holds, and projects the number forward to a chosen end year from six assumptions: income, expenses, asset growth, asset yield, debt change and inflation.
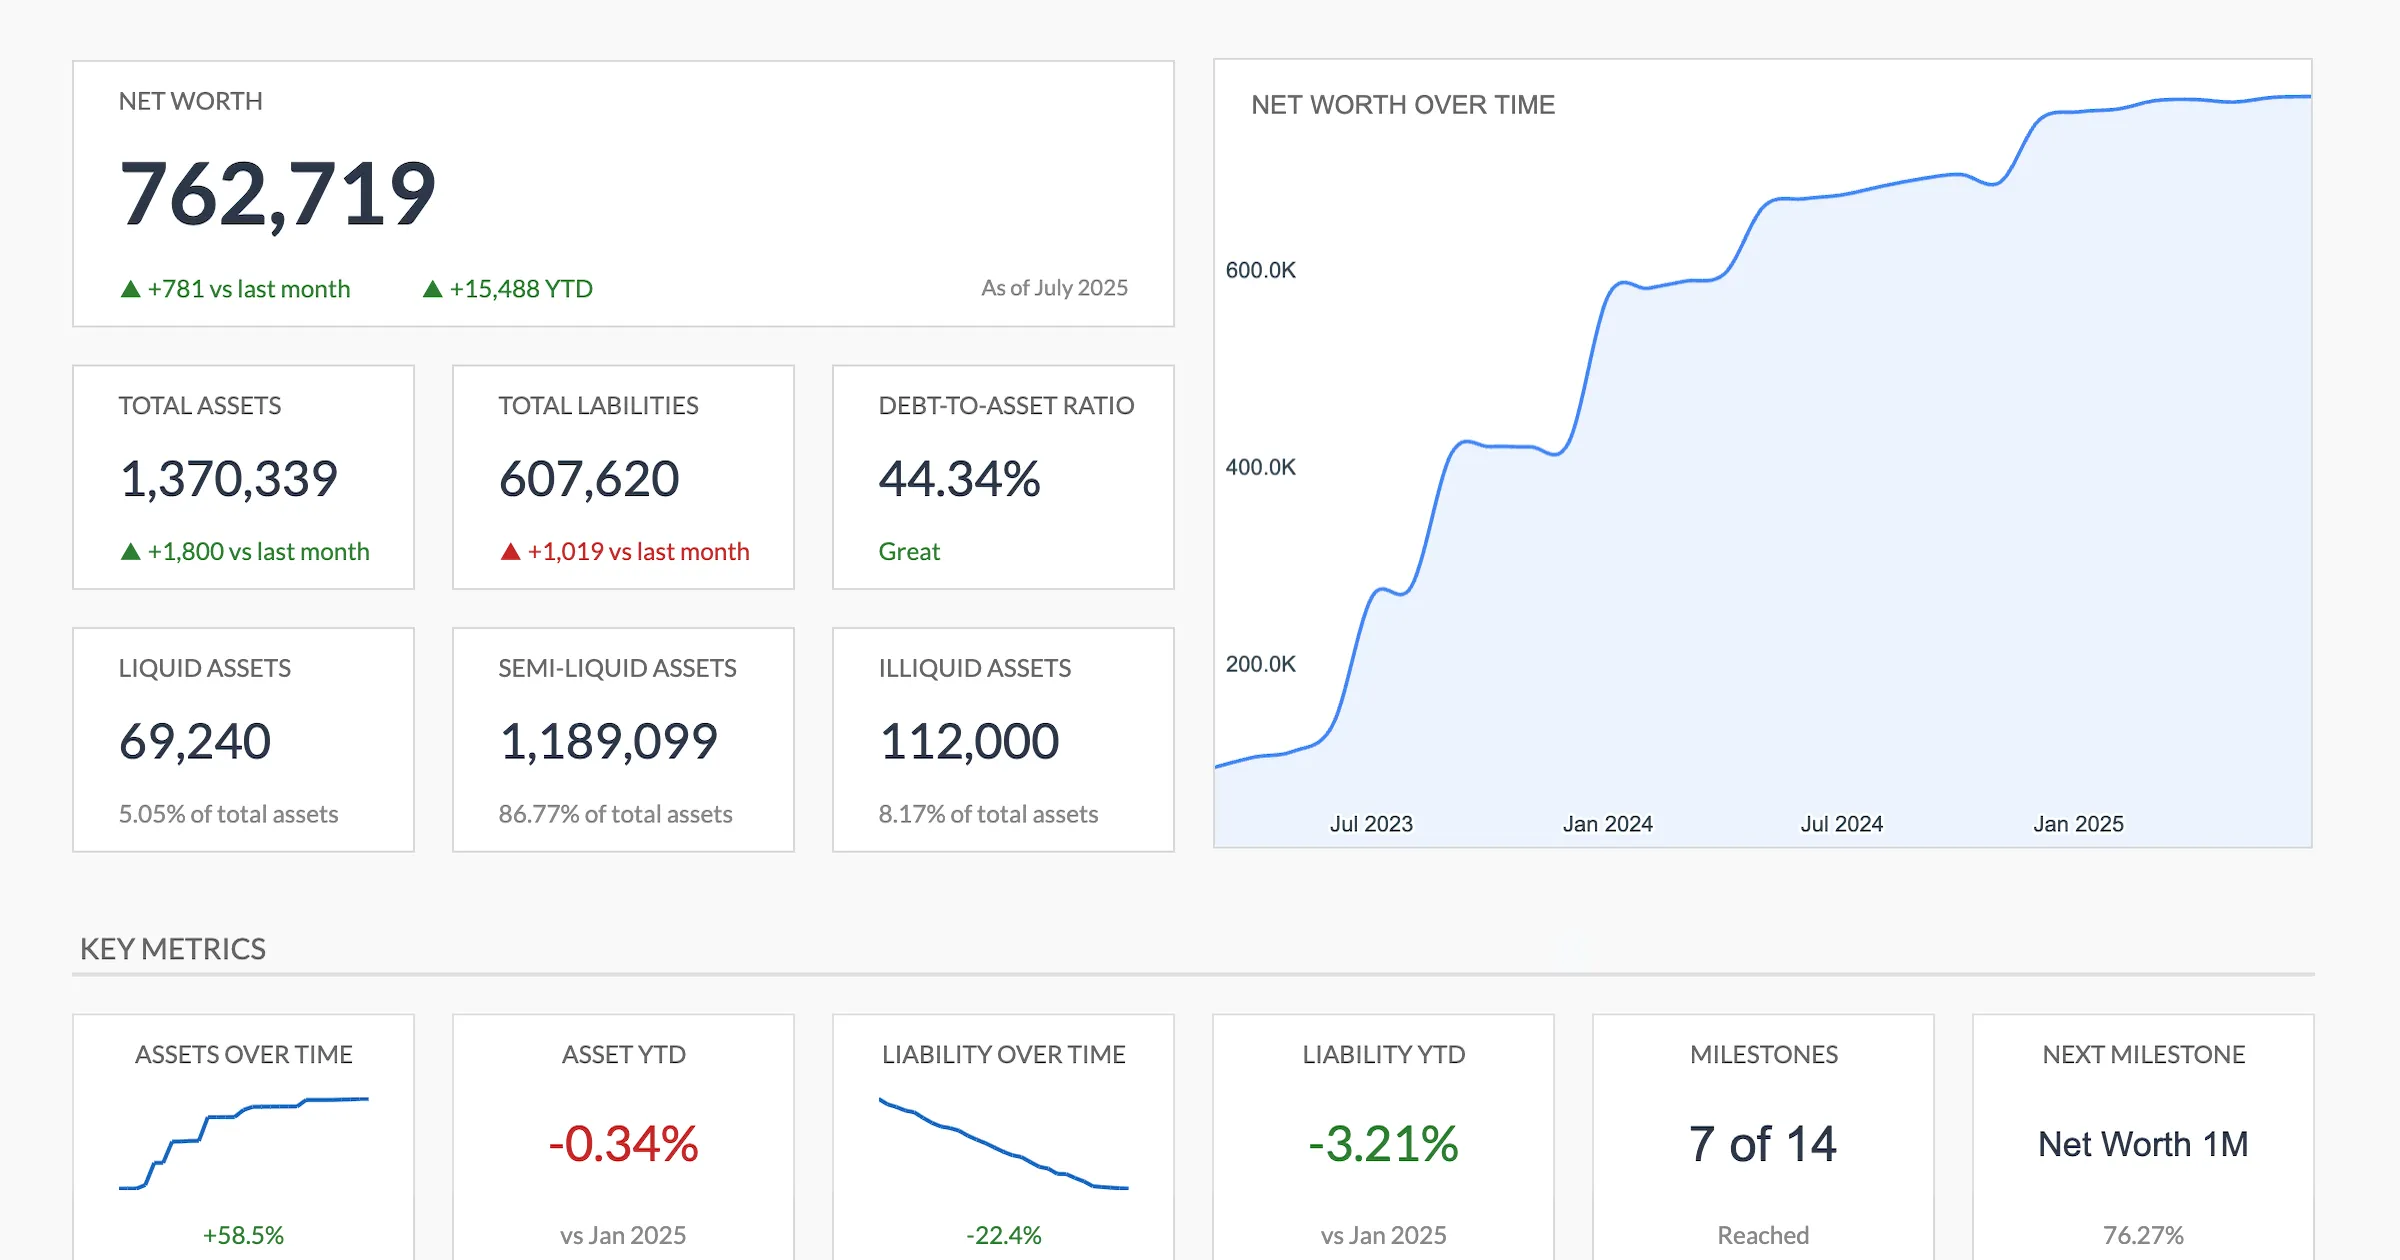 The Net Worth Tracker (Premium) turns each monthly reading into a running trend line, alongside the debt-to-asset ratio and milestone progress.
The Data Source
The Federal Reserve’s Survey of Consumer Finances is conducted every three years. It surveys roughly 4,600 families and is widely considered the most comprehensive source of U.S. household wealth data. The most recent survey available is from 2022; results from the 2025 survey are not expected until late 2026.
Worth noting: the data is partly self-reported, which means some inaccuracy is inevitable. It also covers only U.S. households - international comparisons require different data sources.
Percentiles are useful context for reading a net worth figure, and that is all they are. The number that tends to matter most is not where you rank today but whether the figure is higher than it was last year.
Related
Frequently asked questions
What is a net worth percentile?
It tells you what percentage of people in your age group have a lower net worth than you. Being at the 70th percentile means you have more net worth than roughly 70% of people your age.
Where does the percentile data come from?
The Federal Reserve's Survey of Consumer Finances (SCF), conducted every three years. It is considered the most reliable source for U.S. household wealth data.
Does net worth include my home?
Yes. Home equity, the market value minus the remaining mortgage, counts. Some people also track liquid net worth separately, which excludes real estate.
Why is the average so much higher than the median?
Ultra-wealthy households pull the average up dramatically. The top 1% holds a disproportionate share of total wealth. The median, where half are above and half below, gives a more realistic picture of typical households.
How often should I check my percentile?
Once or twice a year is plenty. Net worth changes gradually for most people. Checking more often tends to create unnecessary anxiety around short-term market fluctuations.
What percentile is a net worth of $500,000?
It depends on your age. For someone under 35 that sits above the 90th percentile. For someone aged 55 to 64 it falls between the 50th and 75th percentile.
Does net worth include retirement accounts?
Yes. A 401(k), IRA, Roth IRA and other retirement balances are all part of total net worth.
Why does net worth drop after age 75?
Retirees are drawing down assets to fund living expenses, so balances fall. The pattern is expected and is not by itself a sign of financial trouble.
What if I have a negative net worth?
A negative net worth means debts exceed assets. It is common among younger adults carrying student loans, and it describes a point in time rather than a permanent position.
Sources
- Survey of Consumer Finances (SCF) - Federal Reserve
- Changes in U.S. Family Finances from 2019 to 2022: Evidence from the Survey of Consumer Finances - Federal Reserve
About this article
Percentile points are computed from the Federal Reserve's SCF 2022 public summary extract (weighted); medians and means are the Fed's published figures, and the table matches the site's Net Worth Percentile Calculator exactly. Median and mean net worth by age checked against the Federal Reserve's 2022 Survey of Consumer Finances bulletin, Changes in U.S. Family Finances from 2019 to 2022. All net worth figures are stated in 2022 dollars, the most recent SCF wave published. Template sheets, inputs and outputs checked on 2026-09-10 against the shipped Net Worth Tracker Google Sheet (Summary, Assets, Liabilities, Milestones, Setup tabs) and the Financial Planning Google Sheet (Summary, Goals, Assets, Debt, Cashflow, Projection tabs); percentile and median figures checked against the site's Net Worth Percentile Calculator dataset (Federal Reserve SCF 2022). Last reviewed September 2026.