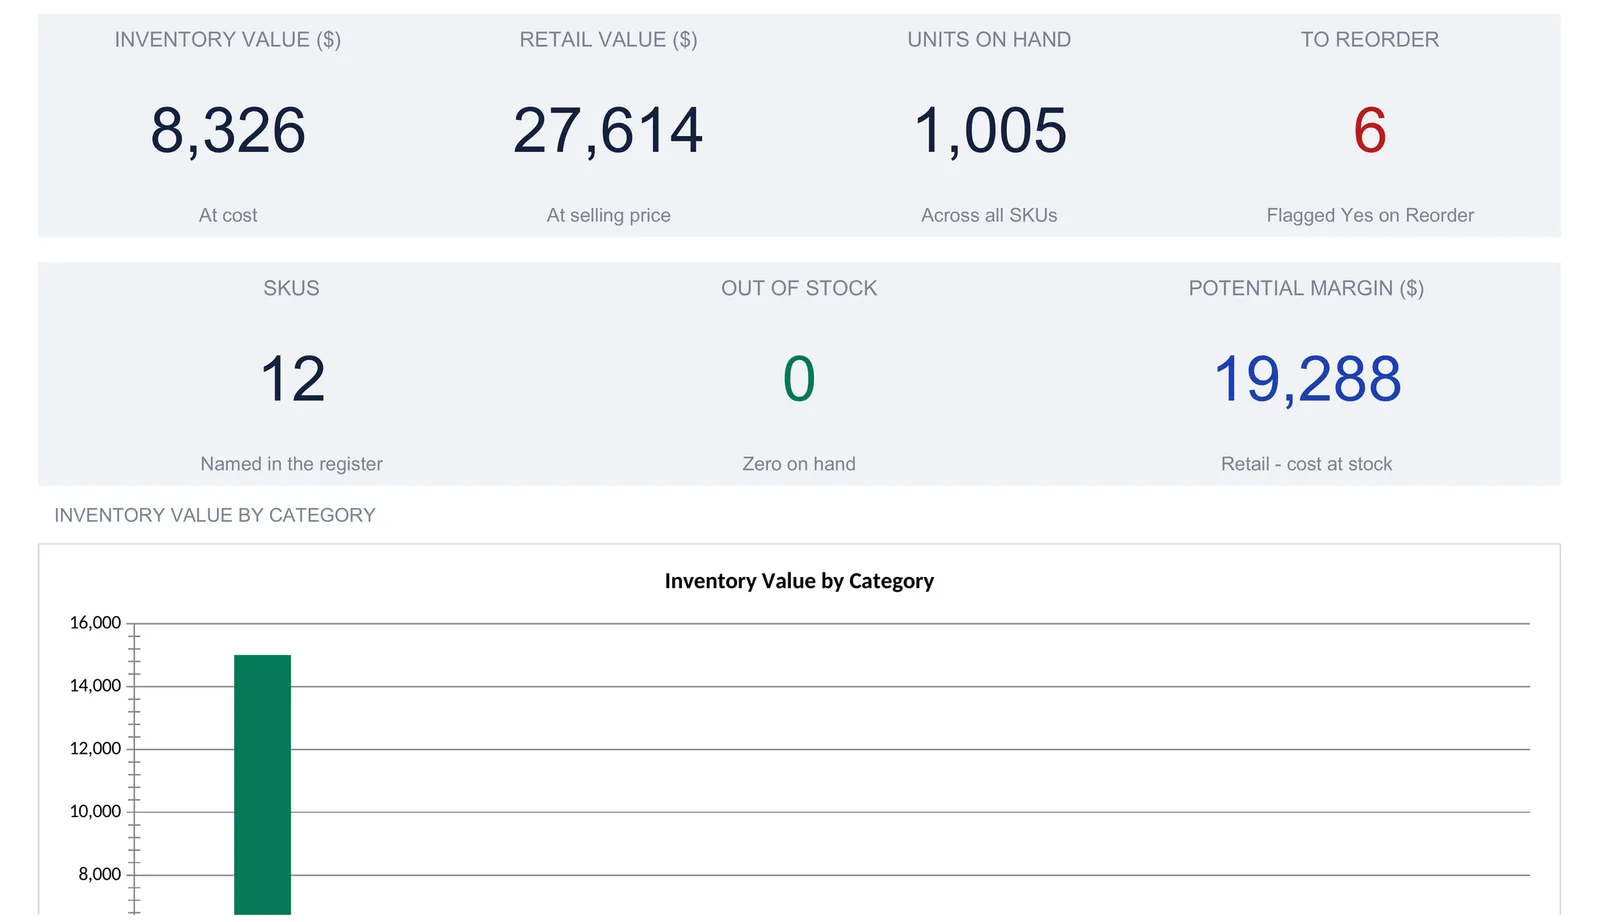
An inventory spreadsheet keeps every stock change in one movements log and derives the rest from it: on-hand quantity per SKU, reorder-point alerts, and inventory valuation by category. This walkthrough builds the structure sheet by sheet using a 12-SKU sample catalog worth $8,326 at cost and $27,614 at retail, with 6 SKUs flagged to reorder. Our Inventory Management Spreadsheet Template ($29) ships the same structure ready-made for Excel and Google Sheets.
Ask a small retailer how many units of their best seller are in the stockroom right now and the honest answer is often a guess followed by a walk to go count. The money answer is worse. Few owners can say what the whole shelf is worth at cost, which items are about to run out, or how much profit is sitting in stock waiting to sell. Point-of-sale systems record what left the building, and purchase invoices record what came in, but the running balance between the two, item by item, usually lives in someone’s head. A spreadsheet is good at holding exactly that balance.
The structure comes down to four pieces: a catalog of items with a cost and a price, a running log of every stock change, the on-hand quantity that falls out of the two, and the value and reorder signals built on top. The examples below come from our Inventory Management Spreadsheet Template ($29), which ships the whole thing ready-made for Excel and Google Sheets. The layout is reproducible by hand if you would rather build your own, and the walkthrough follows the order the template’s own How to Use sheet lays out.
What an inventory spreadsheet has to hold
Strip away the warehouse software and there are only four kinds of data behind stock control:
- A SKU catalog. One row per item, each with a code, a name, a category, a unit cost, a selling price, and the opening quantity you started counting from. This is the master list everything else refers back to.
- A movements log. Every time stock arrives, ships, or gets corrected, one line records the date, the SKU, the type of change, and the quantity. This is the raw material for the on-hand count.
- Derived stock levels. On hand, stock value, and status per SKU. These are calculations, not entries. In a well-built sheet nobody ever types an on-hand number.
- Signals and rollups. Which items to reorder and how much to buy, the value of the stock by category, and a dashboard that states the whole position in a handful of numbers.
The template gives each of these its own sheet. Settings holds the business constants, Inventory is the catalog, Movements is the log, Reorder and Valuation are the two rollups, and a Dashboard sits on top with a How to Use sheet carrying the instructions. Seven sheets in total, and only three of them are places you ever type.
Set the constants first: the Settings sheet
Three fields on the Settings sheet apply across the whole workbook, so they come first. The business name prints in the header of the reporting sheets. The valuation date, Aug 2026 in the sample, sits in those same headers, labelling the point in time the stock position reflects. And the currency symbol drives display everywhere.

The currency selector carries 35 symbols, from the dollar and euro through the rupee, real, and zloty. Choosing one relabels every money column header and every money KPI across the workbook. It relabels only. The numbers themselves never convert, because a symbol is a label and not an exchange rate. The How to Use sheet spells this out so nobody expects a currency change to restate their stock in another currency.
That is the entire Settings sheet. Everything else that shapes the numbers, the per-item cost, price, reorder point, and reorder quantity, lives on the Inventory sheet next to each SKU rather than as a global constant, because those genuinely differ from one item to the next.
Build the catalog: the Inventory sheet
The Inventory sheet is the SKU register, and it is where most of the setup work happens. Each row describes one item across a fixed set of columns. Eight of them are yours to fill: SKU code, name, category, unit cost, selling price, opening quantity, reorder point (ROP), and reorder quantity. Four more are computed and should never be typed: on hand, stock value, retail value, and a status flag.
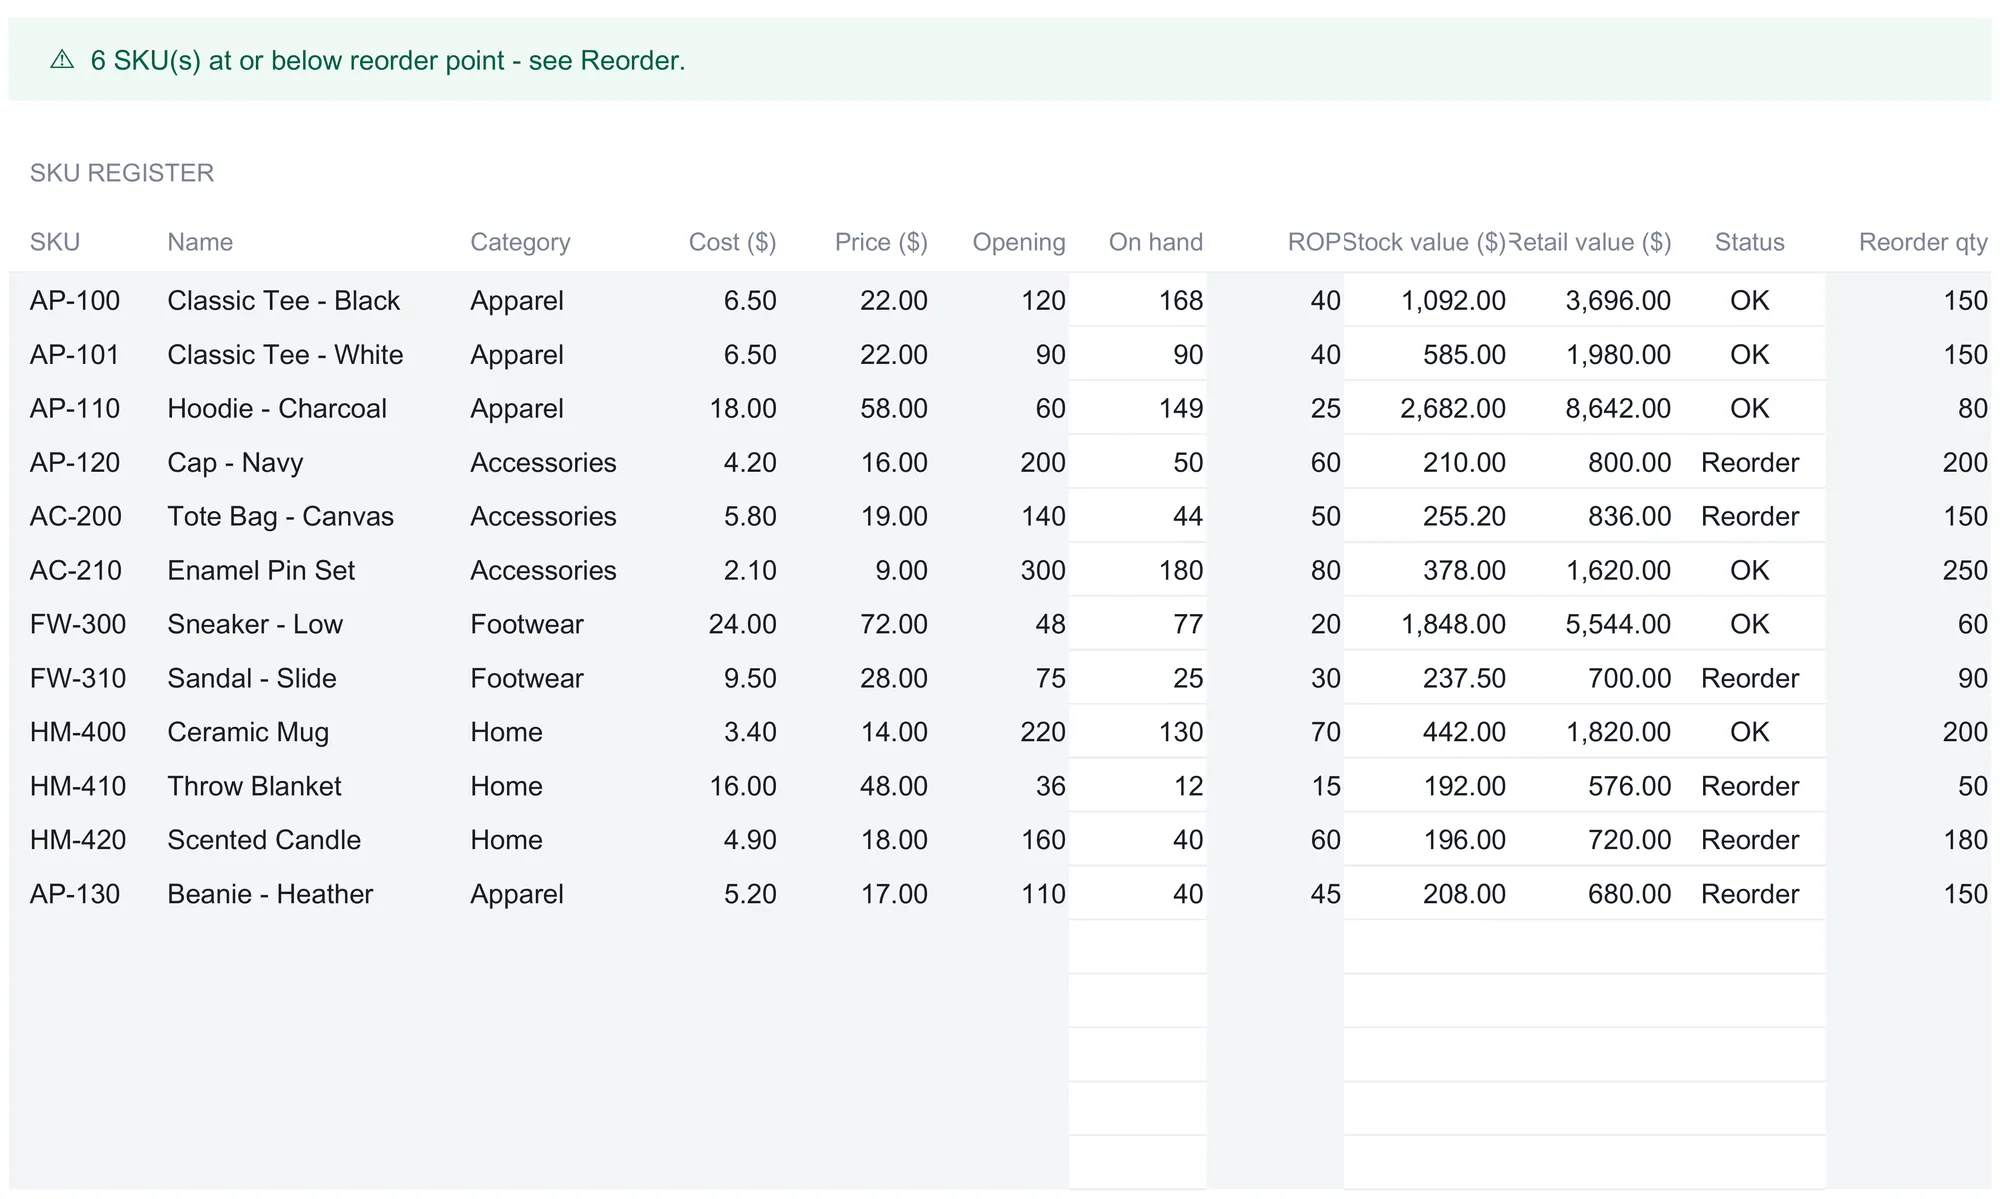
The sample catalog is a small apparel and homewares shop with 12 SKUs across four categories: Apparel, Accessories, Footwear, and Home. A Classic Tee costs $6.50 and sells for $22, a Charcoal Hoodie costs $18 and sells for $58, a pair of low sneakers costs $24 and sells for $72, and so on down to a $2.10 enamel pin set that retails at $9. The prices are ordinary, and that is the point: the arithmetic on top of them is what does the work.
The column that makes the sheet live is On hand. It is a formula, not a figure. For each SKU it takes the opening quantity and then reaches into the Movements log to add everything received, subtract everything sold, and apply every adjustment recorded against that SKU code. In plain terms:
On hand = opening + received - sold + adjustments
Take the first item, the Black Classic Tee (SKU AP-100). It opened at 120 units. The Movements log holds three entries for it: a sale of 64, a receipt of 150, and a later sale of 38. So on hand is 120 + 150 - 64 - 38 = 168 units. The sheet shows 168 without anyone counting. Its stock value is then on hand times unit cost, 168 × $6.50 = $1,092, and its retail value is on hand times price, 168 × $22 = $3,696. Both update the instant a movement changes.
The Status column reads the on-hand number against the reorder point. If on hand is above the ROP it shows OK. If it is at or below the ROP it shows Reorder. If it hits zero it shows Out. The Cap - Navy (SKU AP-120) is the clear case: it opened at 200, sold 150 in one order, and now sits at 50 against a reorder point of 60, so its status reads Reorder. A short status line at the top of the sheet counts the flags and, in the sample, reads that 6 SKUs are at or below their reorder point.
Two design habits here are worth copying into any hand-built version. First, the derived columns carry an IF guard so a blank row stays blank instead of showing a stray zero or an error. Second, the 12 spare rows below the catalog are already wired: name a new SKU on the first free row and it is instantly inside the totals, the Reorder report, and the Valuation, with no formula to drag and no range to extend. The totals row at the foot already reads 1,005 units on hand, $8,325.70 of stock at cost, and $27,614 at retail across the 12 items.
Log every stock change: the Movements sheet
The Movements sheet is the only place stock levels change, and it is deliberately plain. Four columns: date, SKU, type, and quantity. Type is one of three words, and the whole model rests on them:
- Receive adds stock, for a delivery from a supplier.
- Sell removes stock, for an order that ships.
- Adjust applies a correction, positive or negative, for a stock count, a breakage, or a write-off.
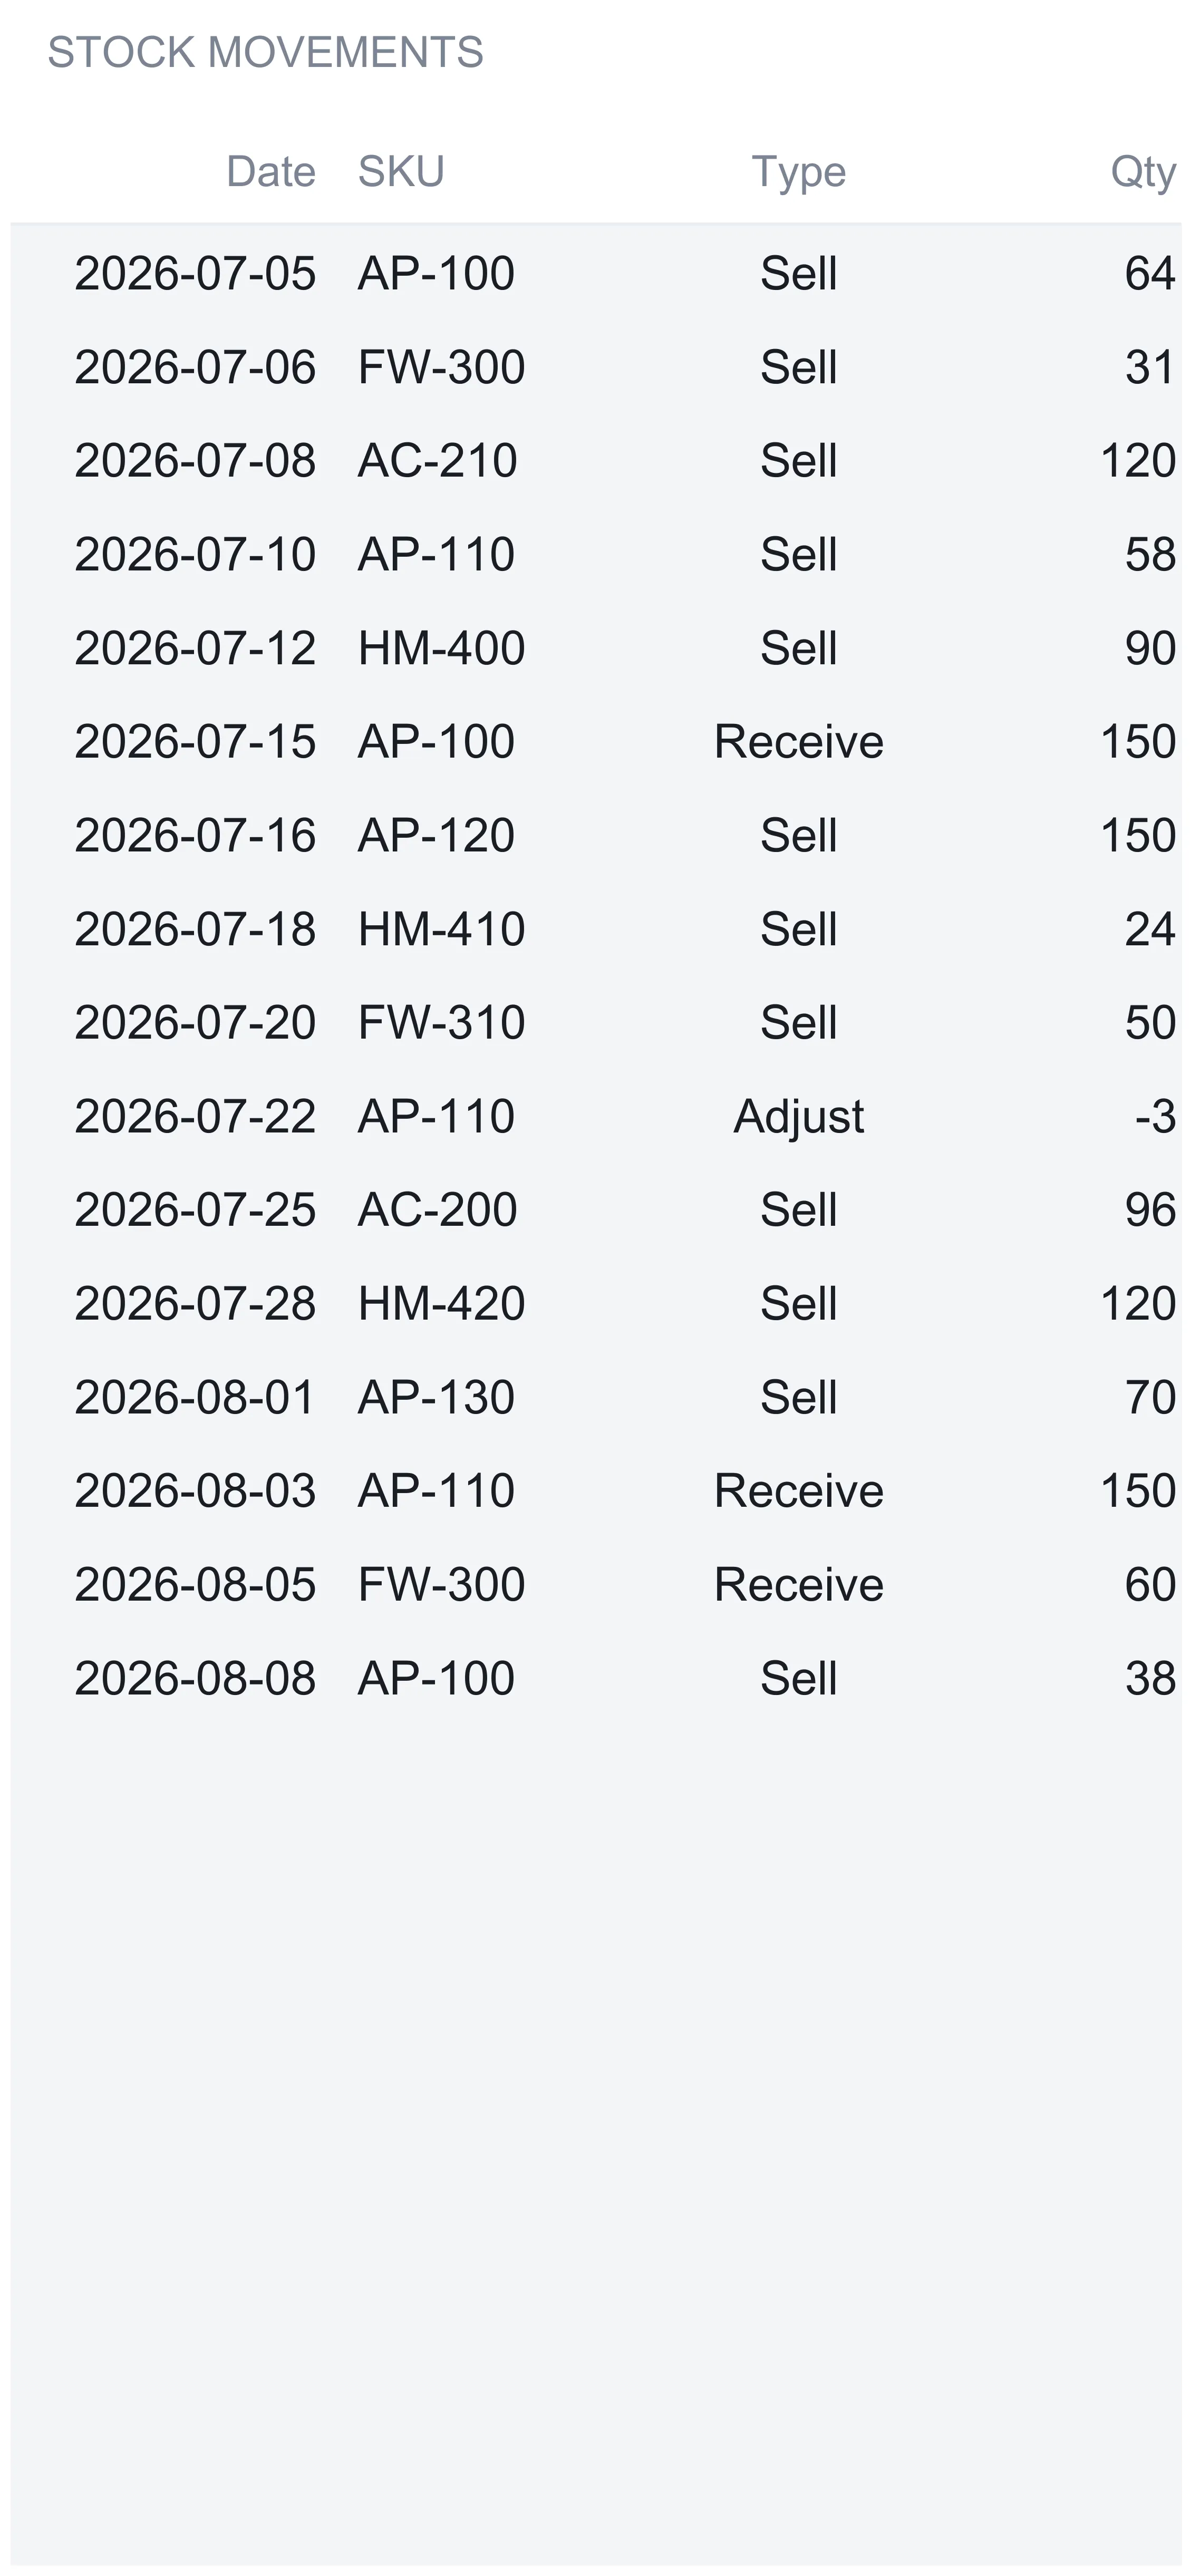
The sample log runs 16 movements from early July to early August 2026: twelve sales, three restock receipts of 150, 150, and 60 units, and a single adjustment. The adjustment is the one to study, because it shows how corrections work. The Charcoal Hoodie (SKU AP-110) opened at 60. On 10 July it sold 58, on 22 July an Adjust entry of -3 wrote off three damaged units, and on 3 August a receipt of 150 arrived. Its on hand is therefore 60 - 58 - 3 + 150 = 149, and that is what the Inventory sheet shows. A negative Adjust is how shrinkage, theft, or write-offs enter the numbers honestly, rather than being quietly buried in the opening figure.
One rule keeps the log reliable: the SKU code on each movement must match a code on the Inventory sheet exactly. A typo routes the quantity to nowhere, so the on-hand count silently drifts. The template flags this convention on the sheet itself. Like the catalog, the log ships with spare capacity: 44 blank rows sit below the sample data, each already counted in every SKU’s on-hand figure, so the next delivery or sale is the next free line.
What the log does not do is fill itself. There is no connection to a point-of-sale system and no automatic import, so every movement is four typed cells. For a shop with a handful of restocks and a daily sales summary that is a few minutes of entry. For a high-volume operation moving thousands of order lines a day it is real work, which is what dedicated inventory software exists to remove. The trade is the familiar one: automation against transparency. A connected system suits a business that wants the data to arrive on its own; a spreadsheet suits one that wants to see every movement, change any formula, and keep the file on its own machine.
Know what to buy: the Reorder sheet
The Reorder sheet turns the status flags into a shopping list. It lists every SKU with its on-hand quantity, its reorder point, a plain Yes or No in a Reorder? column, and, for the ones that need it, a suggested order quantity and the cost of placing that order.
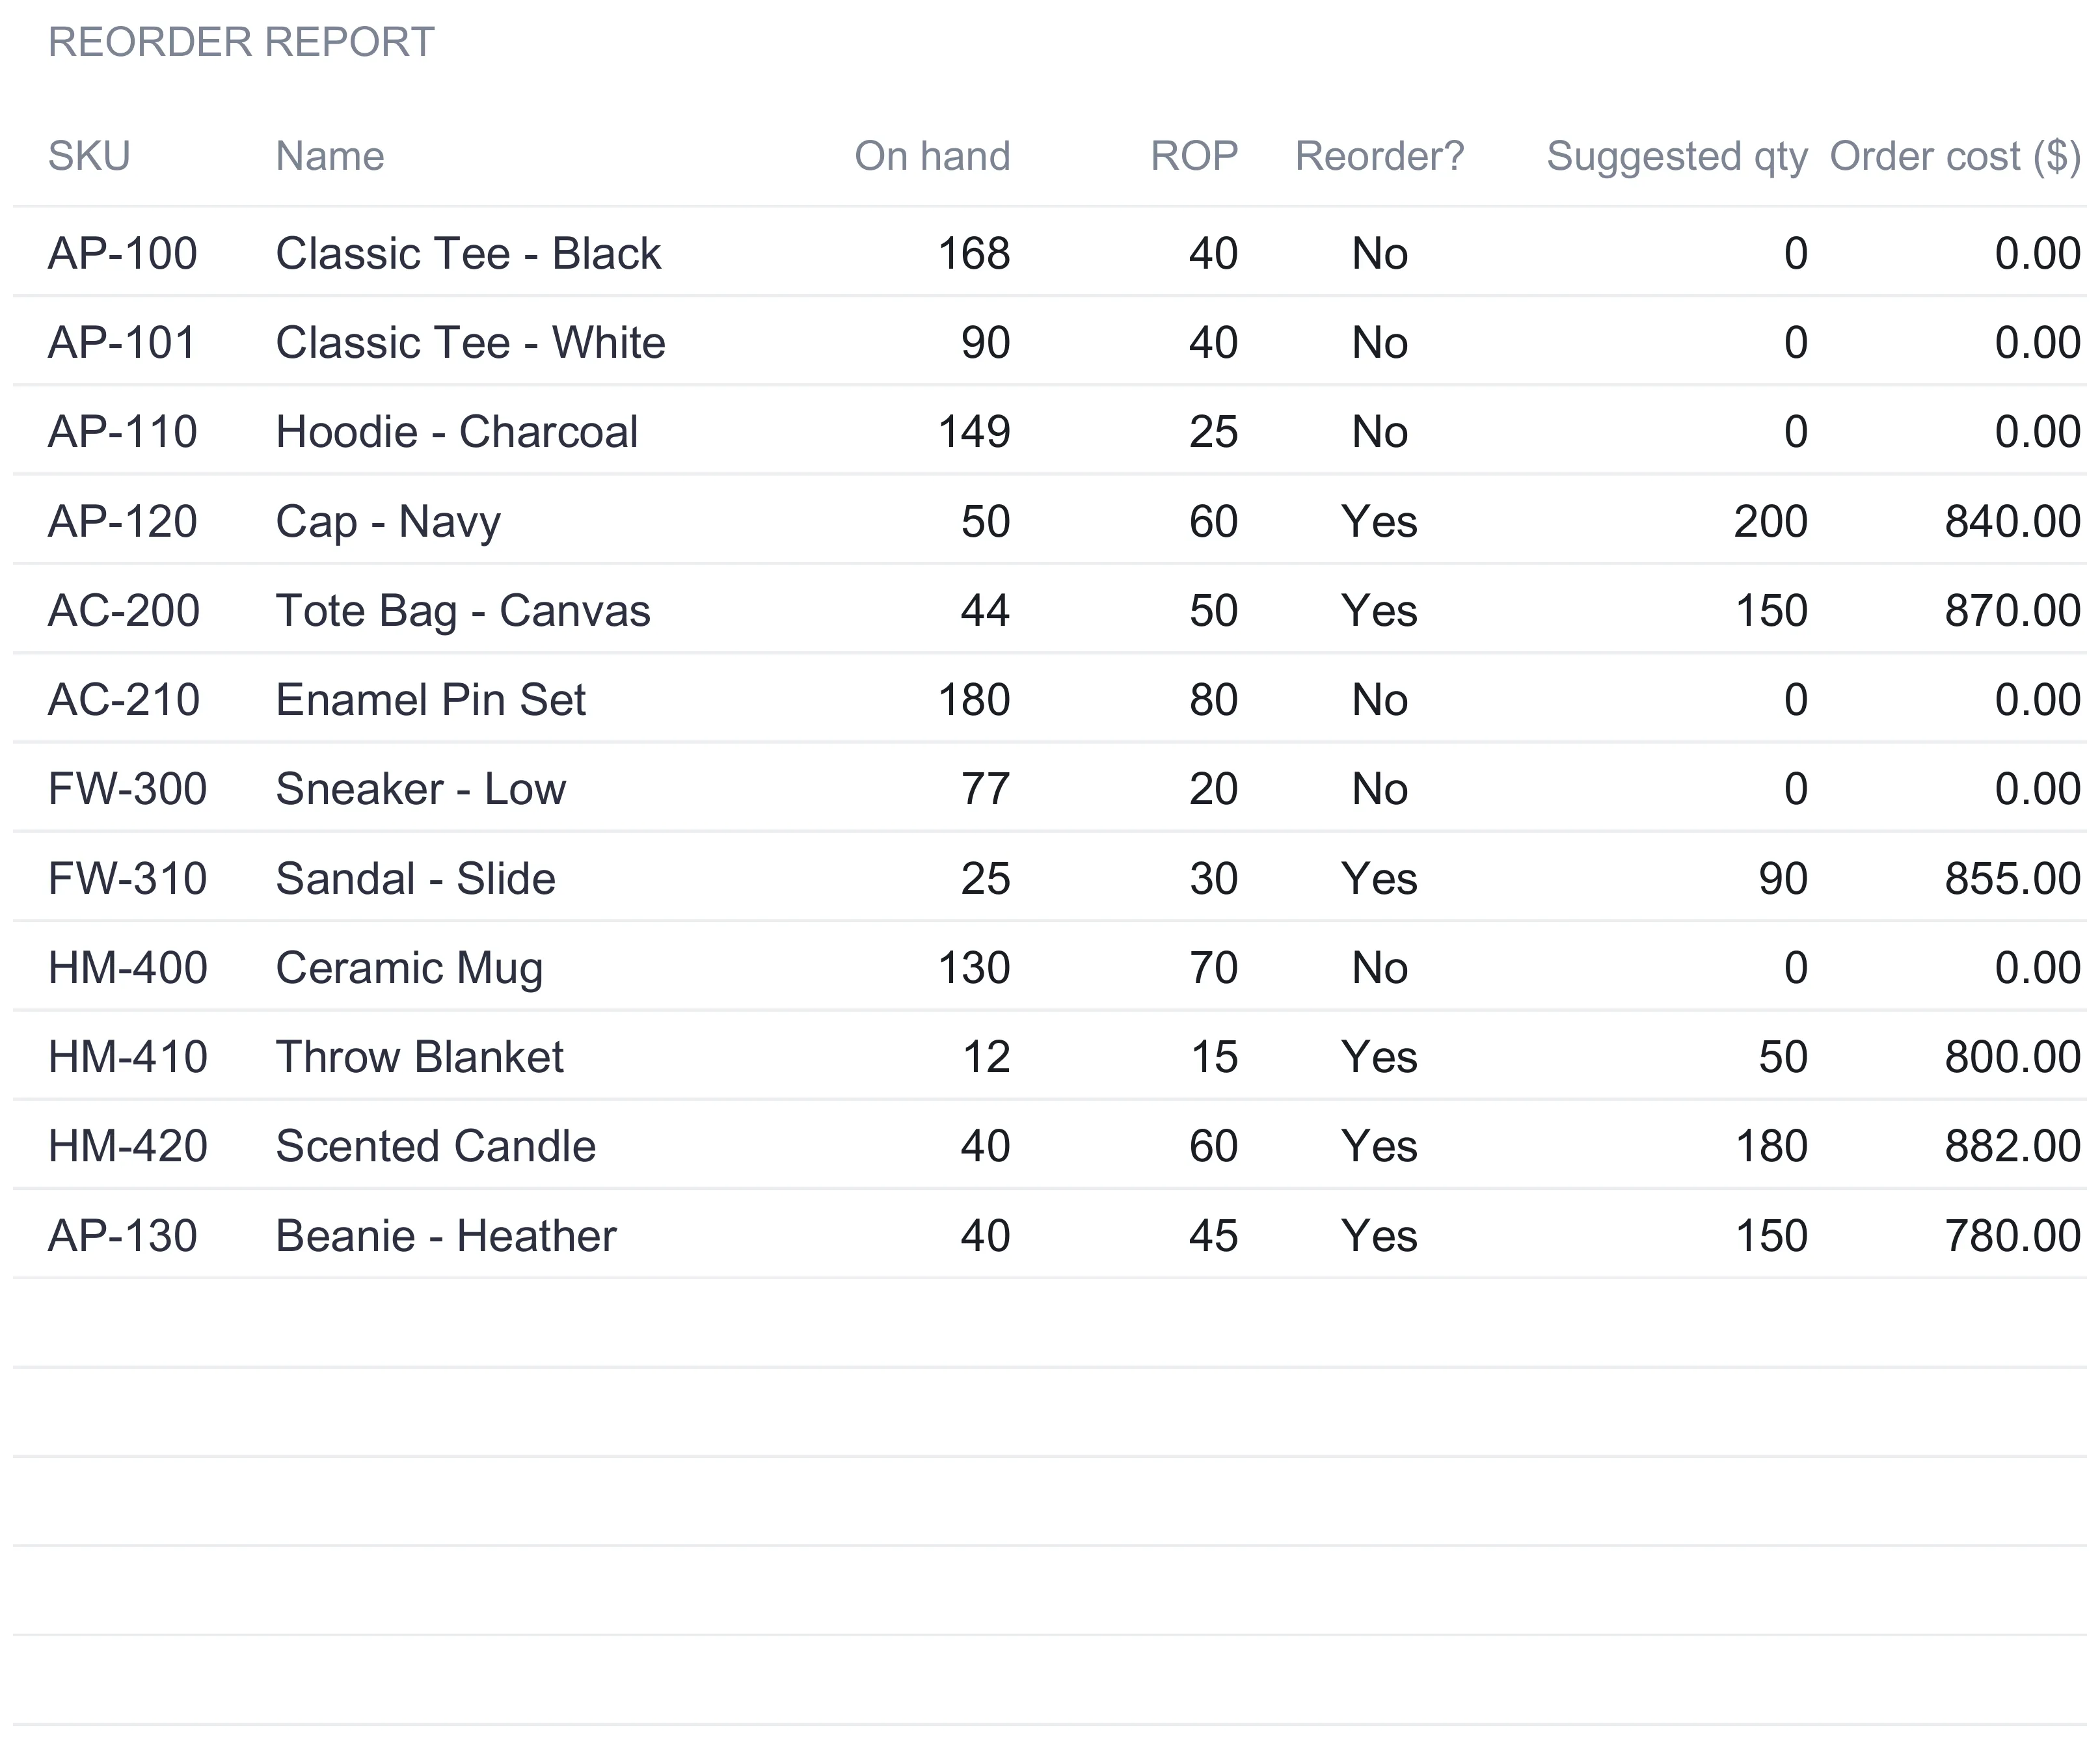
The logic is a direct read of the reorder point. Where on hand is at or below the ROP, the Reorder? column reads Yes and the suggested quantity pulls that SKU’s reorder quantity from the Inventory sheet. Where on hand is still above the ROP, it reads No and the suggested quantity is zero. The order cost is the suggested quantity times the unit cost, so the report also shows what the restock will cost before you place it.
Six of the sample’s twelve SKUs land on the list. The Cap - Navy sits at 50 against a reorder point of 60, so it flags Yes, suggests its standing reorder quantity of 200 units, and shows an order cost of 200 × $4.20 = $840. The Throw Blanket, down to 12 against an ROP of 15, suggests 50 units at a cost of $800. Add the Tote Bag, the Sandal, the Scented Candle, and the Heather Beanie, and the report totals a suggested 820 units for a combined order cost of $5,027. Because every figure traces back to the Inventory and Movements sheets, adjusting a reorder point or logging a fresh delivery reshuffles the list on its own.
The reorder point itself is a decision the template holds rather than makes. Setting it well is an operations judgment about how fast an item sells and how long a supplier takes to deliver. The sheet’s job is to watch each item against the number you choose and raise a hand the moment stock crosses it, which is precisely the check that is easy to miss when it lives only in memory.
Know what the stock is worth: the Valuation sheet
Where the Reorder sheet looks forward to the next order, the Valuation sheet looks at what is on the shelf right now and totals its worth by category. Each category gets four numbers: units on hand, cost value, retail value, and potential margin.
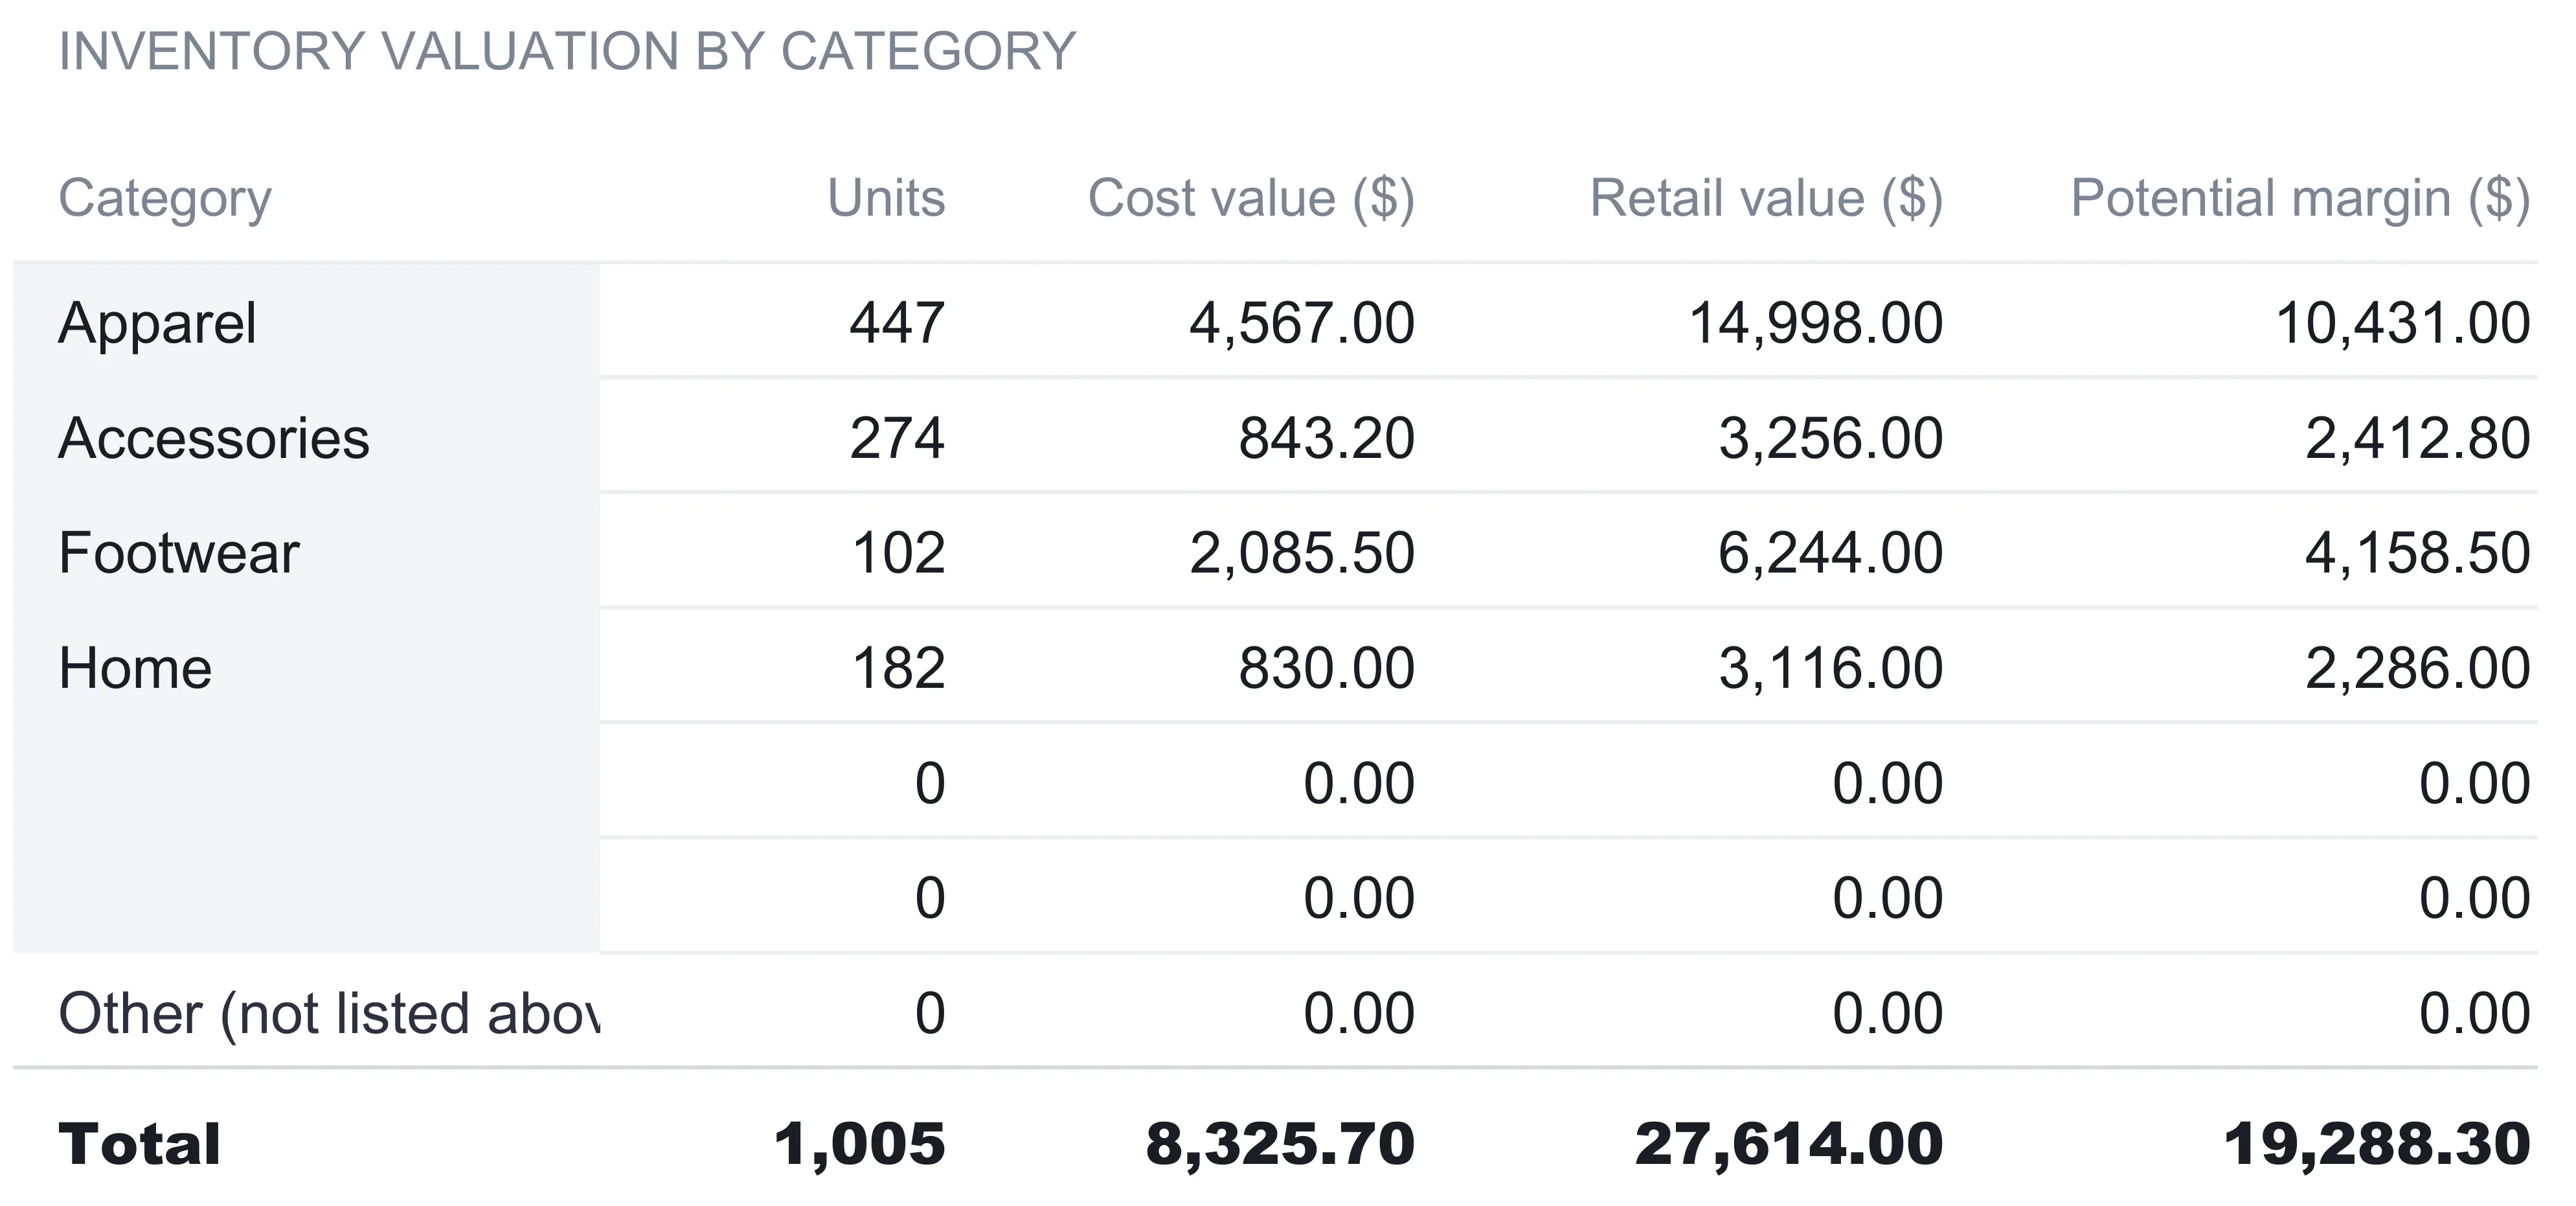
Cost value is the sum of on hand times unit cost for the items in that category, and retail value is on hand times selling price. Potential margin is the difference between the two, the gross profit sitting in that stock if it all sold at list price. In the sample, Apparel carries 447 units worth $4,567 at cost and $14,998 at retail, a potential margin of $10,431. Footwear is a smaller pile of 102 units but a costlier one, $2,085.50 at cost against $6,244 at retail. Across all four categories the totals come to 1,005 units, $8,325.70 at cost, $27,614 at retail, and $19,288.30 of potential margin.
The word potential is doing honest work in that last column. It is the margin the stock would earn at full price with nothing discounted, marked down, or written off, so it is a ceiling rather than a forecast. It is still a useful ceiling, because it shows where the value is concentrated. Apparel holds far more locked-up profit than Home does, which is the kind of thing that is invisible from a shelf but obvious from the table.
The sheet lists four named categories, then an Other (not listed above) row that sweeps up anything whose category does not match one of the named ones. That catch-all is what keeps the valuation total tied to the Inventory sheet total: every unit lands somewhere, so the grand total always reconciles to the 1,005 units and $8,325.70 on the register. Naming a category in one of the blank rows breaks it out of Other into its own line.
A note on method, because inventory valuation carries some accounting weight. The template values each SKU at the single unit cost you enter for it, so stock value is on hand times that cost. It does not track cost layers, so it does not run FIFO, LIFO, or a moving weighted average across receipts bought at different prices over time. For a business whose unit costs are stable, a standing cost per SKU is a clean and legible approach. A business whose costs move enough that the layering method changes the reported number would track that separately.
The dashboard: the whole position in seven numbers
With the three input sheets filled, the Dashboard states the position. Seven KPI tiles sit across the top, and in the sample they read: inventory value $8,326 at cost, retail value $27,614 at selling price, 1,005 units on hand across all SKUs, 6 SKUs to reorder, 12 SKUs named in the register, 0 out of stock, and $19,288 of potential margin.
| Metric | Sample value | How it is derived |
|---|---|---|
| Inventory value | $8,326 | Total stock at unit cost |
| Retail value | $27,614 | Total stock at selling price |
| Units on hand | 1,005 | Sum of every SKU’s on-hand count |
| To reorder | 6 | SKUs flagged Yes on the Reorder report |
| SKUs | 12 | Items named in the register |
| Out of stock | 0 | SKUs with zero on hand |
| Potential margin | $19,288 | Retail value minus inventory value |
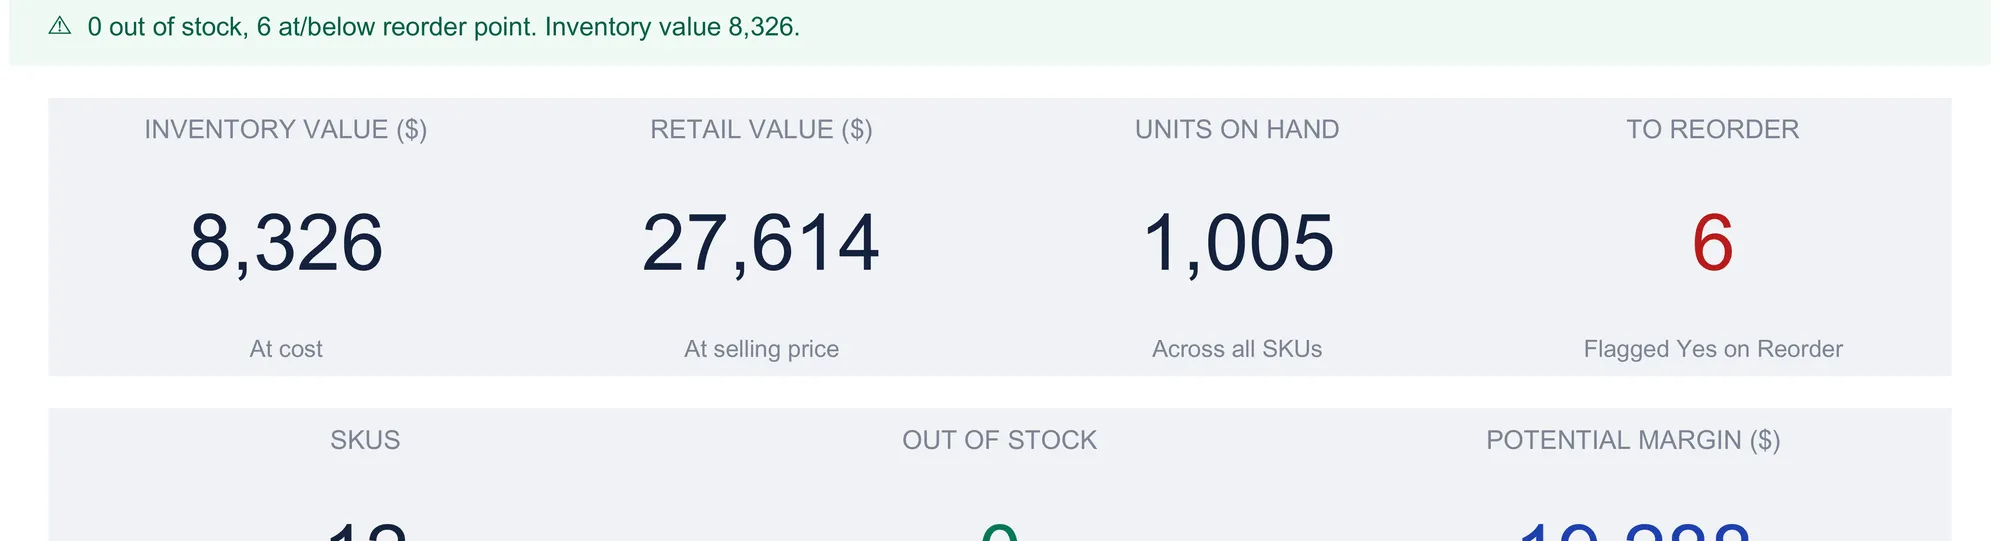
A status line above the tiles states the position in one sentence and shifts with the numbers. In the sample it reads that 0 SKUs are out of stock and 6 are at or below their reorder point, with an inventory value of 8,326. When nothing needs reordering it flips to a healthy message instead, so the file tells you where it stands the moment it opens. Below the tiles, two charts round out the picture: inventory value by category, and a count of SKUs by stock status split into OK, Reorder, and Out. The gallery render above captures the status banner and the first row of tiles; the second row of labels begins at the bottom edge with its figures and the charts sitting further down the sheet.
The number worth pausing on is the gap between $8,326 and $27,614. The first is what the stock cost to buy; the second is what it would bring in at list price. No single supplier invoice or sales report shows both at once for everything on hand, and seeing them side by side, with the $19,288 of potential margin between them, is much of the reason to keep the sheet at all.
On hand, reorder point, and stock value in plain terms
Three terms carry most of the weight in inventory tracking, and none of them is complicated once separated from the jargon.
On hand is how many units you physically have right now. In the template it is never typed; it is opening stock plus everything received, minus everything sold, plus or minus any adjustments, computed live from the movements log.
Reorder point is the on-hand level meant to trigger a purchase. It is a number you set per item, and one way people choose it is so that ordering when stock reaches it leaves enough on the shelf to cover the wait for the delivery. The template compares on hand to this number and flags the item when stock crosses it.
Stock value is on hand times unit cost, the money tied up in the shelf. Its sibling, retail value, is on hand times selling price, and the difference between them is the potential margin: the gross profit the stock would produce if it all sold at list. Every one of these is a plain multiplication or a running sum, which is exactly why a spreadsheet handles stock control so cleanly.
Where inventory meets the books
Stock is not only an operations concern; it is an asset on the books and a component of cost of goods sold at tax time. In the US, IRS Publication 334, the Tax Guide for Small Business, covers inventories and cost of goods sold for sole proprietors who file Schedule C, including when a business is required to account for inventories and how opening and closing stock feed the cost of goods sold calculation. A closing inventory value like the $8,326 at cost on the dashboard is the figure that flows into that calculation, and arriving at the end of a period with it already totaled turns the accounting into a lookup rather than a stocktake reconstruction. A tax professional can confirm how the rules apply to a specific business.
The inventory value at cost is also the number that sits alongside the books at period end. Our Business Bookkeeping Spreadsheet Template ($29) is a single-entry ledger: every income or expense line is typed once on the Transactions sheet, and the chart of accounts, the P&L Summary, the Monthly view, and the dashboard all build themselves from it. A stock purchase is recorded there as an expense line like any other. It carries no inventory or asset sheet, so the closing stock value stays in the inventory workbook and is read across when the accounts need it. The two templates answer different questions. The inventory sheet answers how much of each item you hold and what it is worth; the bookkeeping sheet answers where the money went. Keeping stock levels out of the transaction ledger and in a purpose-built sheet is what keeps both readable.
Excel or Google Sheets for inventory tracking
The template is an .xlsx file built on ordinary formulas, SUMIFS, COUNTIF, and IF, with no macros and no add-ons, so it runs identically in Microsoft Excel and in Google Sheets after upload. Google Sheets suits a business that wants staff to log movements from a phone or a back-office laptop with the file shared in the cloud; Excel suits one that prefers a local file on a single machine. The structure described here, a catalog referring to a movements log with rollups on top, is equally buildable in either program if you would rather assemble your own inventory spreadsheet from scratch.
Which template fits
- Inventory Management Spreadsheet Template ($29) is the workbook this walkthrough follows: the SKU register, the movements log, the reorder report, valuation by category, and the seven-metric dashboard, ready to use for a single stock pool of up to 24 SKUs out of the box.
- Business Bookkeeping Spreadsheet Template ($29) is the companion for the money side: a transaction ledger with a chart of accounts, a P&L summary, and a month-by-month view, so the two together cover both what you hold and where the cash moved.
Related
- How to Do Bookkeeping in a Spreadsheet - the full bookkeeping walkthrough that the inventory asset feeds into
- How to Build an Ecommerce Financial Model in a Spreadsheet - a forward-looking revenue and profit model, where inventory is one input rather than the whole picture
- How to Build a Profit and Loss Statement in a Spreadsheet - where cost of goods sold, and the stock behind it, lands in the accounts
Frequently asked questions
How does the spreadsheet calculate on-hand quantity?
On hand is never typed. Each SKU starts from an opening figure on the Inventory sheet, then the sheet adds every Receive, subtracts every Sell, and applies every Adjust logged for that SKU on the Movements sheet. So on hand equals opening plus received minus sold plus adjustments. Change a movement or add a new one and the count updates everywhere the SKU appears.
What is a reorder point and how is it used here?
A reorder point (ROP) is the on-hand level at which a SKU is due to be reordered. You set one per SKU on the Inventory sheet. When on hand falls to or below that number, the Status column flips to Reorder and the SKU appears on the Reorder report with its suggested order quantity and order cost. The template does not calculate the ROP for you; it holds the number you decide and watches the stock level against it.
Which inventory valuation method does the template use?
It values stock at the unit cost you enter for each SKU: stock value equals on hand multiplied by that cost. Retail value uses the selling price instead. It does not run FIFO, LIFO, or a moving weighted average across receipts bought at different prices, so a business that needs one of those methods would track cost layers separately. For a single standing cost per SKU, the sheet gives cost value, retail value, and the gap between them by category.
Can one file track more than one location or warehouse?
The workbook runs one stock pool: on hand is a single number per SKU across the whole file. Splitting a SKU by location would mean separate SKU codes per location, or a separate copy of the file per site. The Movements log has no location column, so a business managing several warehouses in one view would need a different setup.
How many SKUs and movements does the template hold?
The Inventory sheet ships with 12 sample SKUs and 12 spare rows, for 24 in total. The Movements sheet carries 16 sample entries and 44 spare rows, for 60. Blank rows are pre-wired, so a new SKU or movement is already inside every total, the Reorder report, and the Valuation before you type in it.
Sources
- About Publication 334, Tax Guide for Small Business - Internal Revenue Service
- Publication 334, Tax Guide for Small Business (Inventories and Cost of Goods Sold) - Internal Revenue Service
About this article
Sheets, columns, formulas, sample figures, and feature descriptions checked on 2026-09-10 against the shipped Inventory Management Premium workbook (Dashboard, Inventory, Movements, Reorder, Valuation, Settings, How to Use), and the Business Bookkeeping Premium workbook (Dashboard, Transactions, Categories, P&L Summary, Monthly, Settings, How to Use). Publication 334 references checked against the live IRS pages at writing time. Last reviewed September 2026.