Store analytics report revenue. They rarely report whether that revenue paid for the traffic that produced it. An ecommerce financial model spreadsheet closes that gap with four input sheets: channel traffic, per-order costs, marketing spend, and funnel counts. From those it computes AOV, contribution margin, blended CAC, ROAS, LTV, and LTV:CAC. This walkthrough follows a worked example: 165,000 visitors, 4,598 orders, $398,212 of revenue, $44.00 of contribution margin per order, and an LTV:CAC of 3.8x. Our E-commerce Financial Model spreadsheet template ($59) ships the same structure ready-made for Excel and Google Sheets.
Every ecommerce platform reports revenue. Almost none of them report whether that revenue paid for the traffic that produced it. A store can post a record month, a healthy return on ad spend, and a rising average order value. Every additional order can still lose money once the product, the box, the shipping label, and the refunds are counted.
Closing that gap takes four things a store already has in separate places: traffic and conversion by channel, the per-order costs behind an order, what marketing spent and what it brought in, and the counts at each step of the funnel. Put them on one page and the store’s arithmetic becomes visible. That is what an ecommerce financial model spreadsheet is for.
The examples below come from our E-commerce Financial Model Spreadsheet Template ($59), which ships the whole structure ready-made for Excel and Google Sheets. The sample file models a direct-to-consumer store, Aurora Goods Co., with 165,000 visitors and $398,212 of revenue. The structure is reproducible by hand if you would rather build your own.
What an ecommerce financial model has to hold
Strip out the presentation and the model is only four kinds of information.
- Traffic and conversion by channel. Visitors, a conversion rate, and an average order value for each source. This is where revenue comes from and it is the raw material for everything downstream.
- Per-order costs. Cost of goods as a share of the order, shipping, fulfillment, and what returns take back. These decide what is left of an order once it ships.
- Marketing spend and new customers. What each channel cost and how many first-time buyers it produced. Without the second number, spend is just an expense.
- Funnel counts. How many people reached each step between landing on the site and paying. Without them, a weak conversion rate has no explanation.
The workbook gives each of those its own sheet. Channels, Unit Economics, Marketing, and Funnel hold the store, Settings holds the business name and two retention assumptions, a Dashboard sits on top, and a How to Use sheet carries the definitions and the benchmarks. Seven sheets in total, and across all of them exactly thirty-five numbers are typed, plus channel names, a business name, and a currency symbol. Every other cell carrying a number is a formula, and every entry cell is shaded so it is obvious at a glance which is which.
Build order follows the dependencies rather than the tab order. Settings comes first, then Channels, whose totals row feeds Unit Economics, and Marketing and Funnel both read from those two. The dashboard is last because it holds no inputs of its own. The sections below follow that order, so they double as build instructions for anyone starting from a blank file.
Settings first: two numbers that build LTV
The Settings sheet is the smallest in the file and the easiest to skip, which is a good reason to start there. Two of its four fields never appear as a metric on their own and yet they decide the headline figure on the dashboard.
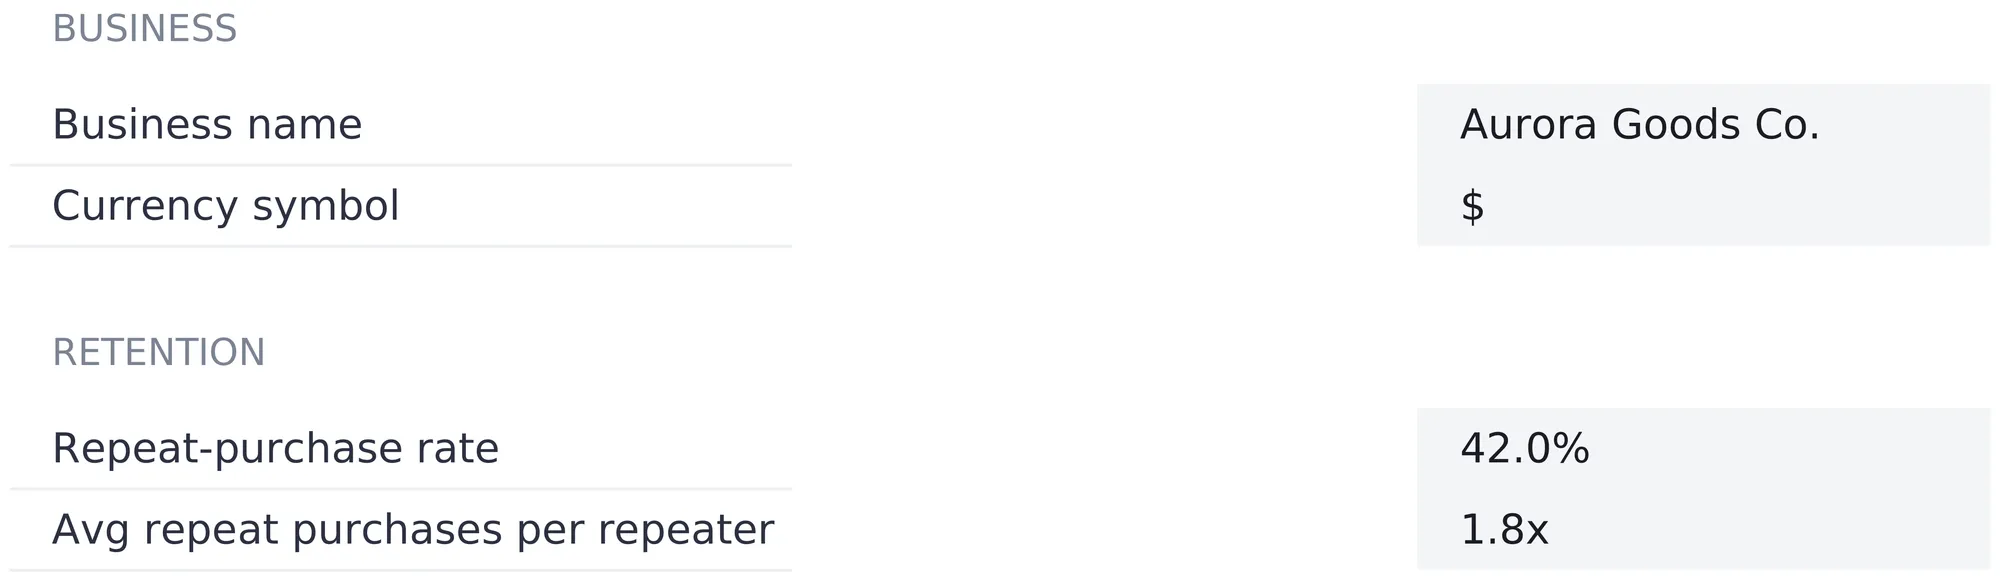
Repeat-purchase rate, 42.0 percent in the sample, is the share of customers who buy again.
Average repeat purchases per repeater, 1.8x, is how many additional orders those returning customers place.
The Marketing sheet multiplies them into expected orders per customer as one plus the repeat rate times repeats per repeater, so 1 + 0.42 × 1.8 gives 1.756 orders per customer. That figure is the entire retention model, and it flows straight into lifetime value. Push the repeat rate from 42 percent to 50 percent and lifetime value rises without another cell changing. Worth knowing before any LTV figure gets read as a fact about the business rather than an output of two typed assumptions.
Settings also holds the business name, which appears under the title on every sheet, and a currency symbol chosen from a dropdown of 35 options. Changing it relabels every money header and KPI tile across the workbook. It relabels only, with no conversion of the underlying numbers.
The Channels sheet: where revenue comes from
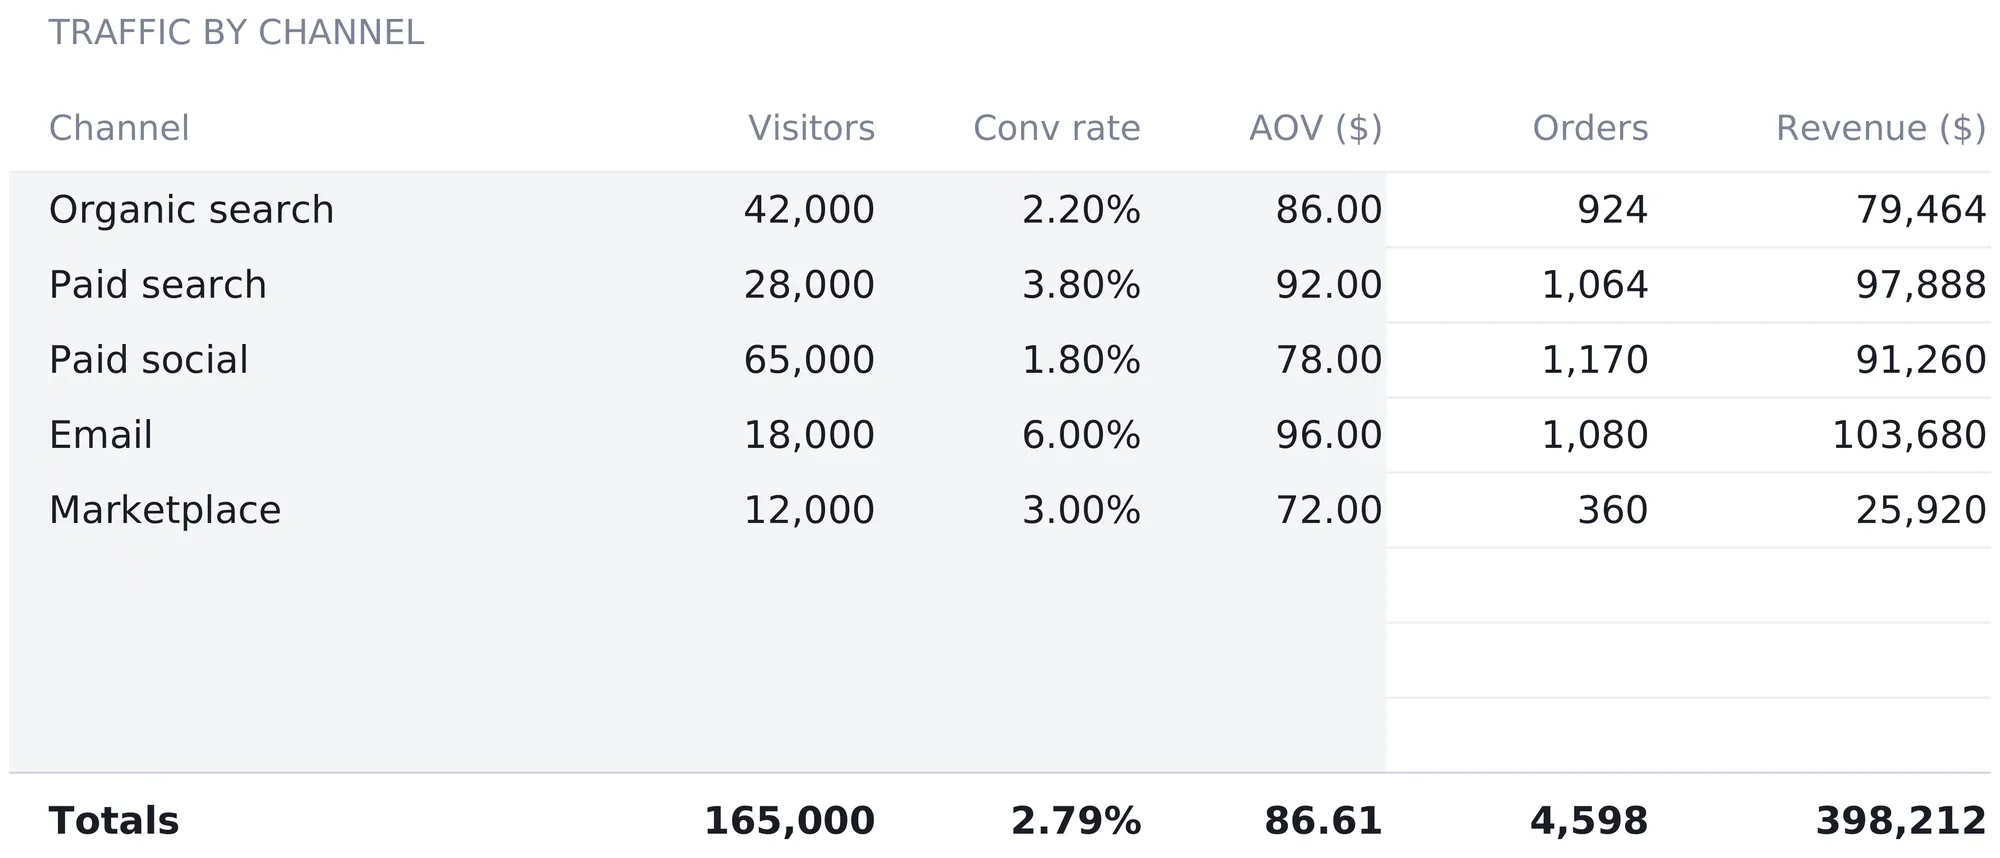
Three typed numbers per channel produce two computed ones. Visitors times conversion rate gives orders, and orders times average order value gives revenue. Five channels are filled in the sample, and three blank rows sit below them already carrying the formulas and already inside every total. Naming one adds a channel to the totals and to the dashboard chart without touching a range.
| Channel | Visitors | Conv rate | AOV ($) | Orders | Revenue ($) |
|---|---|---|---|---|---|
| Organic search | 42,000 | 2.20% | 86.00 | 924 | 79,464 |
| Paid search | 28,000 | 3.80% | 92.00 | 1,064 | 97,888 |
| Paid social | 65,000 | 1.80% | 78.00 | 1,170 | 91,260 |
| 18,000 | 6.00% | 96.00 | 1,080 | 103,680 | |
| Marketplace | 12,000 | 3.00% | 72.00 | 360 | 25,920 |
| Totals | 165,000 | 2.79% | 86.61 | 4,598 | 398,212 |
Two rows disagree with the way most stores talk about their traffic. Paid social brings 65,000 visitors, more than any other channel and nearly four times what email brings, and it lands third in revenue. Email brings 18,000 visitors, the second smallest number on the sheet, and produces the largest revenue line in the file at $103,680. A 6 percent conversion rate against a 1.8 percent one closes a gap that a traffic report never shows.
The totals row is the piece worth copying into any hand-built version. It does not average the conversion rates or the order values. It blends them, dividing total orders by total visitors for a 2.79 percent conversion rate and total revenue by total orders for an $86.61 average order value. An arithmetic mean of the five AOV figures would read $84.80 and would be wrong, because it would give the marketplace channel’s 360 orders the same weight as email’s 1,080. That blended $86.61 is the number the rest of the workbook runs on.
Unit economics: what one order keeps
The Unit Economics sheet is nine rows long and it carries the most consequential arithmetic in the file. It opens with the blended $86.61 pulled straight from the Channels totals row. That link is what keeps the model honest, because the margin computed here covers exactly the orders counted there, not a hand-picked hero product.
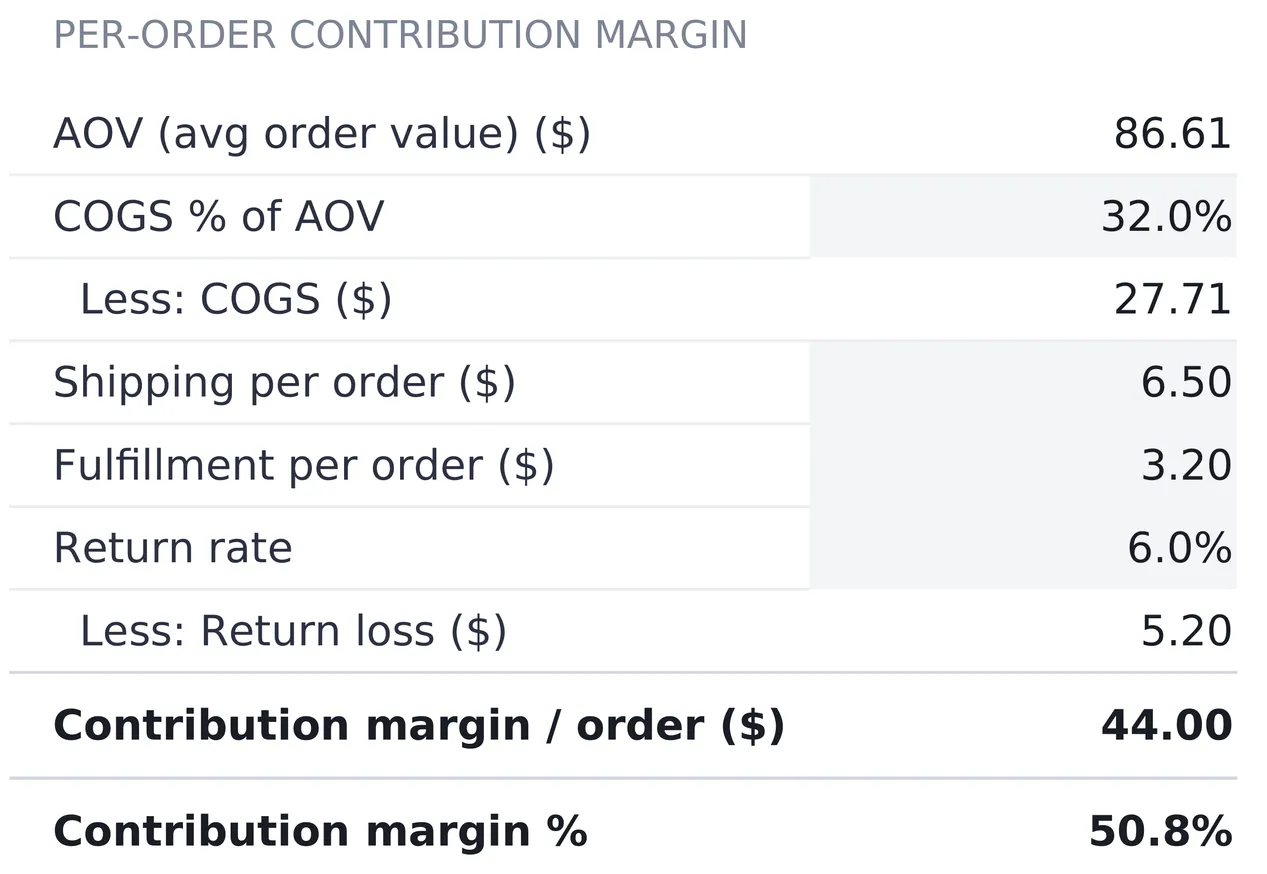
Four numbers are typed and the rest is subtraction.
| Line | Sample value | Source |
|---|---|---|
| AOV (avg order value) | $86.61 | From the Channels totals row |
| COGS % of AOV | 32.0% | Typed |
| Less: COGS | $27.71 | AOV × COGS % |
| Shipping per order | $6.50 | Typed |
| Fulfillment per order | $3.20 | Typed |
| Return rate | 6.0% | Typed |
| Less: Return loss | $5.20 | AOV × return rate |
| Contribution margin / order | $44.00 | AOV less the four costs |
| Contribution margin % | 50.8% | Margin ÷ AOV |
Contribution margin per order is what a single order leaves behind once the product, the shipping label, the pick and pack, and the refunds are paid. It is not profit. Rent, salaries, software, and every other fixed cost still come out of it, and so does marketing.
The return line is modeled as a haircut on revenue rather than as a set of reversed orders. Return loss is average order value times the return rate, so a 6 percent return rate removes 6 percent of order value from every order’s margin. Nothing is added back for goods that come back resalable, and no restocking cost is deducted either. That simplification is easy to live with at 6 percent and harder at the rates parts of the industry see. The National Retail Federation and Happy Returns estimate that 19.3 percent of online sales were returned in 2025, though the figure varies widely by category. Leaving the 6.0 percent as a typed input rather than a fixed assumption suits a number that differs that much between stores.
Marketing: CAC, ROAS, and the LTV:CAC verdict
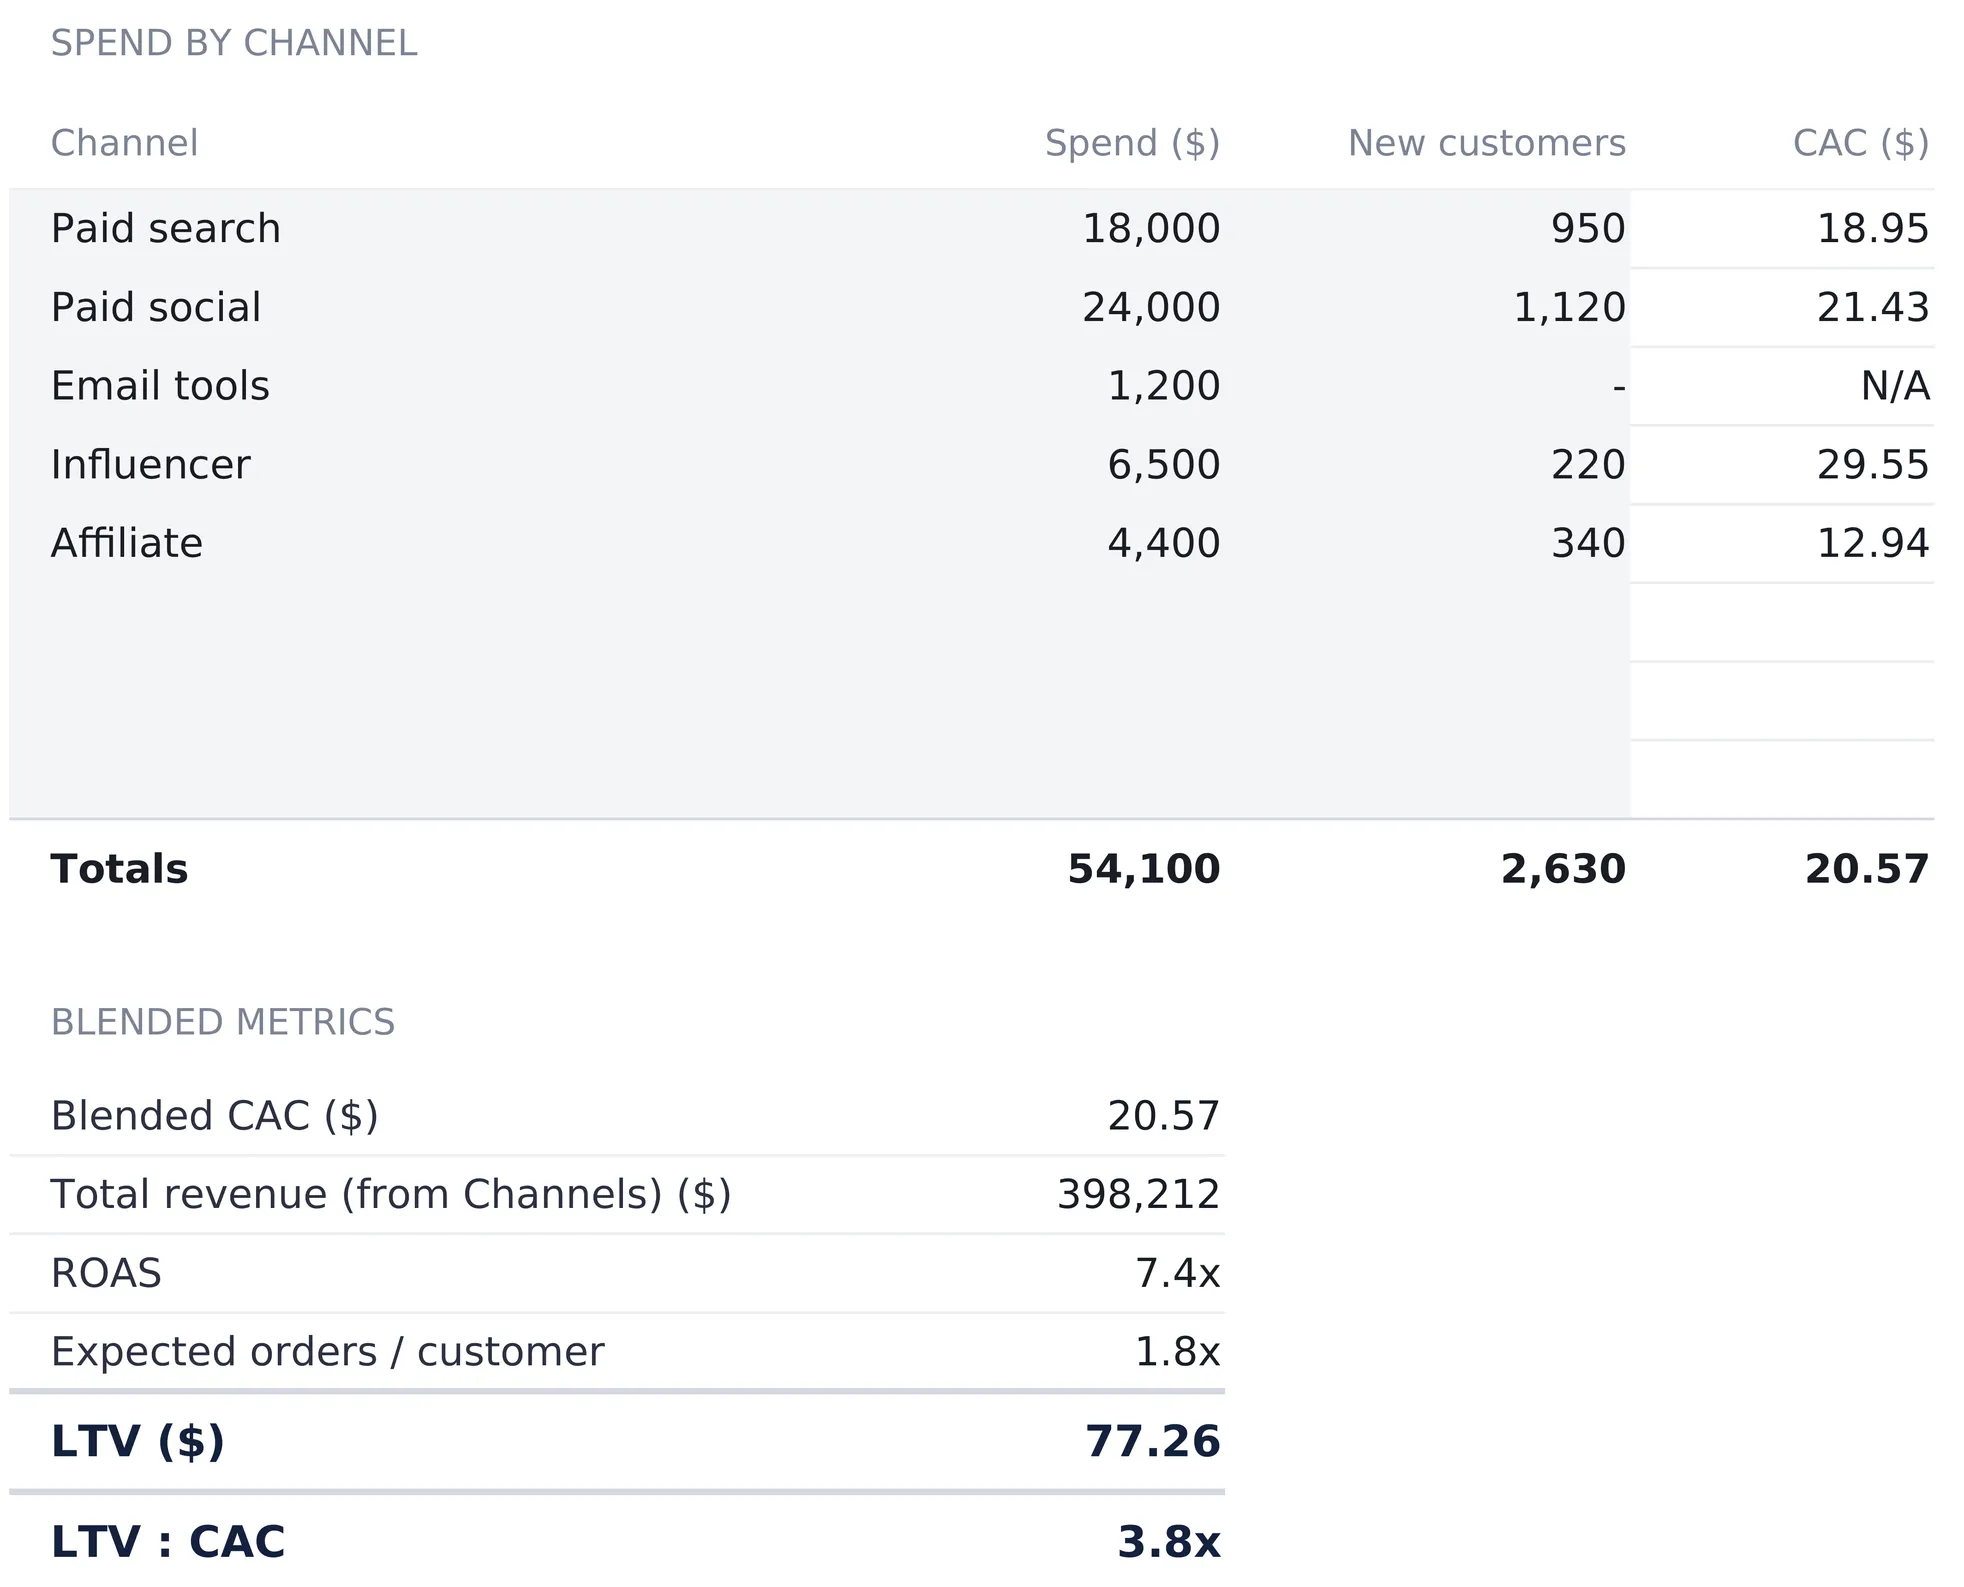
The Marketing sheet takes two typed numbers per channel, spend and new customers, and divides one by the other for customer acquisition cost.
| Channel | Spend ($) | New customers | CAC ($) |
|---|---|---|---|
| Paid search | 18,000 | 950 | 18.95 |
| Paid social | 24,000 | 1,120 | 21.43 |
| Email tools | 1,200 | 0 | N/A |
| Influencer | 6,500 | 220 | 29.55 |
| Affiliate | 4,400 | 340 | 12.94 |
| Totals | 54,100 | 2,630 | 20.57 |
The email tools row is doing something deliberate. It carries $1,200 of spend against no attributed new customers, and its CAC cell reads N/A rather than a zero that would look like free acquisition or an error that would break the sheet. The spend still counts in the $54,100 total, so it lifts blended CAC by roughly 46 cents an order. A tool supporting retention rather than acquisition has no CAC of its own, and a zero there would flatter every ratio built on it.
Below the table, a blended metrics block closes the sheet.
Blended CAC of $20.57 is total spend over total new customers. Set against the $44.00 of contribution margin an order carries, a first order covers its own acquisition with $23.43 left over, before any fixed cost.
ROAS of 7.4x is total revenue over total spend, $398,212 against $54,100. This is a blended figure across everything the store sells, not a platform-attributed one, and the distinction matters. Organic search and marketplace revenue, $105,384 between them, sit in the numerator with no spend line behind them. The workbook does not compute a paid-only version, though the two sheets hold the figures: paid search and paid social revenue of $189,148 against their $42,000 of spend works out closer to 4.5x. Reading 7.4x as the return on the ad account would overstate what the ads did.
Expected orders per customer of 1.756 comes from the two Settings inputs and rounds to 1.8x on the sheet. LTV of $77.26 is AOV times those expected orders times the 50.8 percent contribution margin. Because the margin percentage is inside the multiplication, this is lifetime contribution rather than lifetime revenue. Lifetime revenue on the same assumptions would read about $152, and comparing that against CAC would flatter the ratio by nearly double.
LTV:CAC of 3.8x is the last row, $77.26 against $20.57. A 3:1 ratio is the threshold this workbook marks, noted on the sheet as a common ecommerce health benchmark rather than a rule. What the ratio says is narrower than it looks. It compares one customer’s expected margin against one customer’s acquisition cost, and it says nothing about the fixed costs sitting behind both.
Five numbers move that ratio and nothing else does: blended AOV from Channels, the repeat rate and repeats per repeater from Settings, the contribution margin percentage from Unit Economics, and blended CAC from this sheet. A file reading 2.1x instead of 3.8x traces back to those five cells, which is a narrower place to look than a marketing report.
The workbook does not cross-check the Marketing sheet against Channels. The Marketing sheet’s 2,630 new customers multiplied by 1.756 expected orders each comes to roughly 4,618 orders, close to the 4,598 the Channels sheet computes. Nothing enforces that agreement, since the two sheets take independent inputs, and a large gap would mean the retention assumptions and the traffic figures describe different businesses.
The funnel: five stages and the drop that matters
A blended conversion rate of 2.8 percent is a symptom. The Funnel sheet turns it into a location.
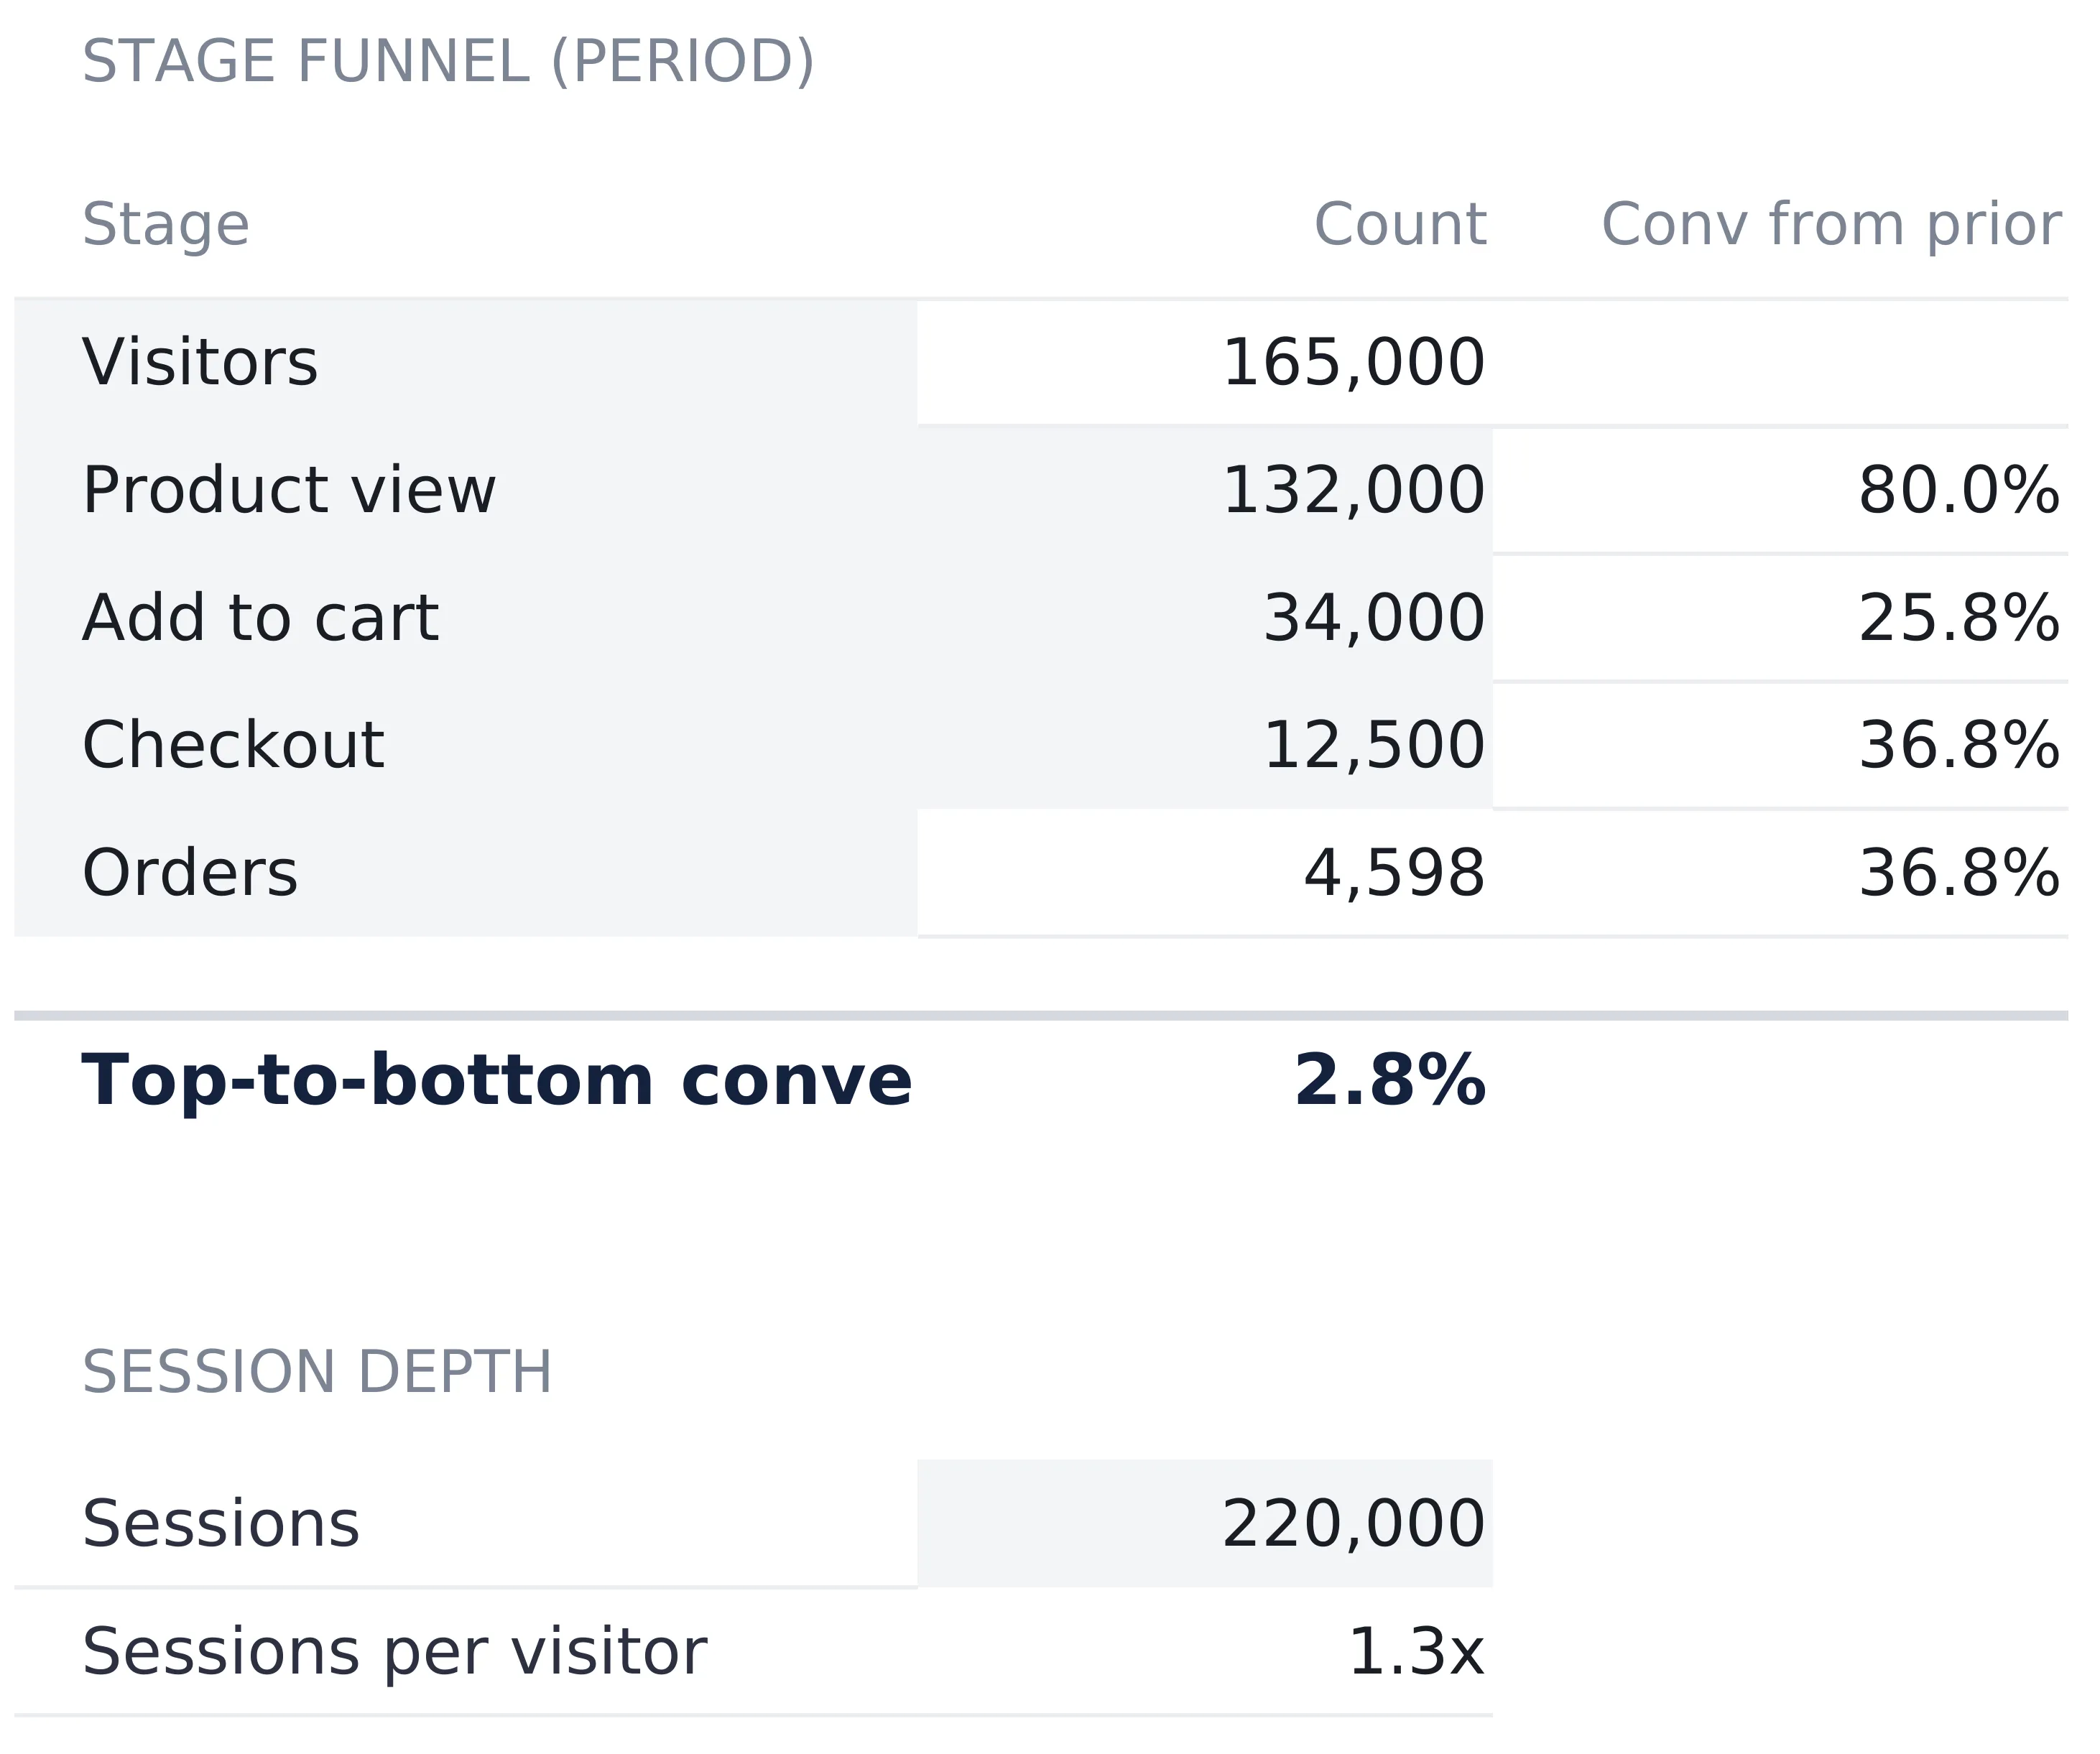
Five stages run from visitors to orders, and only the three in the middle are typed. Visitors and orders are locked to the Channels totals row, which means the funnel can never disagree with the revenue model above it.
| Stage | Count | Conv from prior |
|---|---|---|
| Visitors | 165,000 | |
| Product view | 132,000 | 80.0% |
| Add to cart | 34,000 | 25.8% |
| Checkout | 12,500 | 36.8% |
| Orders | 4,598 | 36.8% |
| Top-to-bottom conversion | 2.8% |
Four of every five visitors reach a product page, which is the strongest step in the funnel. One in four of those adds to cart, and 98,000 people leave at that single step, the largest loss anywhere on the sheet. The two 36.8 percent figures underneath are a coincidence of rounding rather than the same number: 12,500 over 34,000 is 36.76 percent and 4,598 over 12,500 is 36.78 percent.
Read across the bottom half and 34,000 carts produce 4,598 orders, so 86.5 percent of carts never become an order. For context, Baymard Institute’s running average across 50 studies puts documented cart abandonment at 70.22 percent, so the sample store sits well above that average. Whether that gap is a checkout problem, a shipping cost surprise, or a category where browsing carts is normal is not something the spreadsheet can answer. It can only put the number somewhere it will not be missed.
Below the funnel, a session depth block holds one typed figure, 220,000 sessions, and divides it by visitors for 1.3x sessions per visitor. The top-to-bottom conversion of 2.8 percent is the same value as the blended 2.79 percent on the Channels sheet, shown to one decimal place instead of two.
The dashboard: eight tiles and one line
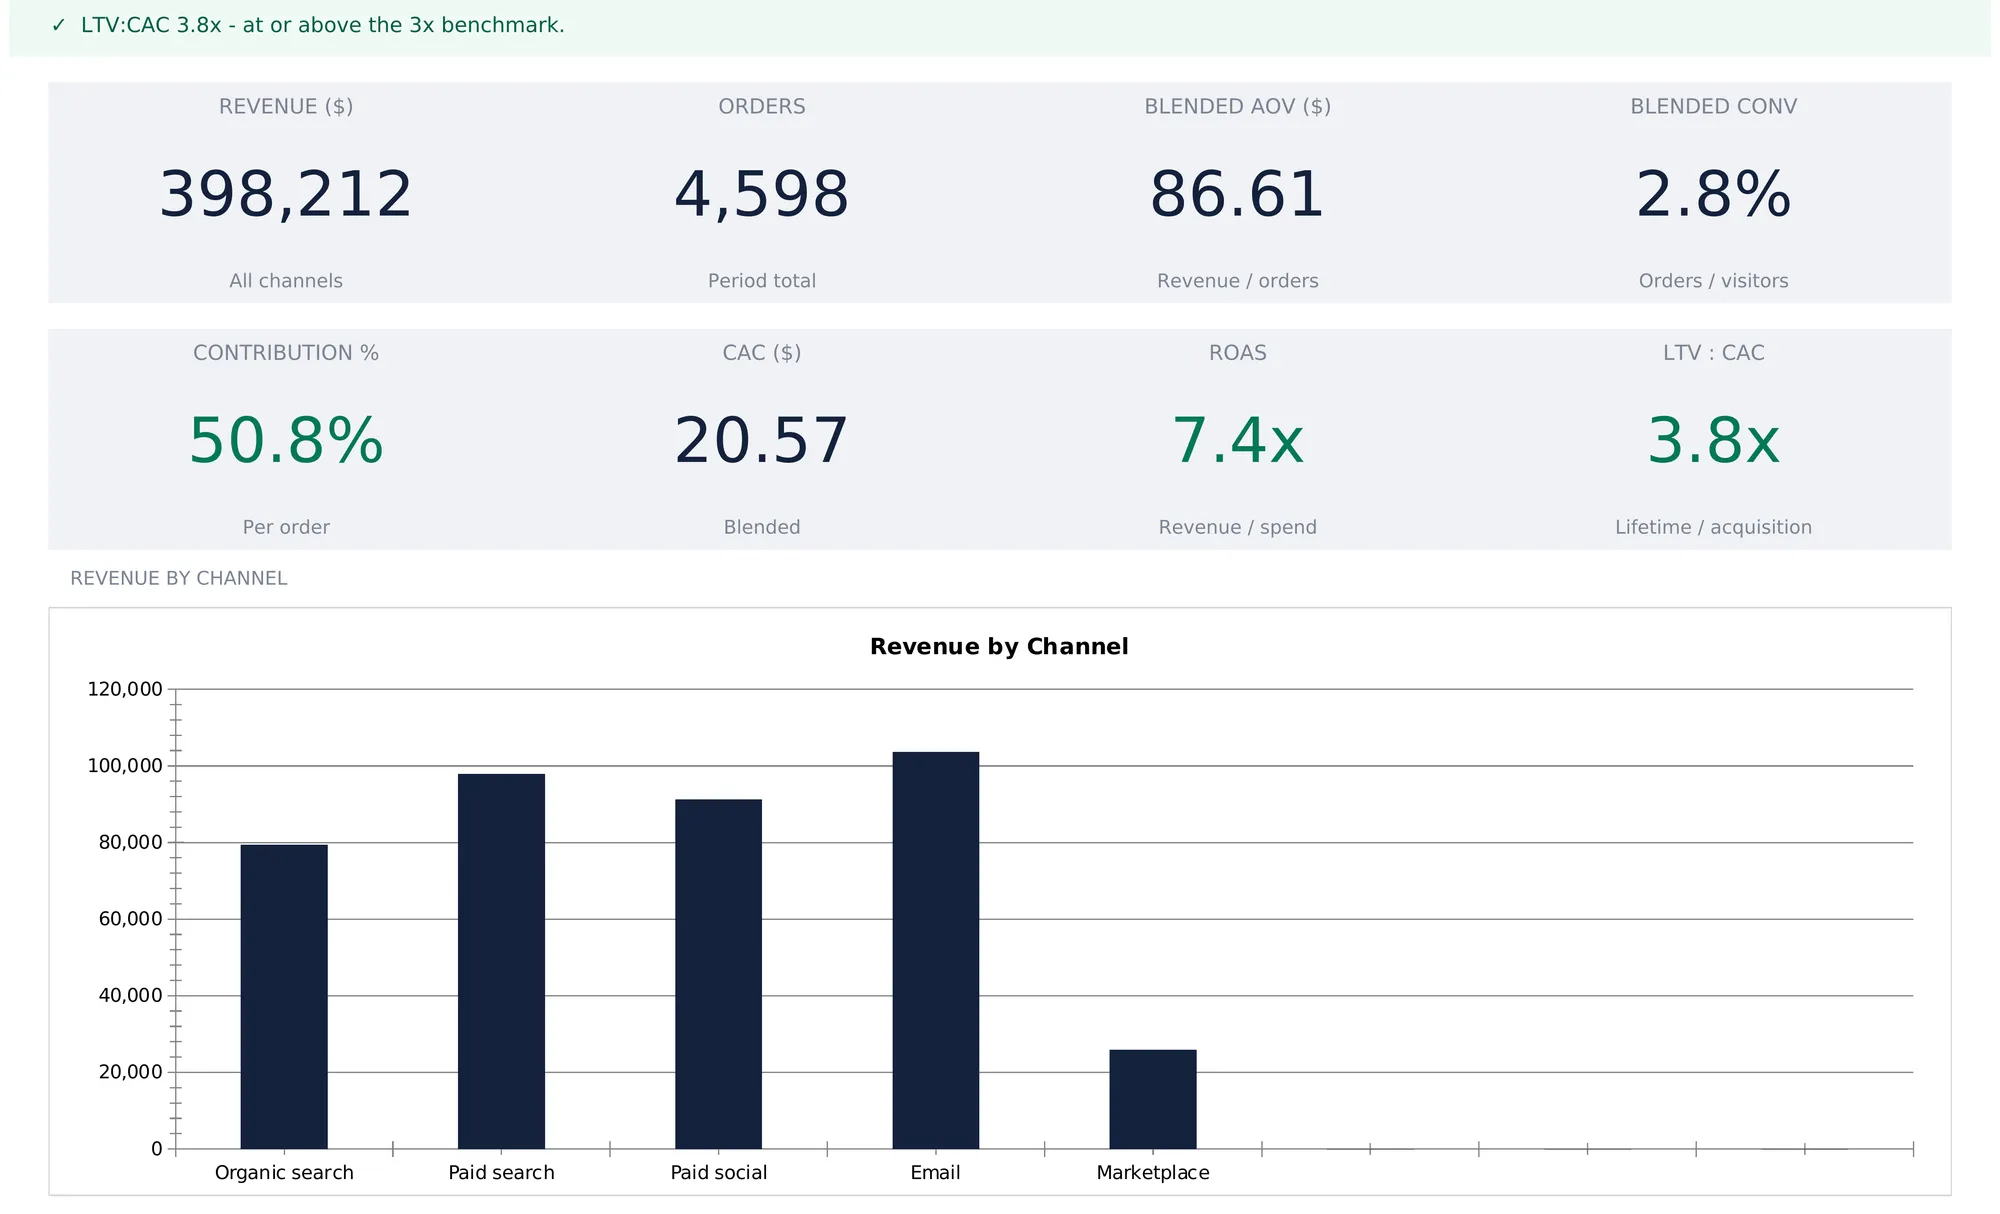
With the four input sheets filled, the Dashboard states the store. A status line across the top reports the LTV:CAC ratio in one sentence, with a checkmark on green at or above 3.0x and a warning below it. A third state covers a half-filled file. When the Marketing sheet has no blended CAC, the line says the ratio is unavailable rather than showing a number that means nothing.
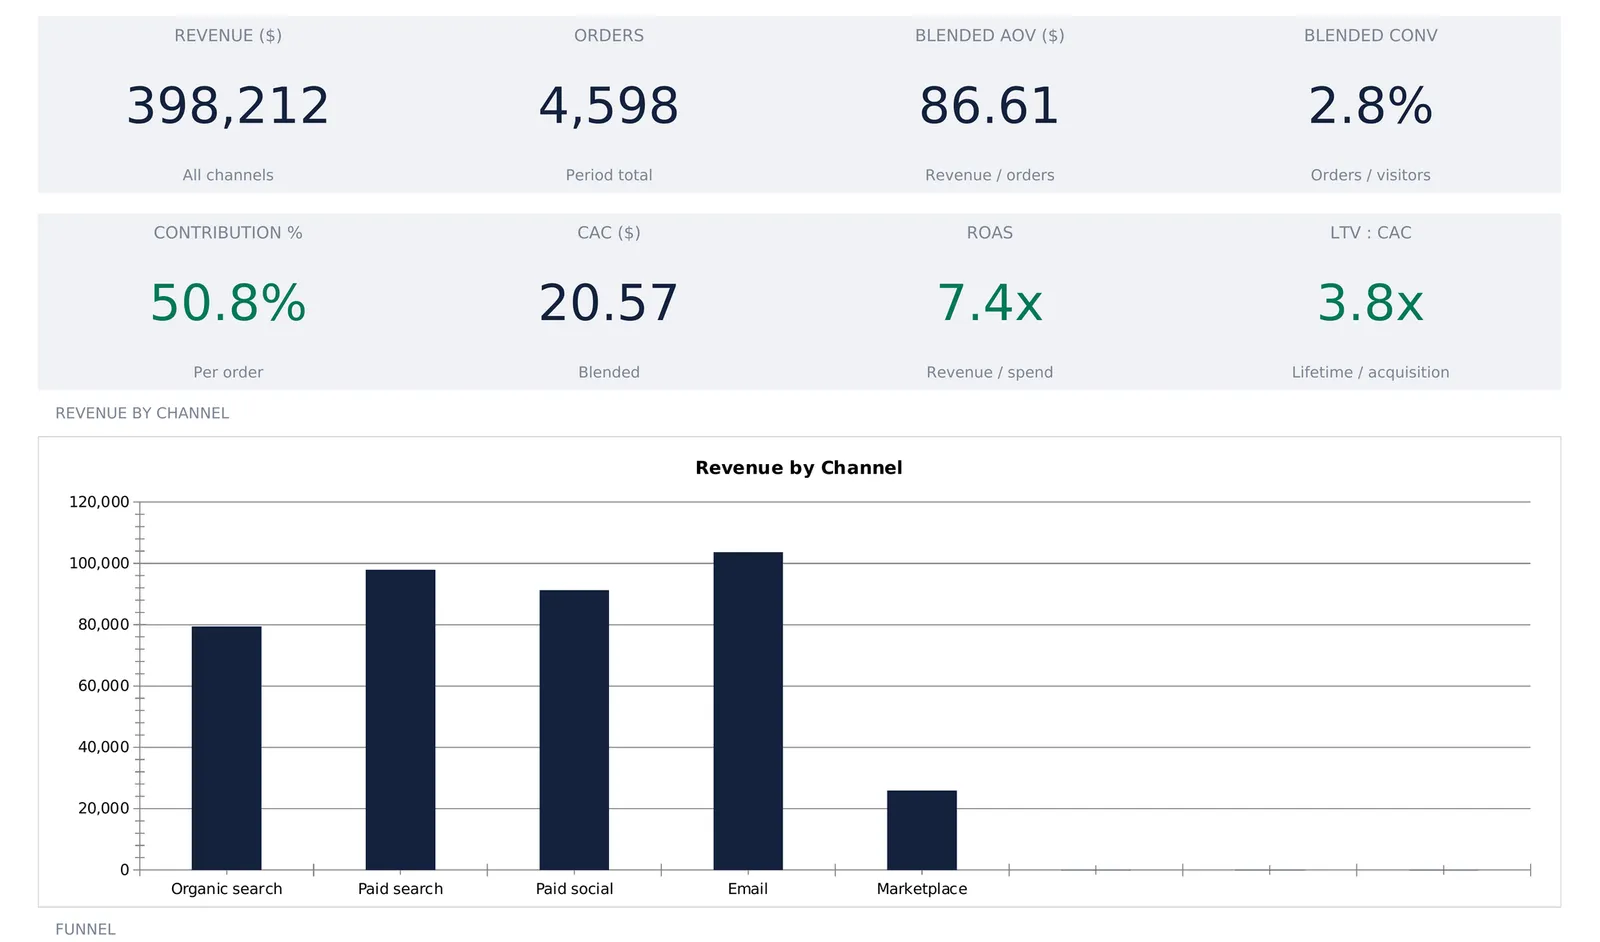
The top row of tiles is the revenue view: revenue $398,212 across all channels, 4,598 orders for the period, a blended AOV of $86.61, and a blended conversion rate of 2.8 percent. The bottom row is the efficiency view: contribution margin of 50.8 percent per order, blended CAC of $20.57, ROAS of 7.4x, and LTV:CAC of 3.8x. Each tile prints its own derivation as a caption, so revenue over orders and orders over visitors sit under the numbers they produce.
The split between those two rows is the point of the exercise. A platform dashboard reports the top row: $398,212 sold across 4,598 orders. What happened to that money on the way through shows up only in the bottom row, and only a model produces it.
Two bar charts sit below the tiles. Revenue by Channel plots the five named channels, where email’s lead over paid social becomes obvious at a glance, and Funnel plots the five stage counts. Both read from a helper block that substitutes zero for any unnamed row, so a spare channel row never breaks a chart.
What this model leaves out
There is no time axis. The workbook holds one period with no month columns, no seasonality, no cohorts, and no growth projection, so it answers what the store looks like now, not in December.
There is no fixed cost sheet and therefore no net profit. Contribution margin is where the model stops, so the $44.00 an order carries has not yet met rent, salaries, software, or anyone’s time. Multiply it by 4,598 orders and the pot those costs are paid from is $202,290 for the period, but the file does not do that multiplication or hold anything to subtract from it.
Inventory, cash, and payment processing sit outside as well. There is no stock level, no cash balance, no discount line, and no separate card processing fee. A store that discounts heavily or pays high processing rates folds those into the COGS percentage, or accepts a margin that runs a little high.
Attribution is not modeled at all. The two channel lists are separate, nothing joins a spend row to a revenue row, and new customers are whatever number gets typed into a cell. The workbook computes an LTV:CAC ratio to one decimal place whether the new-customer counts came from a clean attribution setup or a rough guess, and it cannot tell the two apart.
Excel or Google Sheets for an ecommerce financial model
The template is an .xlsx file built on plain formulas, with no macros and no add-ons, so it behaves identically in Microsoft Excel and in Google Sheets after upload. That matters here because the numbers arrive from several places at once: traffic and conversion from analytics, spend and new customers from ad platforms, per-order costs from whoever handles the products. Google Sheets suits a store where two or three people fill different sheets and want one live copy. Excel suits keeping a file per period on one machine, and the wider platform comparison for business files covers where each one strains. The structure above is buildable by hand in either.
Which spreadsheet template fits which job
- E-commerce Financial Model Spreadsheet Template ($59) is the workbook this walkthrough follows: channel traffic and revenue, per-order contribution margin, marketing spend with CAC, ROAS, LTV and LTV:CAC, a five-stage funnel, and the eight-tile dashboard, for one store in one period.
- Break-Even Analysis Spreadsheet Template ($29) picks up exactly where the contribution margin figure stops, taking a fixed cost base and working out the volume that covers it. The two answer adjacent halves of the same question, which is why they ship together in the E-commerce Seller Bundle alongside sales forecasting.
- For a marketplace seller who wants order-level tracking rather than a model, the free Etsy Seller Spreadsheet is a single sales sheet. Essentials ($19) adds a dashboard and an order log, and Ultimate ($29) adds an Etsy fee calculator, inventory tracking, monthly sales, and product profitability.
Related
- How to Forecast Cash Flow for a Small Business - the timing side of the same business, where contribution margin meets the calendar
- Google Sheets vs Excel for Business Cash Flow: Which Platform Fits? - the platform question in more detail, for a shared model like this one
- Side Hustle Income: Where to Track Extra Earnings - the simpler starting point for a shop that is not yet a full store
Frequently asked questions
What is the difference between ROAS and LTV:CAC?
ROAS in this model is total revenue divided by total marketing spend, $398,212 over $54,100, or 7.4x. It compares gross revenue against ad money in a single period. LTV:CAC compares what a customer contributes over their expected lifetime against what it cost to acquire them, $77.26 over $20.57, or 3.8x. The important difference is what sits in the numerator: ROAS counts revenue before any product, shipping, or fulfillment cost, while LTV counts only contribution margin, which is why the two numbers sit so far apart on the same store.
How is LTV calculated in this model?
LTV is blended AOV multiplied by expected orders per customer multiplied by contribution margin percent, which is $86.61 times 1.756 times 50.8 percent, or $77.26. Expected orders per customer comes from two Settings inputs, one plus the repeat-purchase rate times average repeat purchases per repeater, so 1 + 0.42 × 1.8 = 1.756. Because the contribution margin percentage is in the multiplication, this is a margin-based lifetime value rather than a lifetime revenue figure.
Where do fixed costs and overhead go?
They sit outside the file. The model stops at contribution margin per order, which is what one order leaves behind after cost of goods, shipping, fulfillment, and return loss. Rent, salaries, software, and other overhead are not entered anywhere, so the workbook computes no net profit line. Contribution margin multiplied by orders gives the pot those fixed costs are paid from, and pairing that pot against a fixed cost base is the job of a break-even model.
Do the Marketing channels have to match the Channels sheet?
No. They are two independent lists. In the sample, Channels holds organic search, paid search, paid social, email, and marketplace, while Marketing holds paid search, paid social, email tools, influencer, and affiliate. Nothing links a revenue row to a spend row, and the blended figures divide one sheet's total by the other's. That is why the ROAS figure covers all revenue, including organic and marketplace revenue that no ad spend bought.
Can one file model more than one store or more than one month?
One store, one period. Settings holds a single business name, and every sheet reports one undated block of numbers with no month columns and no time axis. A second store is a second copy of the file, and comparing periods means keeping a copy per period. The trade is that a single-period model stays small enough to read end to end in a couple of minutes.
Sources
- 50 Cart Abandonment Rate Statistics 2026 - Baymard Institute
- 2025 Retail Returns Landscape - National Retail Federation
About this article
Every figure, sheet name, formula, and feature description verified against the published E-commerce Financial Model Pro workbook (the exact file customers download). Cart abandonment and online return rate figures checked against the live Baymard Institute and National Retail Federation pages at writing time. Last reviewed August 2026.