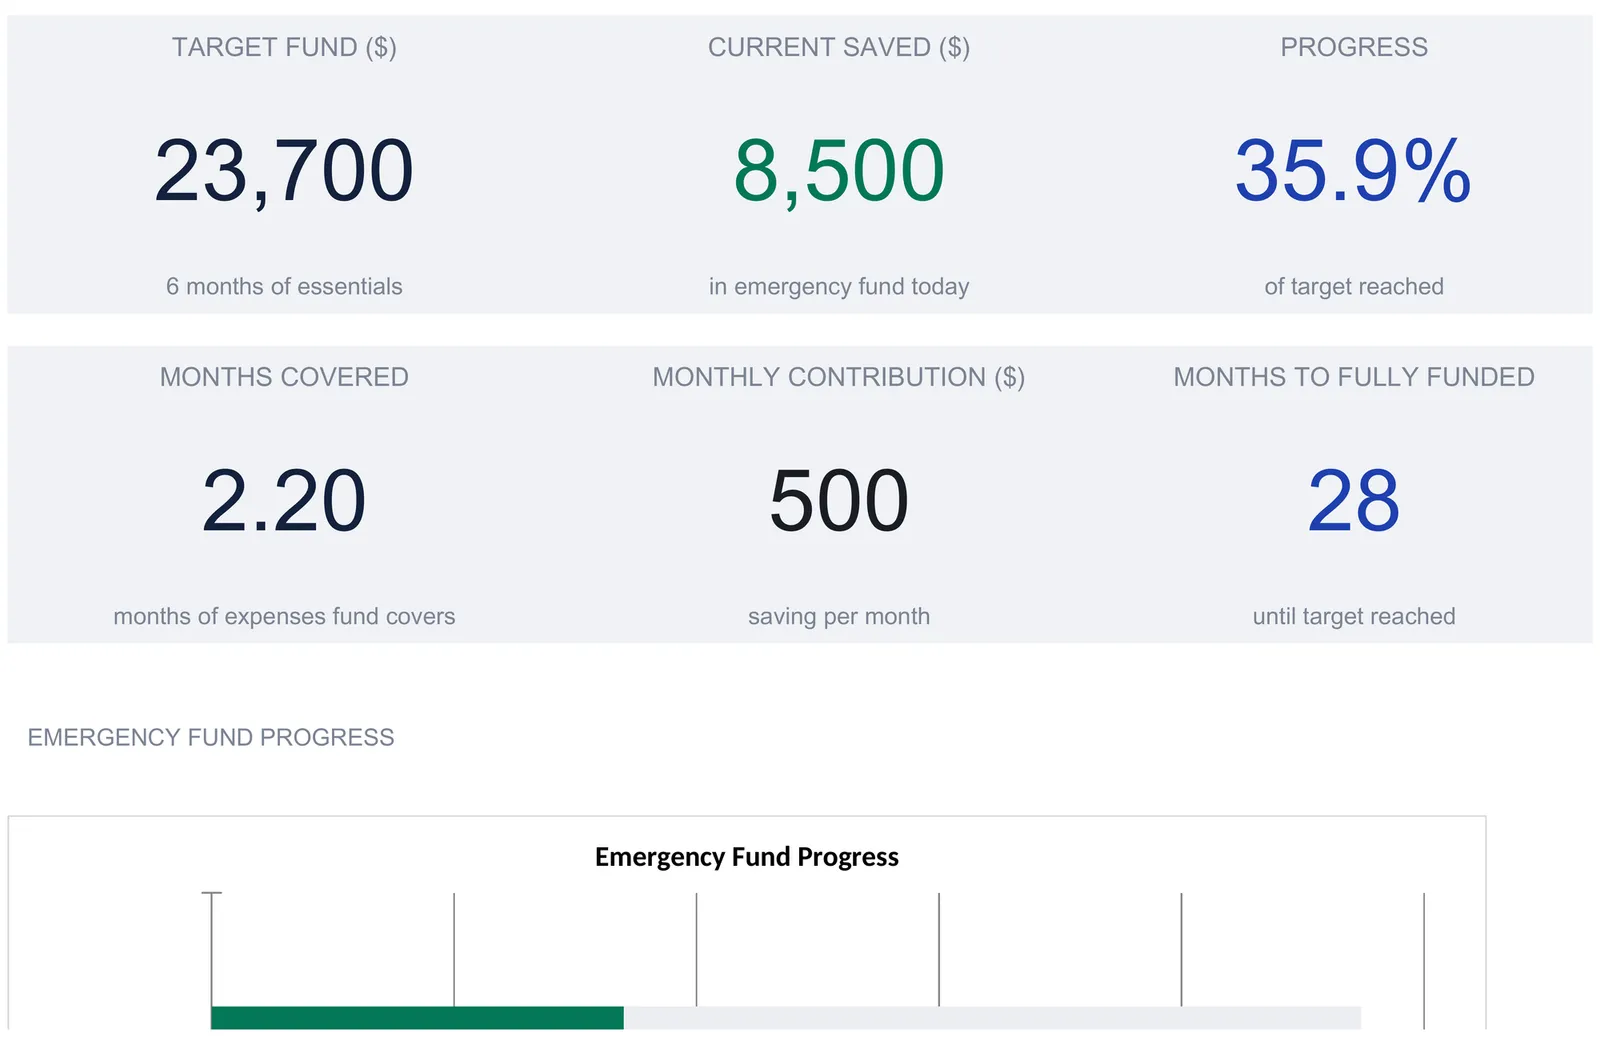
An emergency fund calculator spreadsheet sizes the target from your own numbers: total the essential monthly expenses, multiply by a months-of-coverage figure you choose, and every other view follows. This walkthrough covers the full structure using the workbook's sample, $3,950 of essentials a month, a six-month target of $23,700, and $8,500 saved so far, across a fund-building plan, tiered milestones, what-if grids, and a risk stress test. Our Emergency Fund Calculator Ultimate ($29) ships the whole thing for Excel and Google Sheets.
“How much should I have in an emergency fund?” is one of the most-asked questions in personal finance, and most answers arrive as a rule of thumb: three months, six months, a year. The trouble with a rule of thumb is that it floats free of your actual bills. Six months of what, exactly? Six months of gross pay is a different number from six months of the costs that keep the lights on, and the gap between them can run to tens of thousands of dollars.
A spreadsheet closes that gap by working from your own figures instead of a slogan. Total the expenses that continue during a crisis, choose how many months of them you want the fund to cover, and the target is arithmetic rather than a guess. From there the same numbers drive a month-by-month savings plan, a set of milestones, a few what-if grids, and a stress test that runs real emergencies against the balance. The examples below come from our Emergency Fund Calculator Ultimate Spreadsheet Template ($29), which ships the whole structure ready-made for Excel and Google Sheets. The layout is reproducible by hand if you would rather build your own emergency fund spreadsheet from scratch.
What sizing an emergency fund comes down to
Behind the rules of thumb, there are only four kinds of data involved:
- Essential monthly expenses. The costs that do not stop when income does: rent or mortgage, groceries, utilities, insurance, minimum debt payments. This is the raw material for the whole calculation.
- A coverage target. How many months of those essentials you want the fund to hold. This is a single editable number, not a fixed rule.
- Where you stand today. Your current balance, what you add each month, and the interest your savings account pays.
- Derived views. The target amount, months of coverage, time to fully funded, milestone progress, and stress-test results. These are all calculations rather than figures you type.
The Ultimate workbook gives each of these a home across six sheets. Expense Analysis holds the inputs, Fund Building Plan projects the balance forward, Tiered Targets breaks the goal into milestones, What-If Scenarios tests the plan, Spending Risk Analysis stress-tests the fund against real events, and a Dashboard reads the whole thing at a glance. A How to Use sheet carries the instructions. The order below follows the way a user actually works, starting with the numbers you type.
Start with what a crisis actually costs: the Expense Analysis sheet
Everything downstream depends on one total, so the Expense Analysis sheet comes first. It lists essential categories down the left and asks for a monthly amount beside each. The sheet then computes an annual figure and each line’s share of the total. It offers 25 rows, which is enough to cover the categories most households carry without running out of room.
The sample fills in a realistic set of essentials:
| Category | Monthly ($) | Annual ($) | % of total |
|---|---|---|---|
| Rent / Mortgage | 1,500 | 18,000 | 38.0% |
| Groceries | 600 | 7,200 | 15.2% |
| Electric & Gas | 130 | 1,560 | 3.3% |
| Water & Sewer | 45 | 540 | 1.1% |
| Internet | 70 | 840 | 1.8% |
| Phone | 60 | 720 | 1.5% |
| Health Insurance | 280 | 3,360 | 7.1% |
| Auto Insurance | 120 | 1,440 | 3.0% |
| Renters / Home Insurance | 50 | 600 | 1.3% |
| Gas / Fuel | 150 | 1,800 | 3.8% |
| Car Payment | 350 | 4,200 | 8.9% |
| Minimum Credit Card Pmts | 200 | 2,400 | 5.1% |
| Student Loan Payment | 150 | 1,800 | 3.8% |
| Medical / Prescriptions | 75 | 900 | 1.9% |
| Pet Care | 50 | 600 | 1.3% |
| Subscriptions (essential) | 30 | 360 | 0.8% |
| Personal Hygiene | 40 | 480 | 1.0% |
| Clothing (basics) | 50 | 600 | 1.3% |
| Total | 3,950 | 47,400 |
The percentage column is quietly useful. It shows at a glance that housing is 38.0 percent of the essentials total and groceries another 15.2 percent, so the two together are more than half of what the fund has to cover. That framing matters, because the whole exercise turns on which costs you class as essential. The sheet does not police that decision. It totals whatever you type in the monthly column, and a note on the How to Use sheet is explicit that which expenses count as essential is yours to decide. Categories left at zero, including the five blank “Other Essential” rows, simply drop out of the total.
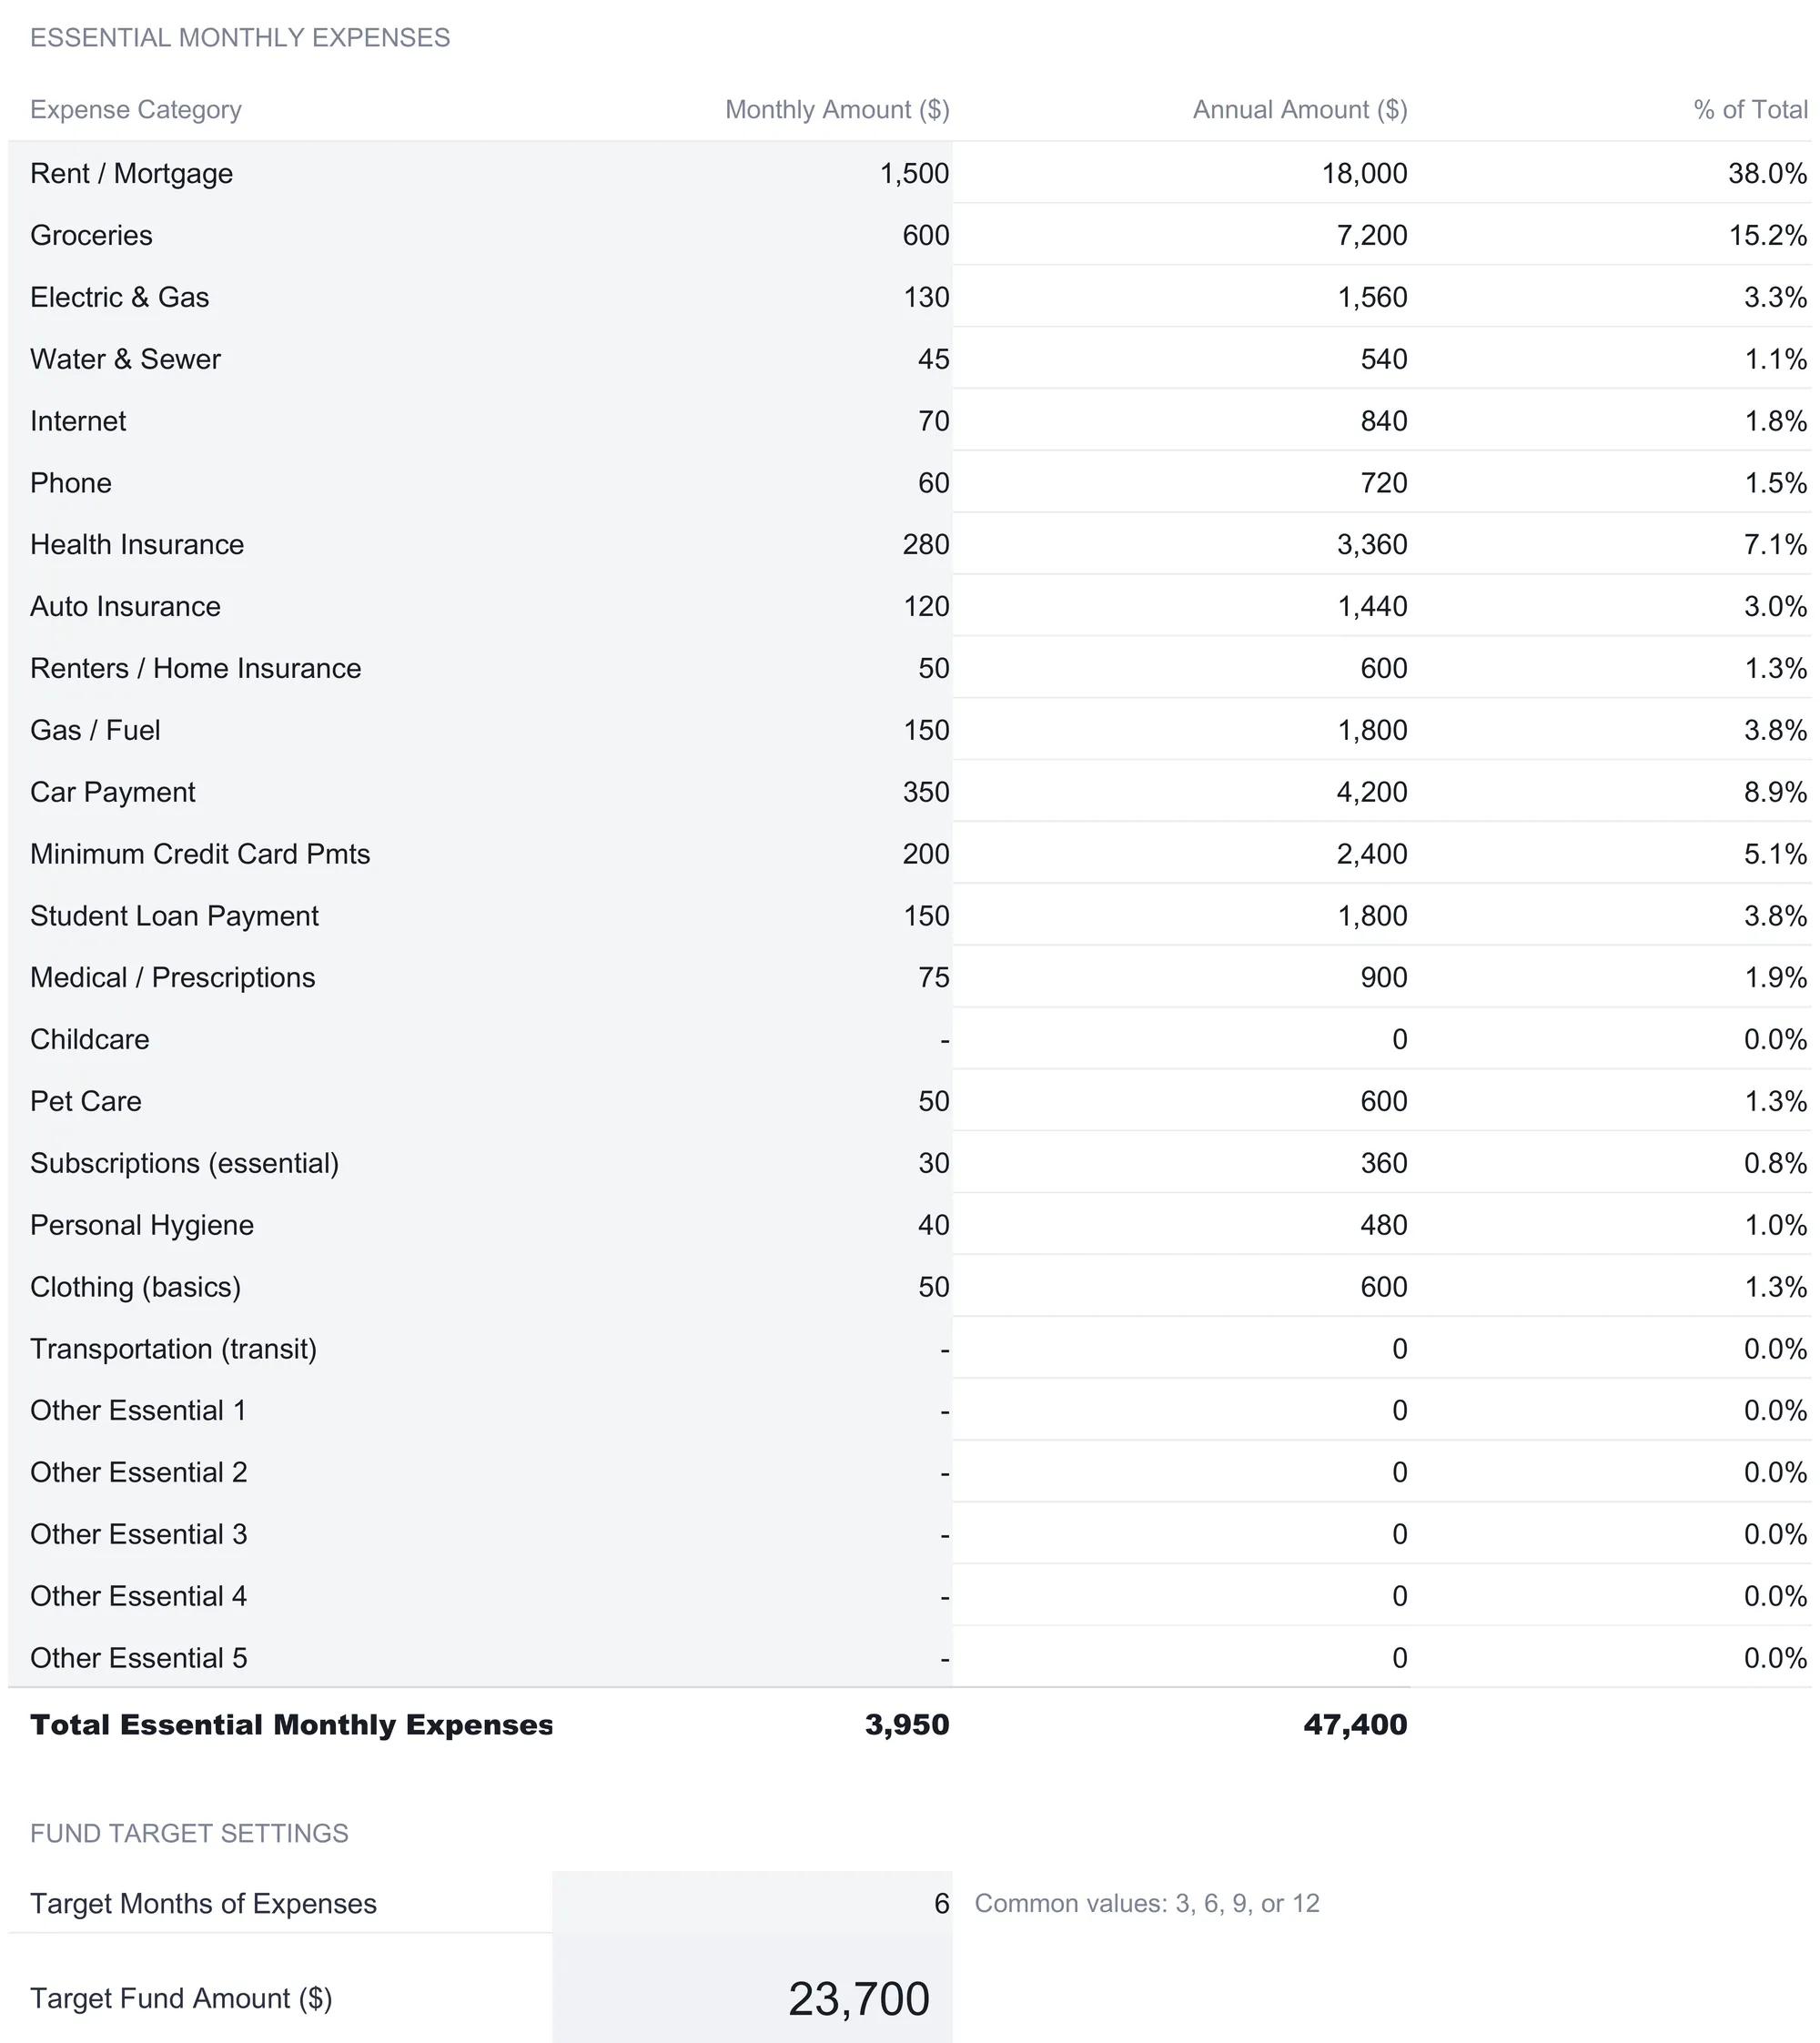
Directly below the table sit two small blocks that turn the total into a plan. The Fund Target Settings block holds the coverage target: a single “Target Months of Expenses” cell, set to 6 in the sample, with a note beside it reading “Common values: 3, 6, 9, or 12.” The target fund amount is then the essentials total times that number, so $3,950 multiplied by 6 gives $23,700. Change the 6 and the target moves with it; the same $3,950 of essentials produces an $11,850 target at three months or a $47,400 target at twelve.
The Savings Details block holds where you stand today: a current emergency fund balance of $8,500 in the sample, a monthly contribution of $500, and an annual interest rate of 4.5 percent for a high-yield savings account. The note beside the rate says to leave it at zero if the account pays none, which keeps the projection honest for a plain checking or cash setup.
A Calculated Results block reads those inputs back as plain-language answers. Progress toward target is $8,500 divided by $23,700, or 35.9 percent. Months of expenses covered is $8,500 divided by $3,950, which the sheet rounds to 2.2. The amount still needed is $15,200. Estimated months to fully funded is 28, computed with the NPER function so the interest is folded in rather than ignored. A “Coverage vs Your Target” line states the position in one sentence, reading “2.2 of 6 months targeted” in the sample. The How to Use sheet adds that this line compares the months your fund covers to the target you set and “has no view on what that target should be.” That is the sheet describing its own restraint: it does the arithmetic and leaves the judgment to you.
Watch the balance grow: the Fund Building Plan
With the inputs in place, the Fund Building Plan projects the fund forward 36 months. Each row shows a starting balance, the monthly contribution, interest earned, an ending balance, and the remaining gap to target. The contribution and rate both pull from the Expense Analysis sheet, so nothing here is typed; change a figure upstream and the whole schedule redraws.
Month one makes the mechanics clear. The fund starts at $8,500, the $500 contribution goes in, and interest of about $32 accrues, which is $8,500 times 4.5 percent divided by twelve. The ending balance is $9,032, and the remaining-to-target column reads $14,668. Month two starts where month one ended, and so on down the sheet. Because the interest is calculated on the running balance rather than the original deposit, the interest column climbs steadily, from about $32 in month one toward $106 by month 36.
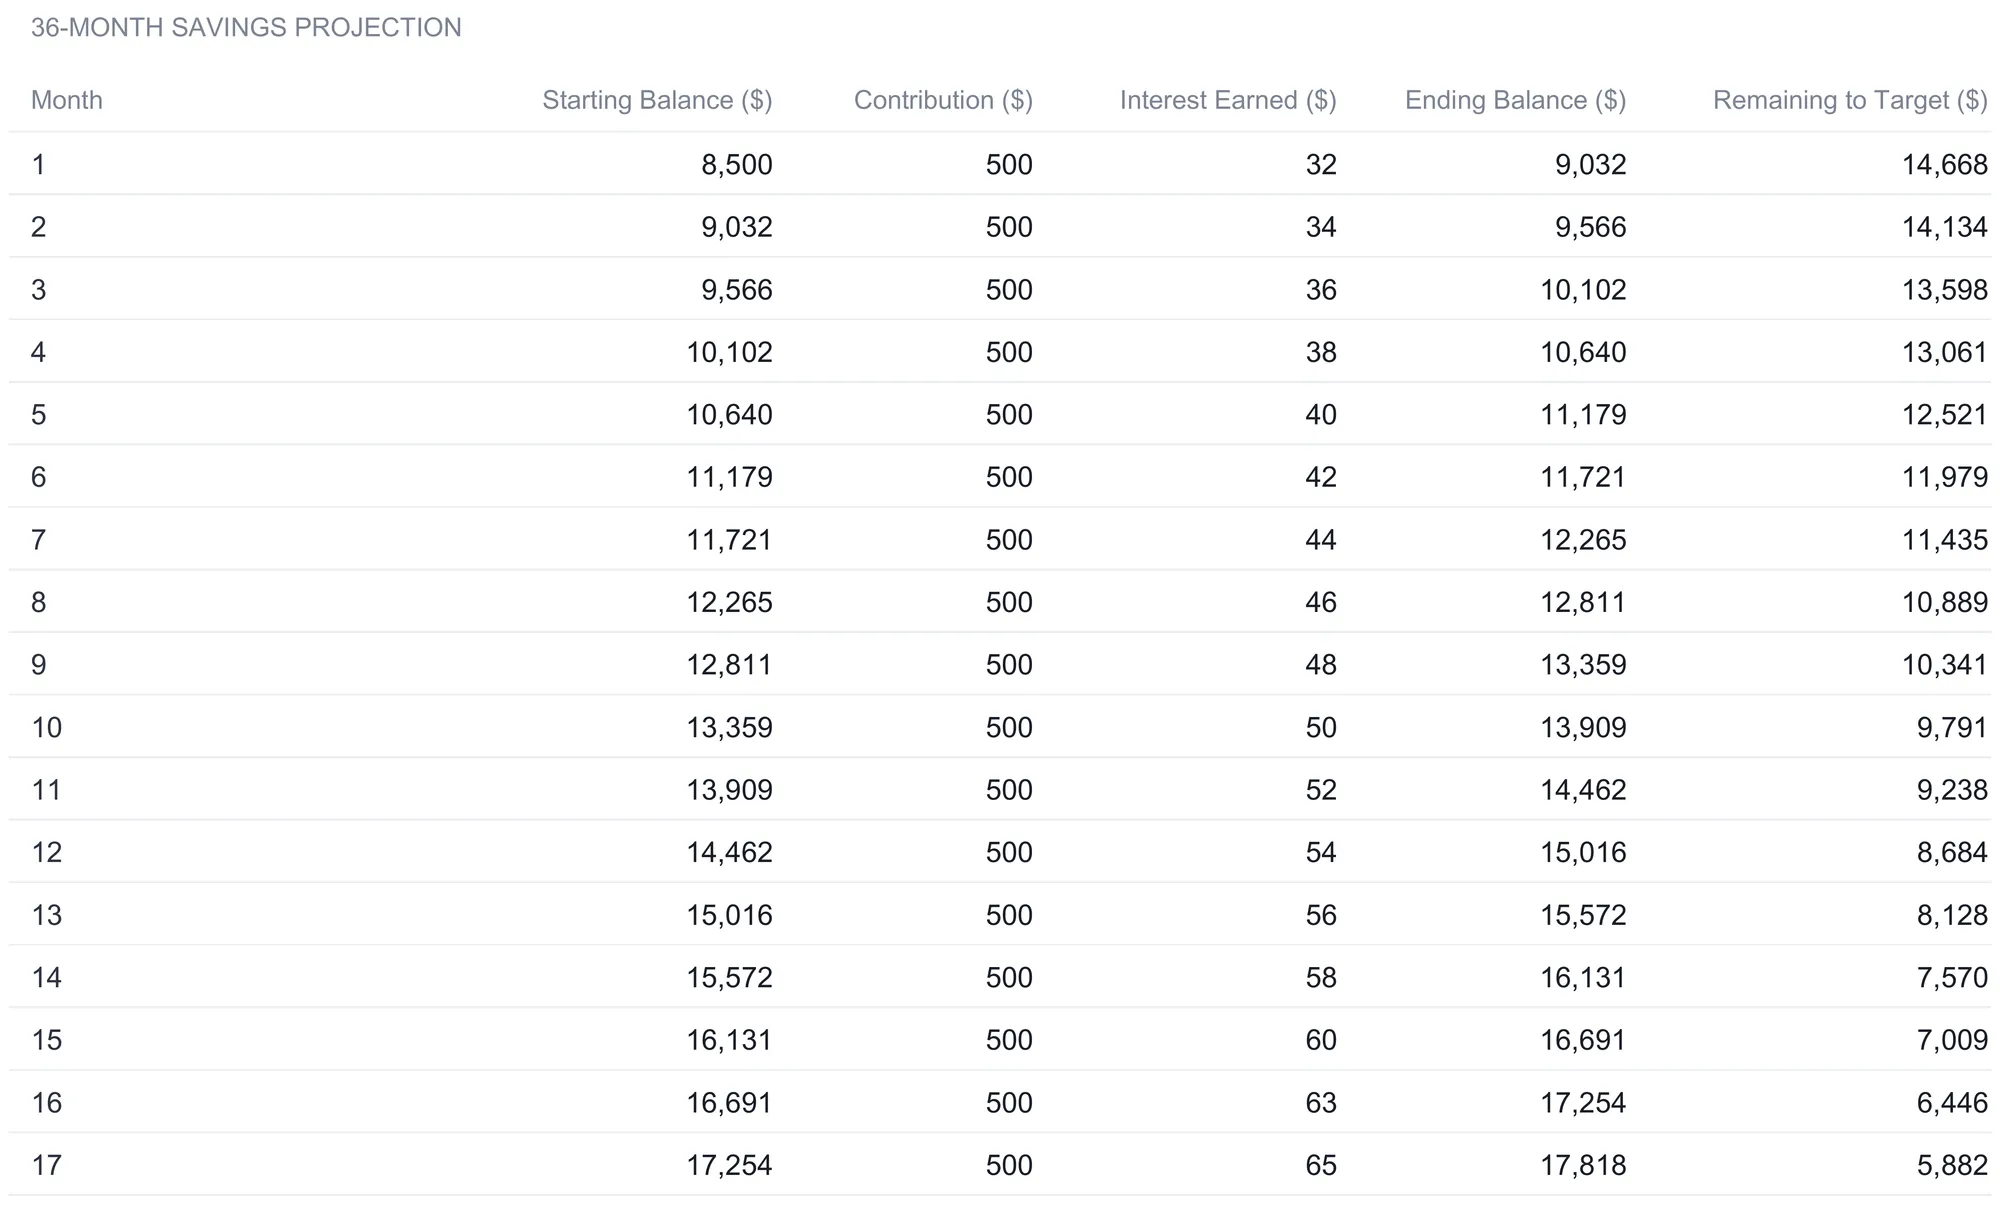
Below the monthly rows, three summary lines total the projection. Total contributions over 36 months come to $18,000, total interest earned to $2,459, and the balance at month 36 to $28,959. A “Target reached in month” line pinpoints when the running balance first crosses the target, which is month 28 for the sample, matching the estimate on the Expense Analysis sheet. The value of laying it out month by month is that the interest is visible as its own column rather than buried in a single end figure. At 4.5 percent the $2,459 of interest is real money, and seeing it accumulate is part of why the high-yield rate is worth entering rather than leaving at zero.
Milestones instead of one distant number: the Tiered Targets sheet
A $23,700 goal is a long way off when you are saving $500 a month, and one distant number is easy to lose sight of. The Tiered Targets sheet breaks the climb into six milestones and tracks progress through each one, so the near ones register as reached long before the far ones come into view.
| Milestone | Target ($) | Current ($) | Progress | Status | Months at pace |
|---|---|---|---|---|---|
| Tier 1 - Starter | 1,000 | 8,500 | 100.0% | Reached | 0 |
| Tier 2 - 1 Month | 3,950 | 8,500 | 100.0% | Reached | 0 |
| Tier 3 - 3 Months | 11,850 | 8,500 | 71.7% | Short of target | 7 |
| Tier 4 - 6 Months | 23,700 | 8,500 | 35.9% | Short of target | 28 |
| Tier 5 - 9 Months | 35,550 | 8,500 | 23.9% | Short of target | 47 |
| Tier 6 - 12 Months (Full) | 47,400 | 8,500 | 17.9% | Short of target | 65 |
The starter tier is a flat figure, $1,000 in the sample, and it is an input rather than a formula, so the first milestone can be set to whatever amount you want to reach first. The rest are multiples of the essentials total: one month is $3,950, three months $11,850, and so on up to a full twelve months at $47,400. Each row shows how far the current $8,500 balance has come as a percentage capped at 100, whether the tier is reached, and how many months it would take to close the gap at the current pace and rate. That last column runs 7 months to three months of coverage, 28 to six, 47 to nine, and 65 to a full year.
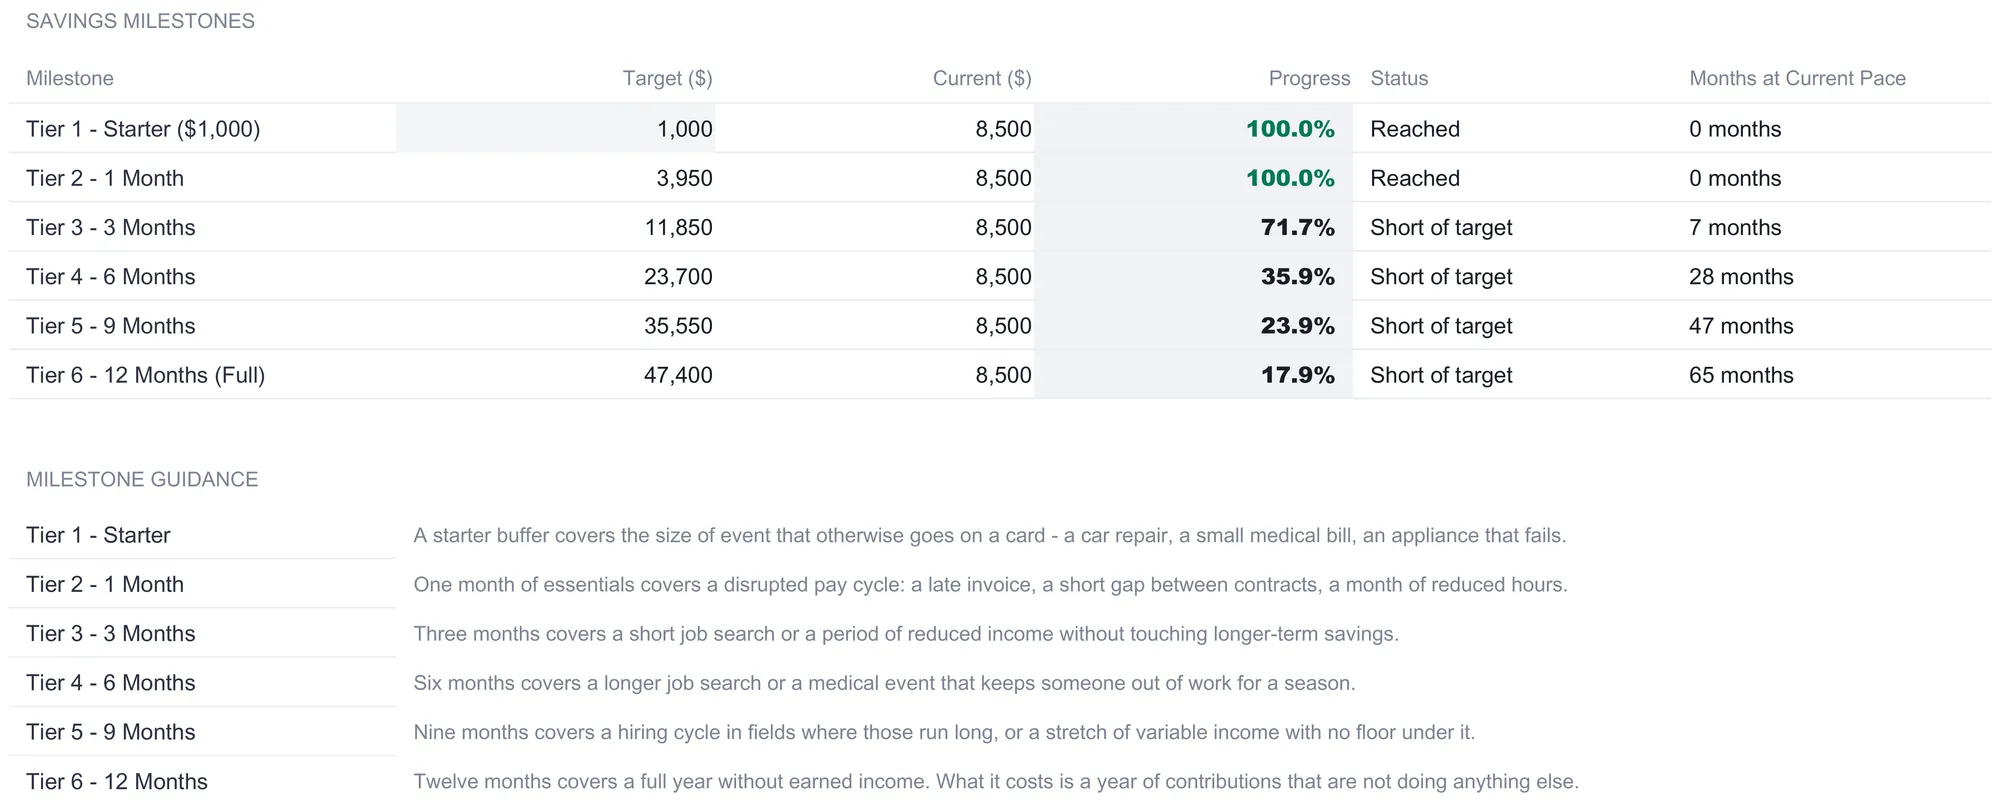
Beneath the table, a Milestone Guidance block describes what each tier tends to cover in plain terms. A starter buffer covers the size of event that otherwise goes on a card, a car repair or a small medical bill. One month covers a disrupted pay cycle. Three months covers a short job search without touching longer-term savings, six months a longer search or a medical event that keeps someone out of work for a season, and twelve months a full year without earned income. These are descriptions of what a given cushion can absorb, not instructions. As the How to Use sheet puts it, “Which one is yours is not something the file decides.” The tiers give you a map of the terrain and leave the destination to you.
Test the plan before committing: the What-If Scenarios sheet
The Expense Analysis sheet answers “how long at my current plan?” with a single number. The What-If Scenarios sheet answers the more useful question of how that number changes if the plan changes, and it does so across a whole grid rather than one input at a time.
The first grid shows months to fully funded for eight contribution levels down the side, from $200 to $1,000 a month, against seven interest rates across the top, from zero to 5 percent. Reading the sample’s own position, $500 a month at 4.5 percent lands at 28 months, matching the other sheets. Move along that row and the effect of the rate alone appears: the same $500 reaches the goal in 31 months at zero interest and 27 months at 5 percent, a four-month spread from rate alone. Move down the column instead and the contribution does the heavy lifting: at 4.5 percent, $200 a month takes 59 months while $1,000 a month takes 15. A dash in any cell would mean that contribution never closes the gap at that rate, though every cell is populated in the sample.
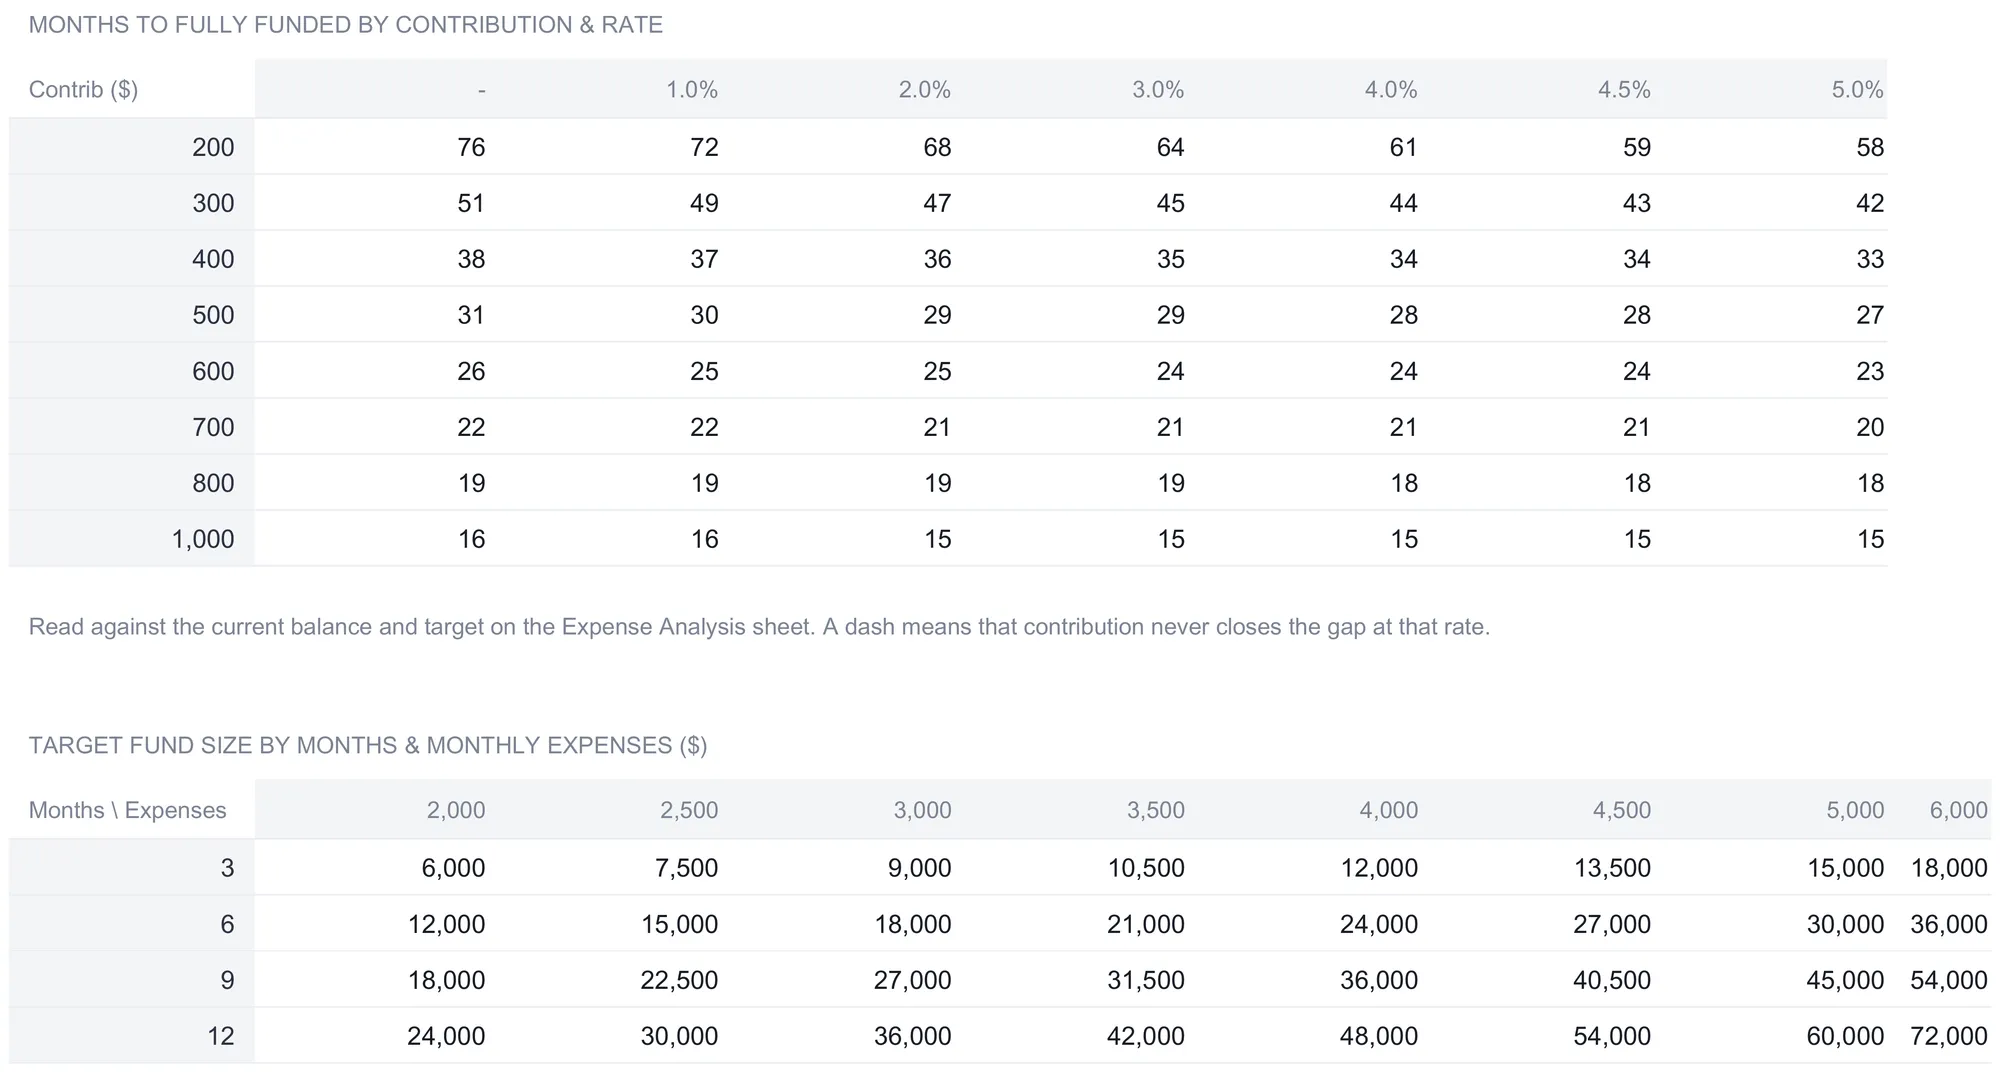
The second grid steps back from the timeline to the target itself. It lays out target fund size for four coverage lengths, three, six, nine, and twelve months, against monthly expense levels from $2,000 to $6,000. It is a ready reckoner for the core calculation: six months at $3,000 of expenses is an $18,000 target, six months at $4,000 is $24,000, and a full year at $5,000 is $60,000. The tinted row and column headings on both grids are editable, so typing your own contribution, rate, or expense figure over a heading recomputes that row or column against your numbers. The point of the sheet is planning rather than prediction: it shows, for example, how much sooner the goal arrives if contributions rise by a few hundred dollars a month.
Stress-test the fund: the Spending Risk Analysis sheet
Sizing the fund answers what to aim for. The Spending Risk Analysis sheet asks a different question: how would the balance you have right now hold up if an emergency actually hit? It pulls the current balance and monthly contribution from the Expense Analysis sheet, $8,500 and $500 in the sample, and runs a set of scenarios against them.
| Scenario | Estimated cost ($) | Fund after event ($) | Depleted? | Months to replace |
|---|---|---|---|---|
| Job Loss (3 months) | 11,850 | -3,350 | Yes - shortfall 3,350 | 24 |
| Job Loss (6 months) | 23,700 | -15,200 | Yes - shortfall 15,200 | 48 |
| Medical Emergency | 8,000 | 500 | No | 16 |
| Major Car Repair | 3,500 | 5,000 | No | 7 |
| Home Repair | 5,000 | 3,500 | No | 10 |
| Combined: Job + Medical | 19,850 | -11,350 | Yes - shortfall 11,350 | 40 |
Each row subtracts a cost from the $8,500 balance. Where the result is positive, the fund absorbs the event: a $3,500 car repair leaves $5,000, an $8,000 medical bill leaves $500. Where it is negative, the fund runs short, and the sheet spells out the gap. A three-month job loss costing $11,850 leaves a $3,350 shortfall, and a six-month job loss costing $23,700 leaves the fund $15,200 short, which is exactly the amount the Expense Analysis sheet says is still needed to reach the six-month target. The final column shows how many months of $500 contributions each cost is worth, so the three-month job loss represents 24 months of saving and the combined job-plus-medical event 40 months.
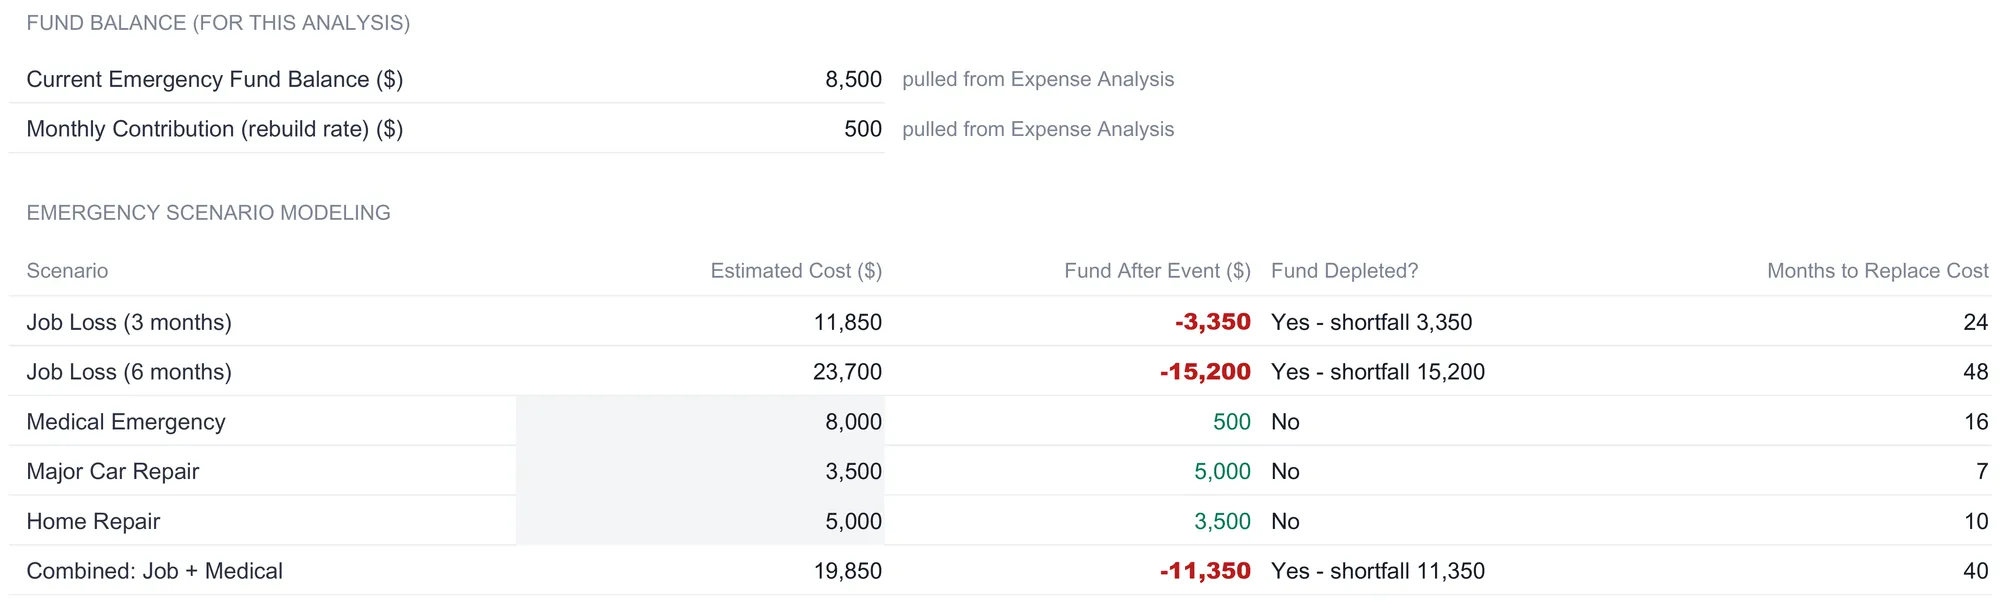
Three of the rows are not free inputs. The two job loss lines are computed from your own essentials total, three and six months of it, so they track your figures automatically, and the combined row adds the three-month job loss to the medical estimate. The other cost cells are editable, so a medical estimate or a repair figure can be set to match your own situation. What the sheet is doing is making the abstract idea of “enough” concrete. A fund can look healthy against a car repair and thin against a job loss at the same time, and laying the events side by side is what shows where the current balance sits between those cases.
The dashboard: six numbers at the top
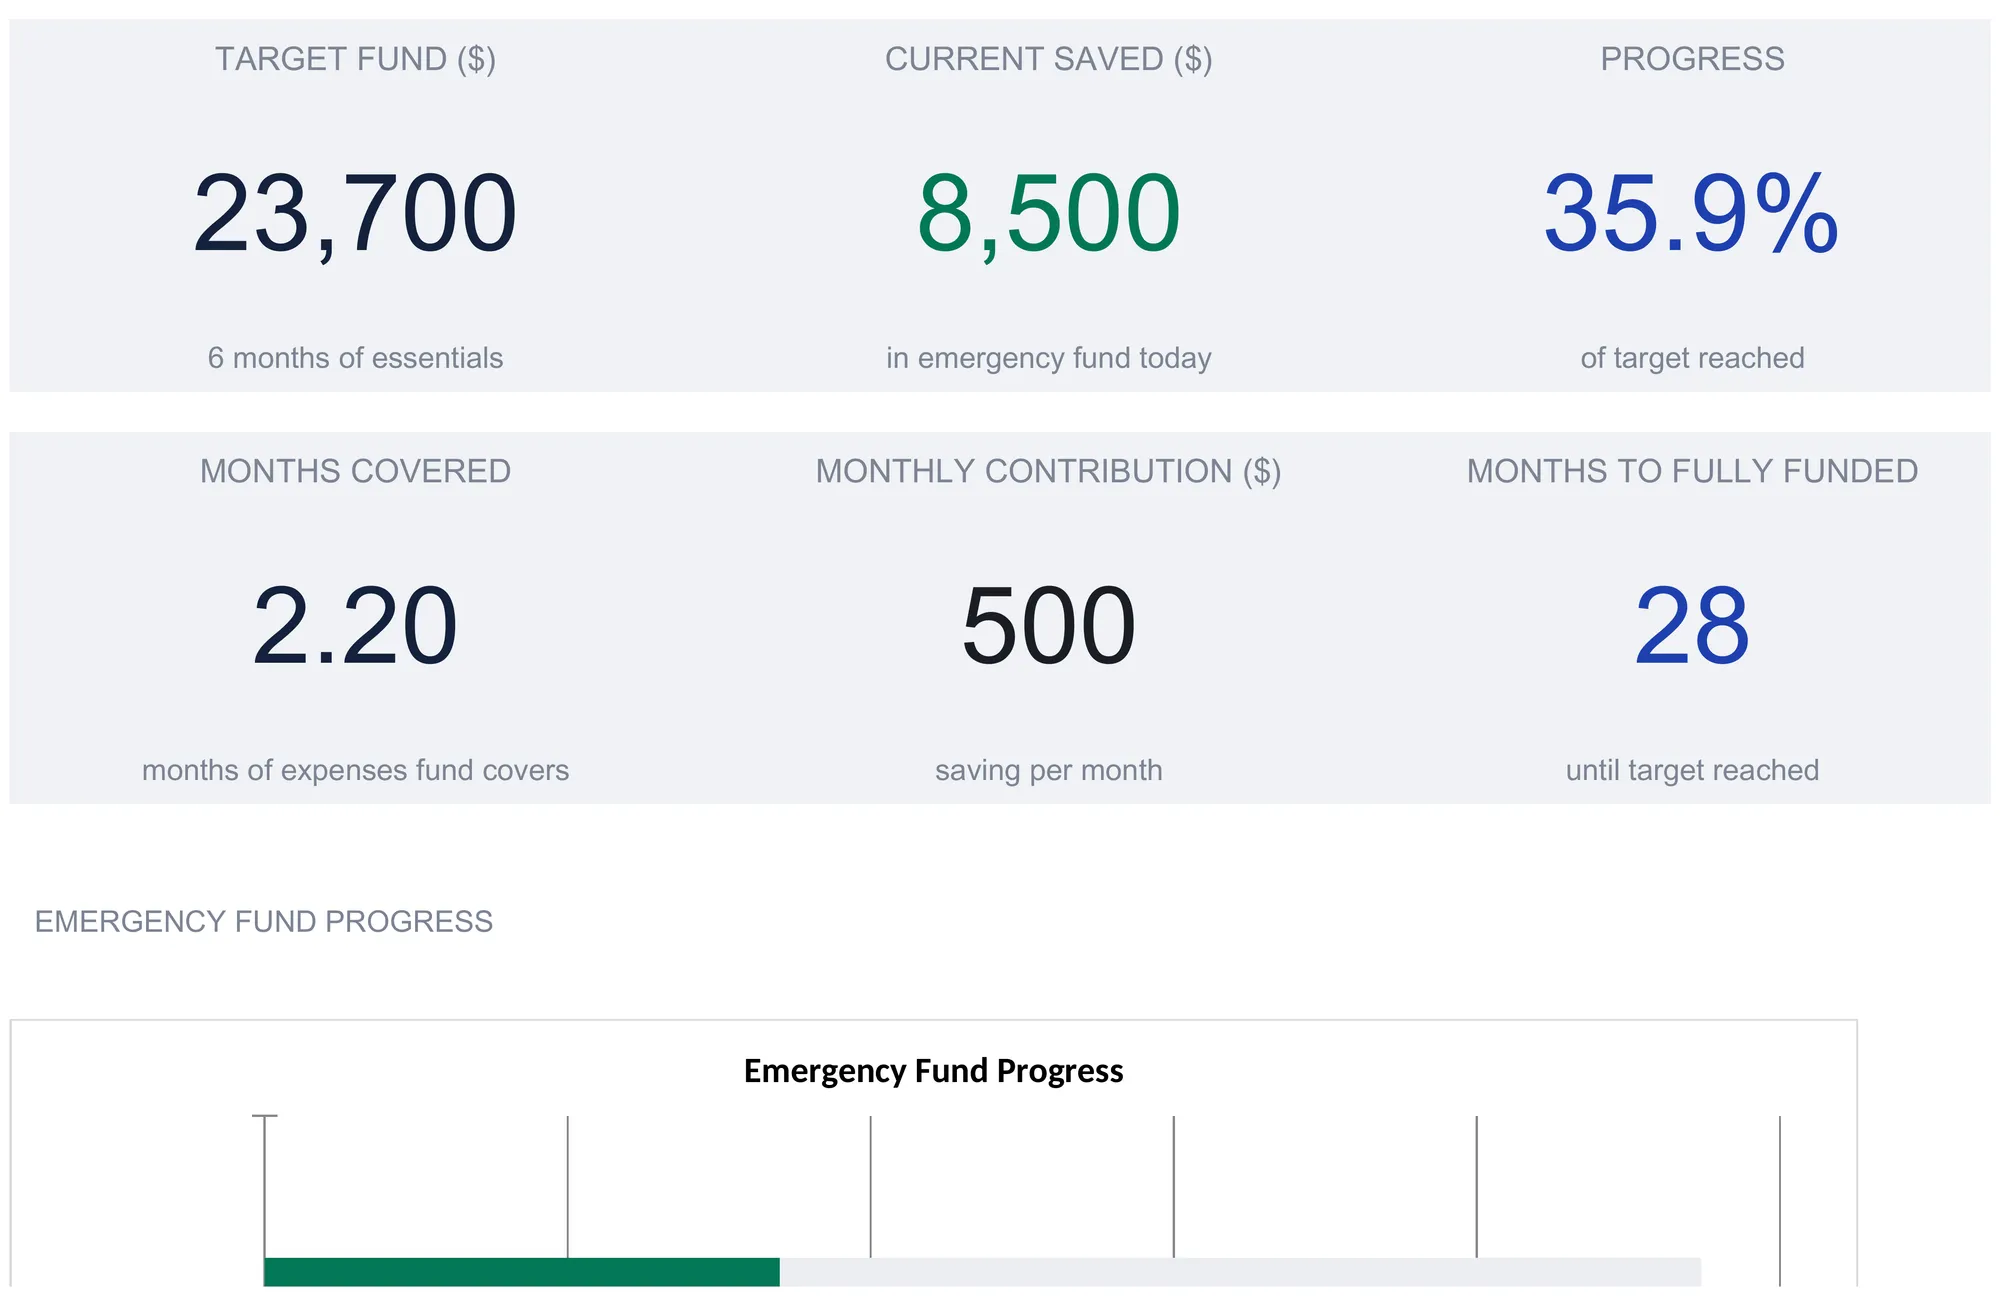
The Dashboard is the sheet you open first once the inputs are set, and every figure on it is computed from the sheets behind it. Six KPI tiles carry the headline figures: the $23,700 target fund with “6 months of essentials” beneath it, the $8,500 current balance, 35.9 percent progress, 2.20 months covered, the $500 monthly contribution, and 28 months to fully funded. Every tile pulls from the sheets already described, so the dashboard and the detail can never drift apart.
Below the tiles, an Emergency Fund Progress bar splits the target into the current balance and the amount still remaining, and a Savings Growth Projection line chart plots the balance at seven checkpoints, months 1, 6, 12, 18, 24, 30, and 36, against the flat target line, with the two crossing between the month 24 and month 30 points. Because the currency selector next to the title feeds every money label in the workbook, switching it relabels each column header and tile at once. It relabels only, with no conversion of the underlying numbers, so the figures stay put while the symbol changes.
What the coverage target means, and what it does not
The template leans on a months-of-coverage figure, and it is worth being clear about where that number comes from. The sheet offers 3, 6, 9, and 12 as common values and defaults the sample to 6, but those are starting points the file exposes for editing, not a figure it recommends. The judgment about which one fits a given household stays with the household, which is why the sheet repeatedly says it totals what you enter and takes no position on the target.
The idea of a months-based cushion is well established at the public financial authorities. The SEC’s Investor.gov describes keeping a rainy-day reserve and notes that “some make sure they have up to six months of their income in savings so that they know it will absolutely be there for them when they need it,” in its Save for a Rainy Day explainer. The Consumer Financial Protection Bureau takes a more individualized line, writing in its guide to building an emergency fund that “the amount you need to have in an emergency savings fund depends on your situation” and pointing readers to their own past unexpected expenses as a reference. The template sits comfortably between those two framings: it lets you set the months figure yourself and then does the arithmetic that turns it into a dollar target, a timeline, and a set of stress tests.
Excel or Google Sheets for an emergency fund calculator
The workbook is a plain .xlsx file with no macros and no add-ons, built on standard functions such as NPER, EDATE, COUNTIF, TEXT, and ROUND that all three major spreadsheet apps share. That means it runs the same in Microsoft Excel, in Google Sheets after upload, and in LibreOffice Calc. The tinted cells are the ones you fill in and the white cells hold the formulas, a convention the How to Use sheet spells out so nothing important gets overwritten. Google Sheets suits anyone who wants the file on their phone and synced across devices; Excel suits those who prefer a local file. The structure described here is equally buildable in either if you would rather assemble your own.
Which template fits
- Emergency Fund Calculator Ultimate Spreadsheet Template ($29) is the workbook this walkthrough follows: the Expense Analysis inputs, the 36-month Fund Building Plan, the six-tier Tiered Targets view, the two What-If grids, the Spending Risk Analysis stress test, and the six-tile dashboard, all driven from one essentials total.
- The free Emergency Fund Calculator is a single working sheet: it takes one monthly essentials figure, a months-of-runway goal, your current savings and your monthly contribution, and returns the target fund size, the amount still needed, and the months and years to reach it at that contribution. The Emergency Fund Calculator Essentials ($19) sits between the two, adding an eight-line expense list, a 36-month progress tracker that applies a savings rate, and a dashboard.
- Savings Goal Tracker Ultimate Spreadsheet Template ($29) is the companion for savers running more than one goal at once. Where the emergency fund calculator goes deep on the single cushion, sizing it against your own expenses and stress-testing it, the savings goal tracker spreads a slate of goals across one dashboard, each with its own target, deposit log, and timeline. Many people keep both, using the emergency fund as the first goal and the tracker for the vacation, the down payment, and the rest.
Related
- Emergency Fund Calculator: How Much Do You Really Need? - the concept behind the target, with the months-of-expenses reasoning worked through in plain language
- When to Recalculate Your Emergency Fund - the life events that move the essentials total, and why the target is not a set-and-forget number
- Best High-Yield Savings Accounts for Emergency Funds - what the rate cell behind the fund-building plan is asking for, and how account choice affects the interest column
- Average Emergency Fund by Income Bracket (2026 Data) - how the balances people actually hold compare across income levels
Frequently asked questions
How does the spreadsheet decide how big my emergency fund should be?
It does not decide - you do. The target fund amount is your total essential monthly expenses multiplied by a months-of-coverage figure you type into one cell. In the sample, $3,950 of essentials times a 6-month setting gives a $23,700 target. Change the 6 to 3, 9, or 12 and the target and every downstream view recompute. The sheet notes common values of 3, 6, 9, or 12 and totals whatever you enter, but it has no view on which one fits your situation.
Why does it separate essential expenses from everything else?
Because an emergency fund is meant to cover the costs that continue during a crisis, not a normal month of spending. The Expense Analysis sheet asks only for essentials such as housing, food, utilities, insurance, and minimum debt payments, and which lines count as essential is left to you. A fund sized against full discretionary spending would be larger than the cushion the template is modeling, so the target is built on the essentials total alone.
Does the fund-building plan account for interest?
Yes. The Fund Building Plan compounds a high-yield savings rate monthly. Each row applies the annual rate divided by twelve to the running balance, so the sample's 4.5 percent adds $2,459 of interest on top of the $8,500 opening balance and $18,000 of contributions over 36 months, ending at $28,959. Set the rate to zero and the interest column drops out, leaving a straight contribution schedule.
What does the Spending Risk Analysis sheet actually show?
It subtracts a set of emergency costs from your current balance to show what the fund would absorb and what it would not. With $8,500 saved, the sample's major car repair of $3,500 leaves $5,000, while a six-month job loss costing $23,700 leaves a $15,200 shortfall. It also shows how many months of contributions each cost is worth at your current rate. The two job loss rows follow your own expense total and the combined row adds two of the rows above it, while the medical, car repair, and home repair costs are editable.
Can I use it in Excel and Google Sheets?
Both. The file is a plain .xlsx with no macros, built on standard functions such as NPER, EDATE, COUNTIF, and ROUND, so it runs the same in Microsoft Excel, Google Sheets after upload, and LibreOffice Calc. The tinted cells are the inputs and the white cells hold the formulas.
Sources
- An essential guide to building an emergency fund - Consumer Financial Protection Bureau
- Save for a Rainy Day - U.S. Securities and Exchange Commission (Investor.gov)
About this article
Every figure, column name, formula, chart and feature description checked on 2026-09-10 against the shipped Emergency Fund Calculator Ultimate workbook (Dashboard, Expense Analysis, Fund Building Plan, Tiered Targets, What-If Scenarios, Spending Risk Analysis, How to Use), and the Free and Essentials Emergency Fund Calculator workbooks for the tier comparison. CFPB and SEC Investor.gov references checked against the live pages at writing time. Last reviewed September 2026.