A personal financial statement spreadsheet joins a net worth sheet to an income and expenses sheet, then derives the rest: five financial ratios against benchmarks, a three-year comparison, a dashboard, and a one-page lender summary formatted for a loan application. This walkthrough follows the full structure with a worked example, a household holding $579,000 in assets against $230,000 in debt for $349,000 of net worth, $6,500 of monthly income, and a 43.1 percent debt-to-income ratio. Our Personal Financial Statement Ultimate Spreadsheet Template ($29) ships the same structure ready-made for Excel and Google Sheets.
At some point a scattered picture of your money has to become a single document. A mortgage application asks for one. A business loan or a line of credit asks for one. So does the quieter moment when you simply want to know where a year of saving and paying down debt has actually left you. That document has a name, the personal financial statement, and it is more than a net worth figure. It sets out what you own and what you owe, what comes in and what goes out, and the handful of ratios a lender reads to size up the two together. Most people can name their salary and guess at their savings. Far fewer can produce, on one page, the assets, the liabilities, the monthly cash flow, and the debt-to-income ratio that a bank will ask for by name. The gap between those two states is structure, and a spreadsheet closes it.
That structure is six sheets that build on each other: a net worth sheet of assets and liabilities, a monthly income and expenses sheet, a set of financial ratios drawn from both, a three-year comparison, a dashboard that reads it all back, and a lender-ready summary formatted as a one-page bank document. The examples below come from our Personal Financial Statement Ultimate Spreadsheet Template ($29), which ships the whole thing ready-made for Excel and Google Sheets. Everything it does is reproducible by hand if you would rather build your own personal financial statement spreadsheet from scratch.
What a personal financial statement holds that a net worth tracker does not
A net worth tracker and a personal financial statement start from the same place and part ways quickly. Tracking net worth in a spreadsheet answers one clean question, what you own minus what you owe, and follows the answer month by month. That is exactly the right tool when the goal is to watch a single number climb. A personal financial statement is the document a lender or a serious year-end review asks for instead, and it carries three things a pure net worth file leaves out.
- Cash flow, not just a balance. Alongside assets and liabilities sits a full income and expenses sheet, so the statement shows not only what a household is worth but what it earns and spends each month. A lender cares as much about the second as the first.
- Ratios, not just totals. Five financial ratios read the two sides against each other, debt-to-income, debt-to-asset, savings rate, liquidity, and housing expense, each compared to a common benchmark. A total tells you the size of things; a ratio tells you the shape.
- A lender-ready output. A dedicated summary sheet gathers the whole picture onto one printable page, headed Personal Financial Statement, with an applicant block, a financial summary, and a signature line. It is the form a bank hands you, rebuilt so the numbers fill themselves in.
The walkthrough below follows the six sheets in the order the work happens, starting with the assets and liabilities that everything else reads back from, and a How to Use sheet carries the same instructions inside the file.
Build the balance sheet: the Assets & Liabilities sheet
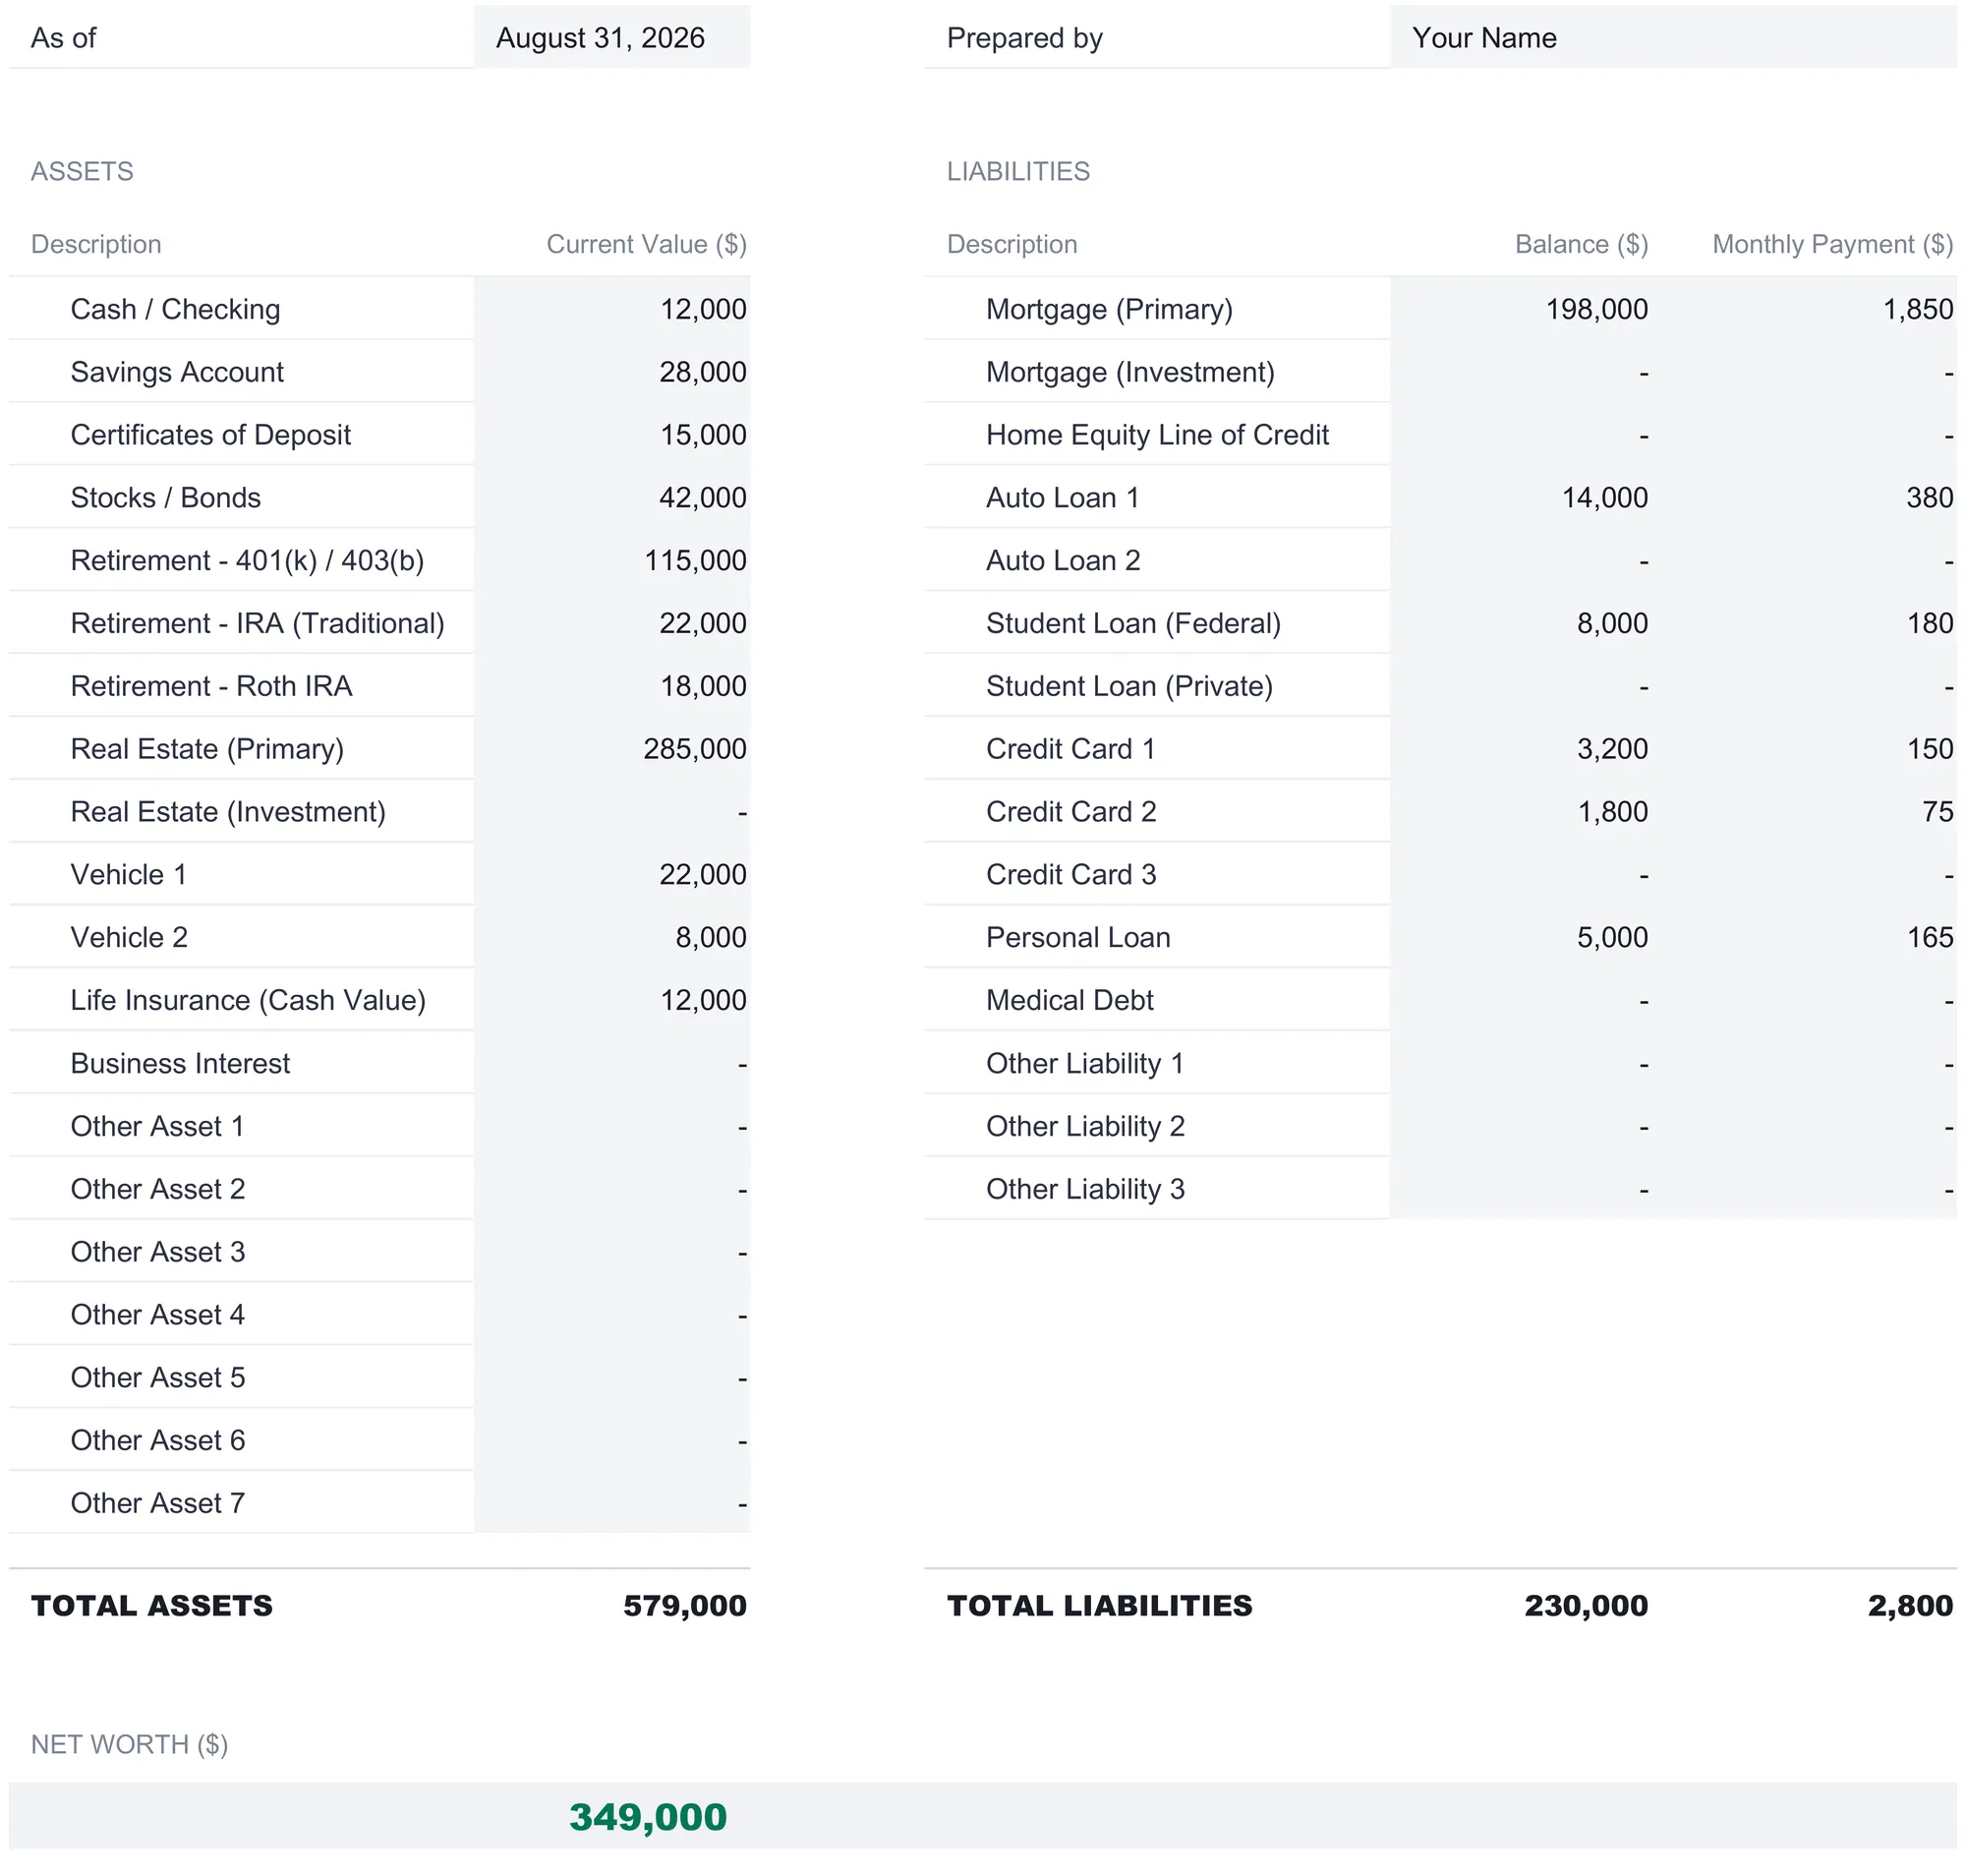
This is the foundation, and every other sheet reads from it. It is laid out as a two-column ledger: assets down the left, liabilities down the right, with a net worth figure struck across the bottom. The header carries an As of date, August 31, 2026 in the sample, and a Prepared by field reading Your Name, because a personal financial statement is always a snapshot on a stated day rather than a rolling figure.
The asset side gives twenty labeled rows so a household lists its holdings by kind rather than lumping them together. The sample fills eleven of them: $12,000 in cash and checking, $28,000 in a savings account, $15,000 in certificates of deposit, $42,000 in stocks and bonds, $115,000 in a 401(k) or 403(b), $22,000 in a traditional IRA, $18,000 in a Roth IRA, $285,000 in a primary residence, $22,000 and $8,000 in two vehicles, and $12,000 of cash value in a life insurance policy. Rows for investment real estate, a business interest, and seven spare Other Asset lines sit ready at zero. Added up, total assets come to $579,000.
The liability side runs fifteen rows, and it does something the asset side does not: it carries both a balance and a monthly payment. In the sample the primary mortgage shows a $198,000 balance against an $1,850 monthly payment, one auto loan $14,000 against $380, a federal student loan $8,000 against $180, two credit cards at $3,200 and $1,800 against $150 and $75, and a personal loan $5,000 against $165. Total liabilities come to $230,000, and the monthly-payment column adds separately to $2,800. That second total matters more than it looks, because it is what the debt-to-income ratio later divides, and keeping the payment beside the balance is what lets one sheet feed both a balance-sheet view and a cash-flow ratio.
Net worth falls out at the bottom as total assets minus total liabilities, $579,000 less $230,000, or $349,000, and it prints in green because the figure is positive. A negative result would show in red instead, which is the file’s quiet way of flagging the one number nobody wants to misread.
Record the cash flow: the Income & Expenses sheet
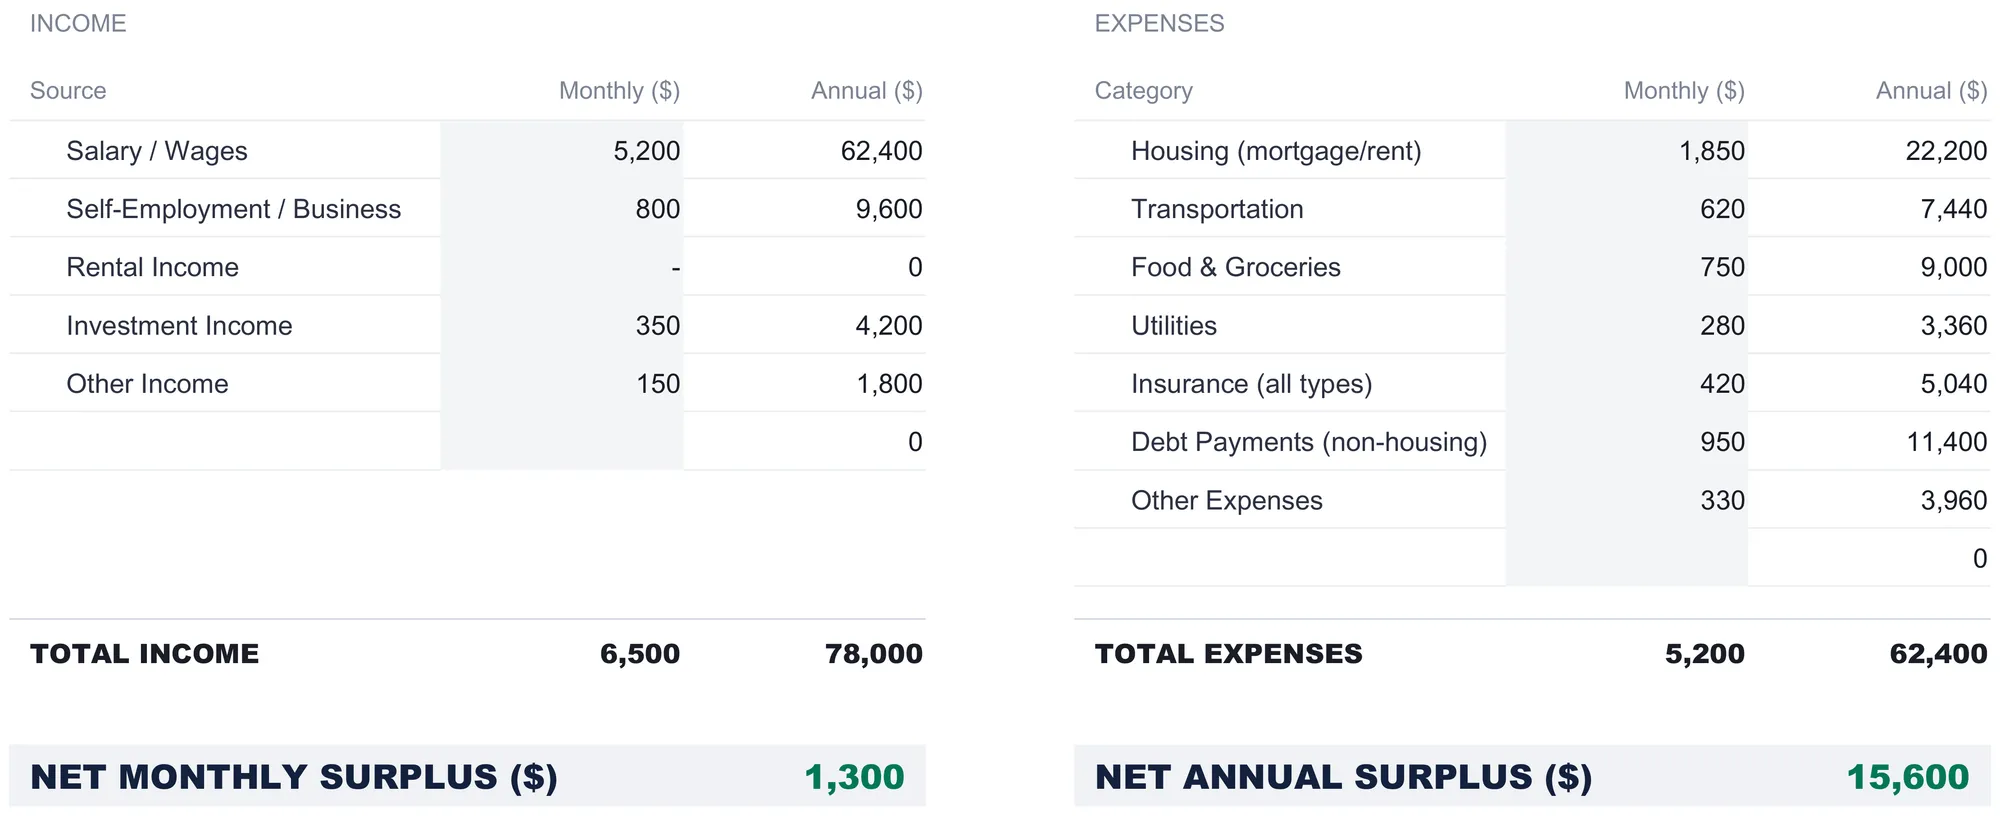
A balance sheet is a photograph; the Income & Expenses sheet is the motion behind it. It is where the statement records what the household earns and spends in a month, and it is laid out as two facing tables with a monthly figure typed in and an annual figure computed beside it as monthly times twelve.
Income runs five sources. The sample carries $5,200 in salary and wages, $800 in self-employment or business income, nothing in rental income, $350 in investment income, and $150 in other income, for $6,500 a month and $78,000 a year. Expenses run seven categories kept deliberately broad so the sheet stays quick to fill: $1,850 in housing, $620 in transportation, $750 in food and groceries, $280 in utilities, $420 in insurance of all kinds, $950 in non-housing debt payments, and $330 in other expenses, adding to $5,200 a month and $62,400 a year.
The two totals meet at the bottom in a net surplus. Income of $6,500 less expenses of $5,200 leaves a net monthly surplus of $1,300, and the annual line multiplies that to $15,600. Like net worth, a negative surplus would display in red, so a month that spends more than it earns is impossible to overlook.
| Line | Monthly | Annual |
|---|---|---|
| Total income | $6,500 | $78,000 |
| Total expenses | $5,200 | $62,400 |
| Net surplus | $1,300 | $15,600 |
One column here does double duty. The housing figure of $1,850 is both a line in this sheet and the numerator of the housing expense ratio two sheets over. The $950 of non-housing debt payments stays inside the expense total, because the debt-to-income ratio reads the $2,800 payment column on the liability sheet rather than this row. Entering cash flow once and letting the ratios read it is the design choice that keeps the whole statement internally consistent, so a change to a single monthly figure moves every downstream number that depends on it.
Read the shape: the Financial Ratios sheet
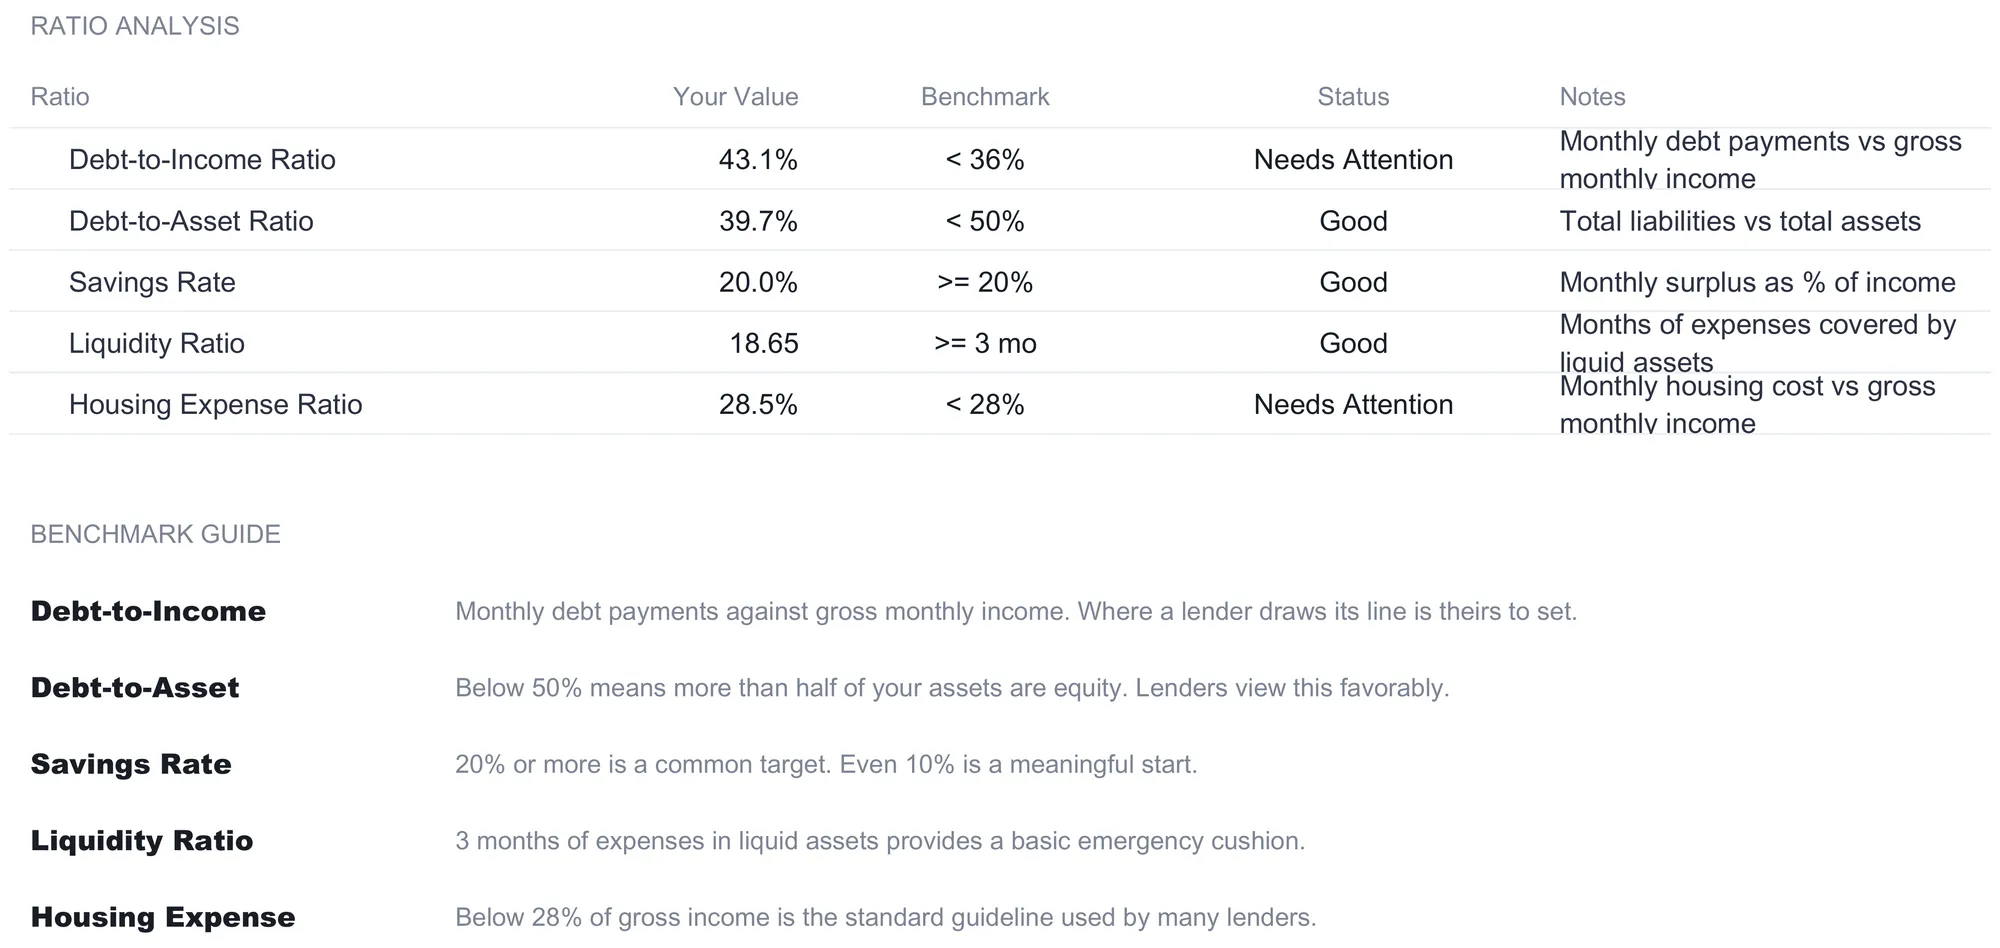
With a balance sheet and a cash-flow sheet in place, the Financial Ratios sheet reads the two against each other. It computes five ratios, and for each it shows the value, a benchmark, a Good or Needs Attention status, and a plain-language note. The point of the sheet is that a number read against a reference point says more than the same number read alone.
- Debt-to-income ratio, 43.1 percent. Monthly debt payments of $2,800 divided by gross monthly income of $6,500. The benchmark is set at under 36 percent, so the sample lands on Needs Attention. This is the ratio a lender leans on hardest, and the Consumer Financial Protection Bureau describes it simply as all monthly debt payments divided by gross monthly income, with the caveat that different loan products and lenders apply different limits.
- Debt-to-asset ratio, 39.7 percent. Total liabilities of $230,000 divided by total assets of $579,000, benchmark under 50 percent, status Good. It measures how much of what the household holds is still owed rather than owned.
- Savings rate, 20.0 percent. The monthly surplus of $1,300 as a share of $6,500 of income, benchmark 20 percent or more, status Good. The formula floors the result at zero, so a deficit month reads as a savings rate of nothing rather than a negative figure.
- Liquidity ratio, 18.65 months. The liquid pool, cash, savings, certificates of deposit, and stocks and bonds, totaling $97,000, divided by monthly expenses of $5,200, benchmark three months or more, status Good. It answers how long the household could cover its costs from marketable assets alone.
- Housing expense ratio, 28.5 percent. Housing of $1,850 divided by income of $6,500, benchmark under 28 percent, status Needs Attention. It isolates the single largest recurring cost most households carry.
Two of the five land on Needs Attention in the sample, and that is worth sitting with, because it shows the sheet is doing its job rather than flattering the numbers. A benchmark guide below the table spells each one out in words, and it is careful about what a benchmark is. On debt-to-income it notes that where a lender draws its line is theirs to set; on savings rate it offers that 20 percent is a common target while even 10 percent is a meaningful start. The ratios describe a situation. They stop short of telling anyone what to do about it, and that restraint is deliberate.
Watch the trend: the Multi-Period sheet
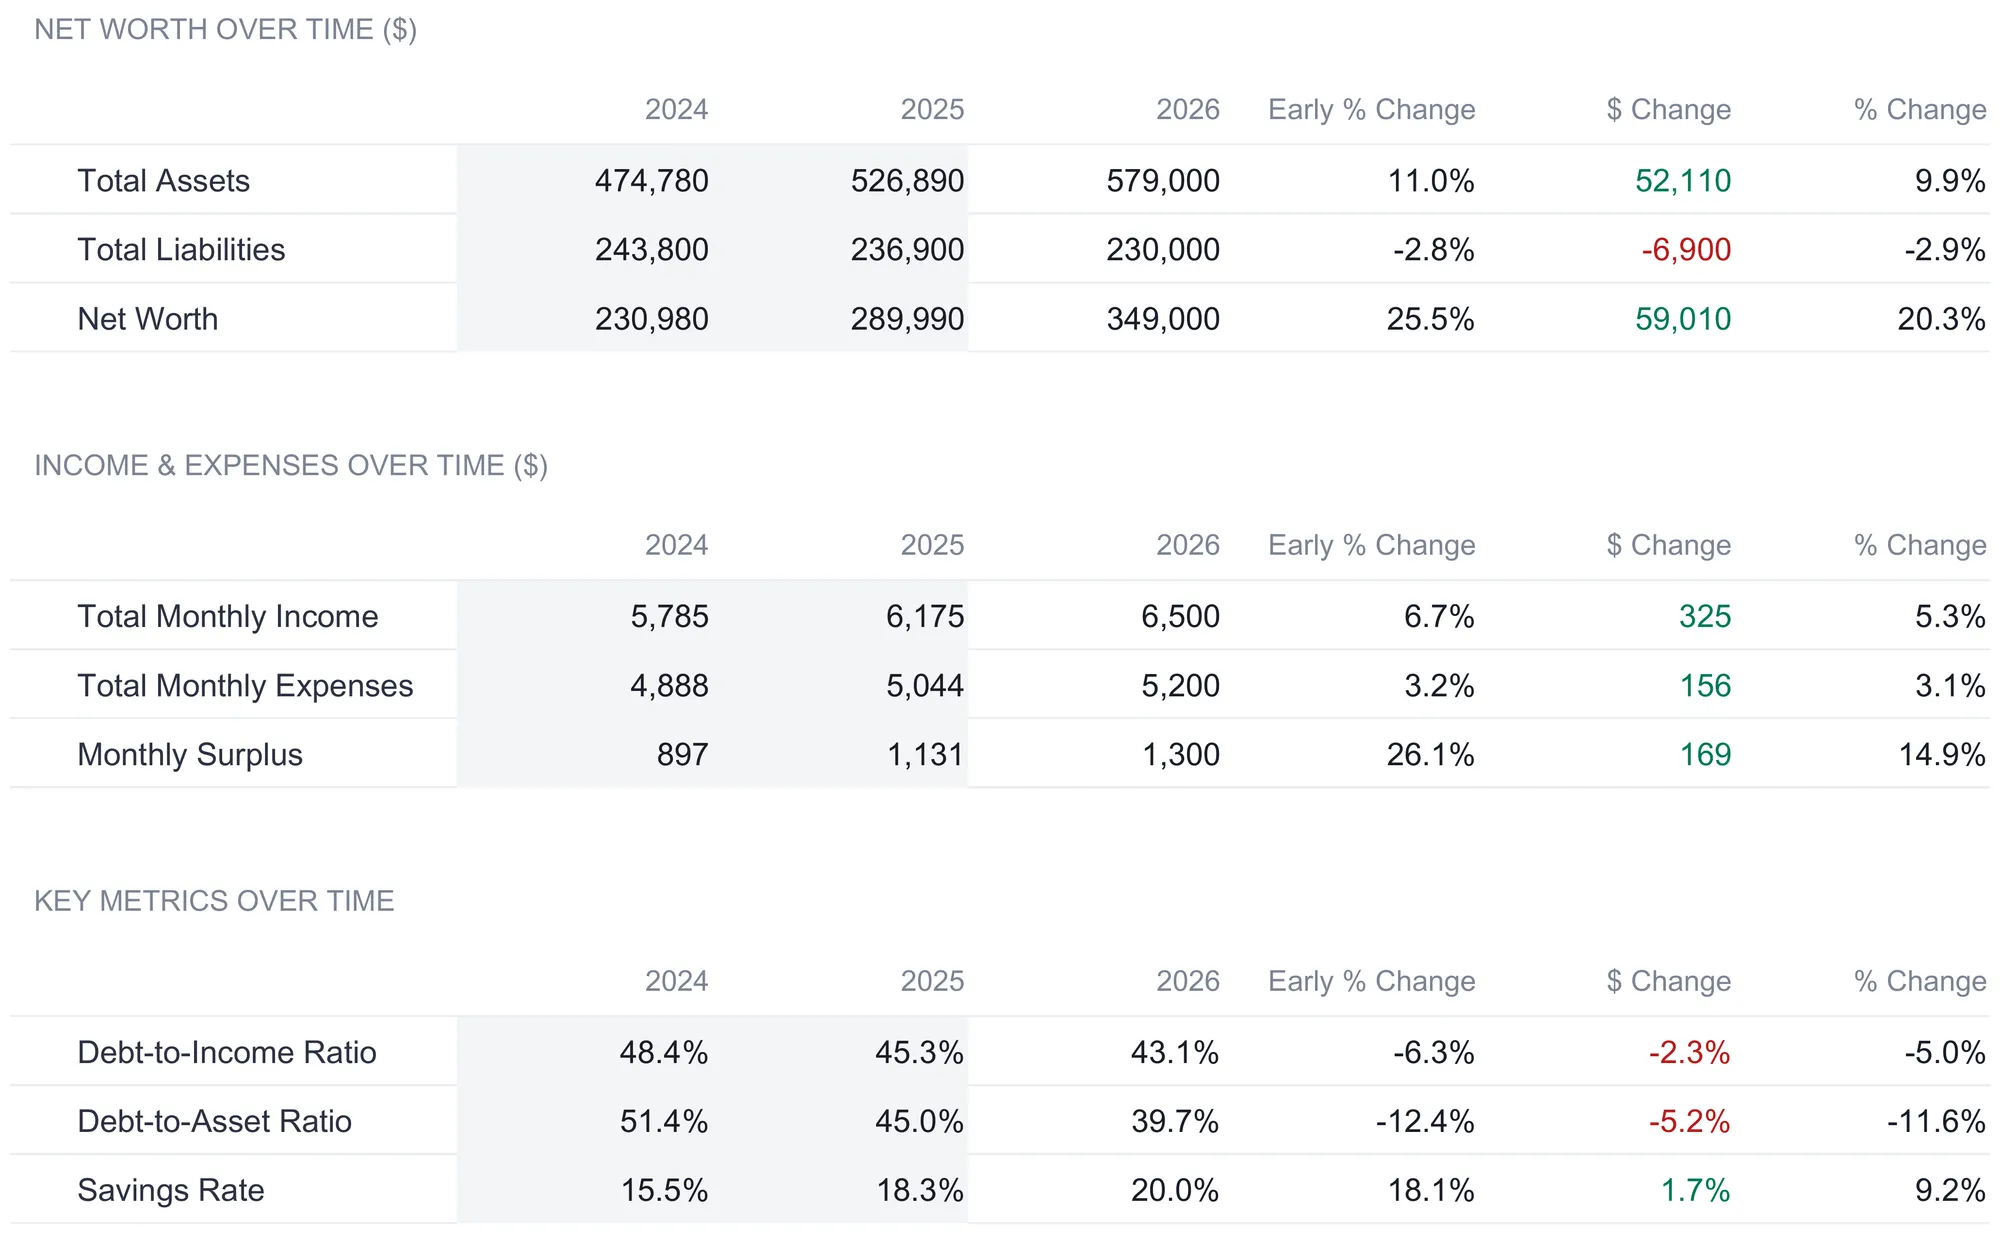
A single statement is a photograph on one date. The Multi-Period sheet turns three of them into a story, comparing 2024, 2025, and 2026 across the same lines. Its arrangement is worth understanding: the two earlier years are typed in by hand from your own records, while the current-year column pulls automatically from the sheets already built, so this year’s numbers never have to be entered twice. Each row then carries three change columns, headed Early % Change, $ Change, and % Change, so the move between the two earlier years and the move into the latest one are both explicit.
The net worth block tells the headline. Total assets climb from $474,780 to $526,890 to $579,000, total liabilities ease from $243,800 to $236,900 to $230,000, and net worth rises from $230,980 to $289,990 to $349,000, a $59,010 gain of 20.3 percent in the latest year. A statement that shows assets rising while debt falls is the shape a lender likes to see, and the trend makes that legible in a way a single snapshot cannot.
| Line | 2024 | 2025 | 2026 |
|---|---|---|---|
| Total assets | $474,780 | $526,890 | $579,000 |
| Total liabilities | $243,800 | $236,900 | $230,000 |
| Net worth | $230,980 | $289,990 | $349,000 |
The cash-flow block runs underneath, with monthly income moving from $5,785 to $6,175 to $6,500, monthly expenses from $4,888 to $5,044 to $5,200, and the monthly surplus from $897 to $1,131 to $1,300. Below that, a key-metrics block tracks the ratios themselves over the three years, and it is the most encouraging part of the sample: debt-to-income falls from 48.4 to 45.3 to 43.1 percent, debt-to-asset from 51.4 to 45.0 to 39.7 percent, and savings rate rises from 15.5 to 18.3 to 20.0 percent. A single year might be an accident; three years pointing the same way is a pattern, and the pattern is the part a review is after.
Hand it over: the Lender Summary sheet
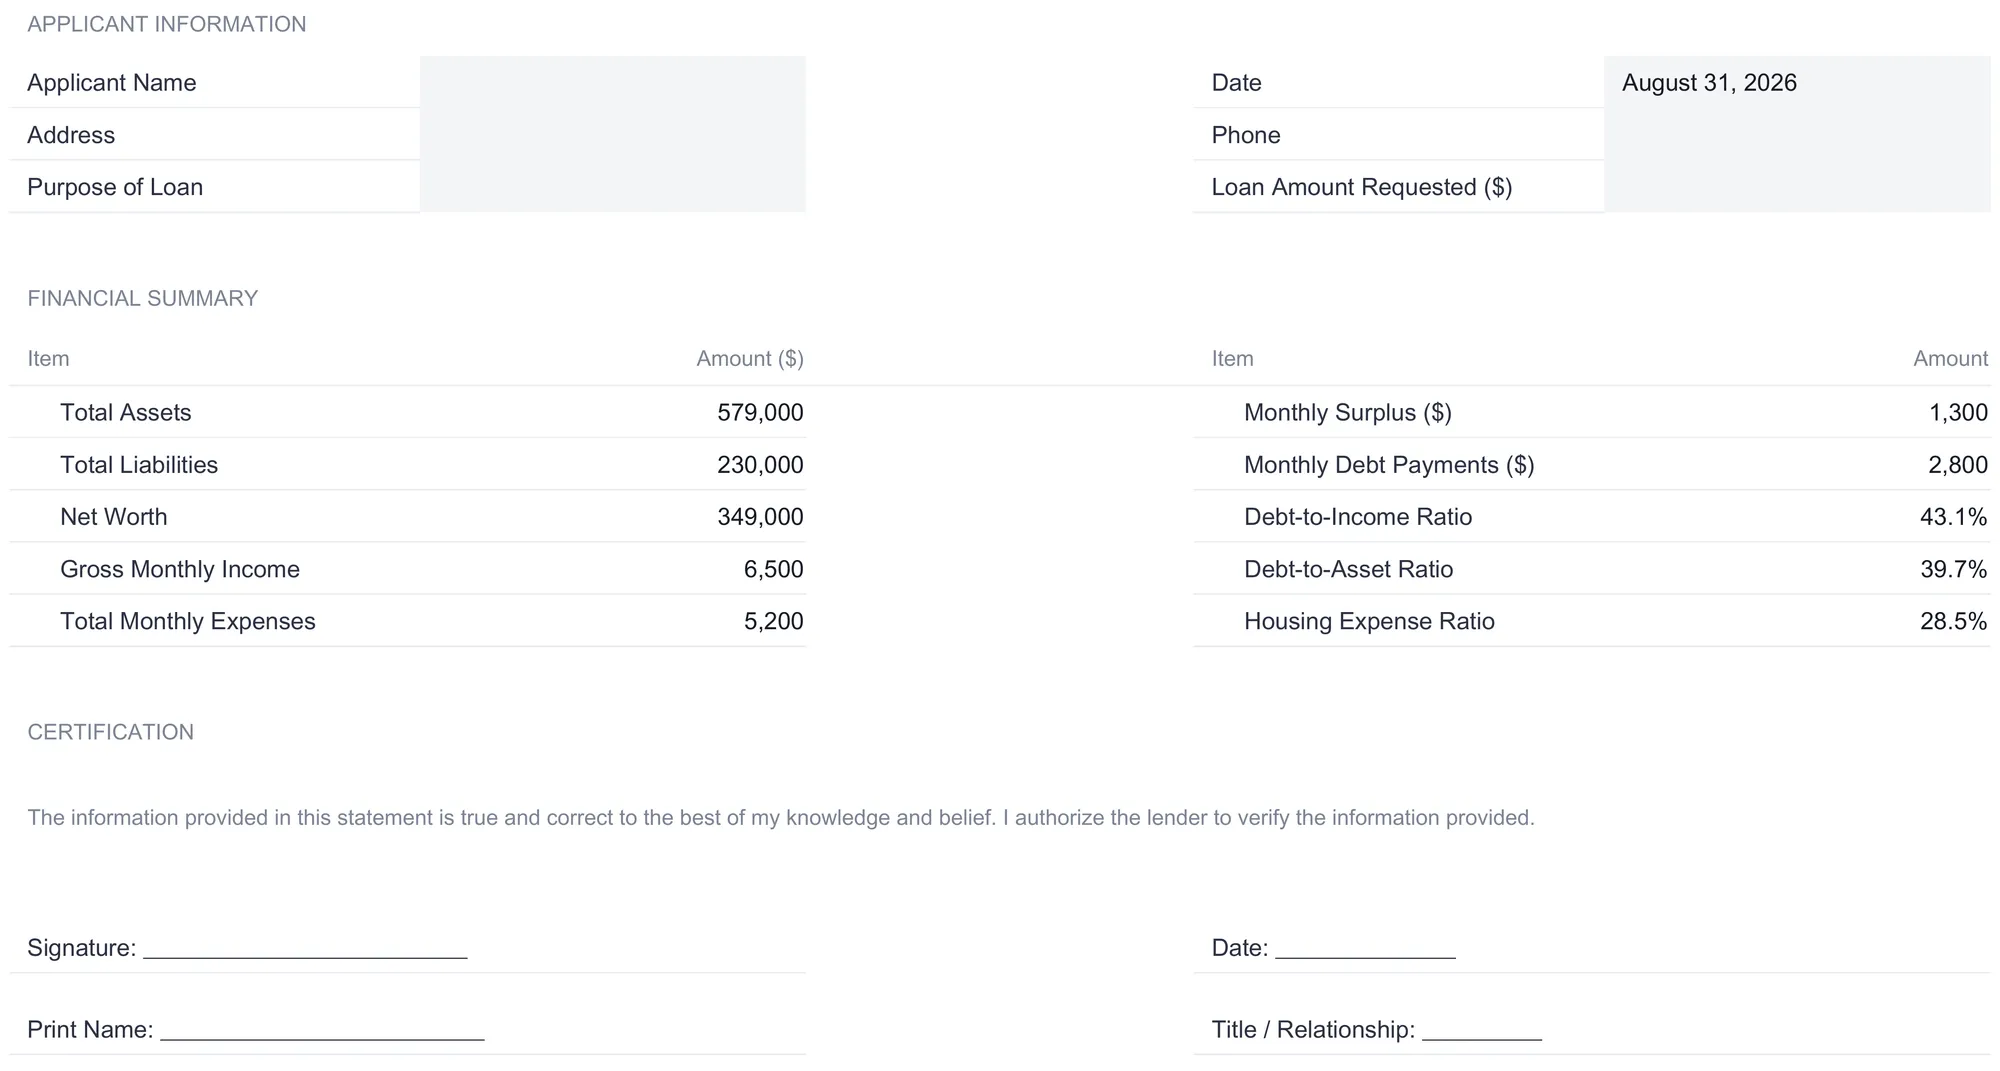
Everything so far has been for the household’s own reading. The Lender Summary sheet is the part built for someone else, and it is the sheet that gives the whole workbook its name. It is a single page headed Personal Financial Statement, formatted to look like the form a bank hands an applicant, and it fills itself from the sheets already completed.
The top is an applicant information block. Name, address, purpose of loan, phone, and the loan amount requested arrive blank to type in per application, and the date field arrives carrying the sample’s August 31, 2026, the same date the balance sheet is struck on. Below it, a financial summary lays the picture out in two columns. On the left it pulls total assets of $579,000, total liabilities of $230,000, net worth of $349,000, gross monthly income of $6,500, and total monthly expenses of $5,200. On the right it carries the monthly surplus of $1,300, monthly debt payments of $2,800, and the three ratios a lender reaches for first, debt-to-income at 43.1 percent, debt-to-asset at 39.7 percent, and housing expense at 28.5 percent. Every one of those figures is a cross-sheet reference, so the summary can never quietly disagree with the sheets behind it.
The page closes with a certification paragraph, stating that the information is true and correct to the best of the applicant’s knowledge and authorizing the lender to verify it, followed by signature, printed name, date, and title lines. The How to Use sheet suggests printing it with File, then Print, then Print Active Sheet, set to fit one page. Whether a given lender accepts a self-prepared statement or insists on its own form is theirs to decide, and the figures on it are only as good as the entries behind them, but the sheet turns what is usually an hour of transcription into a print command.
The dashboard: six numbers and two compositions
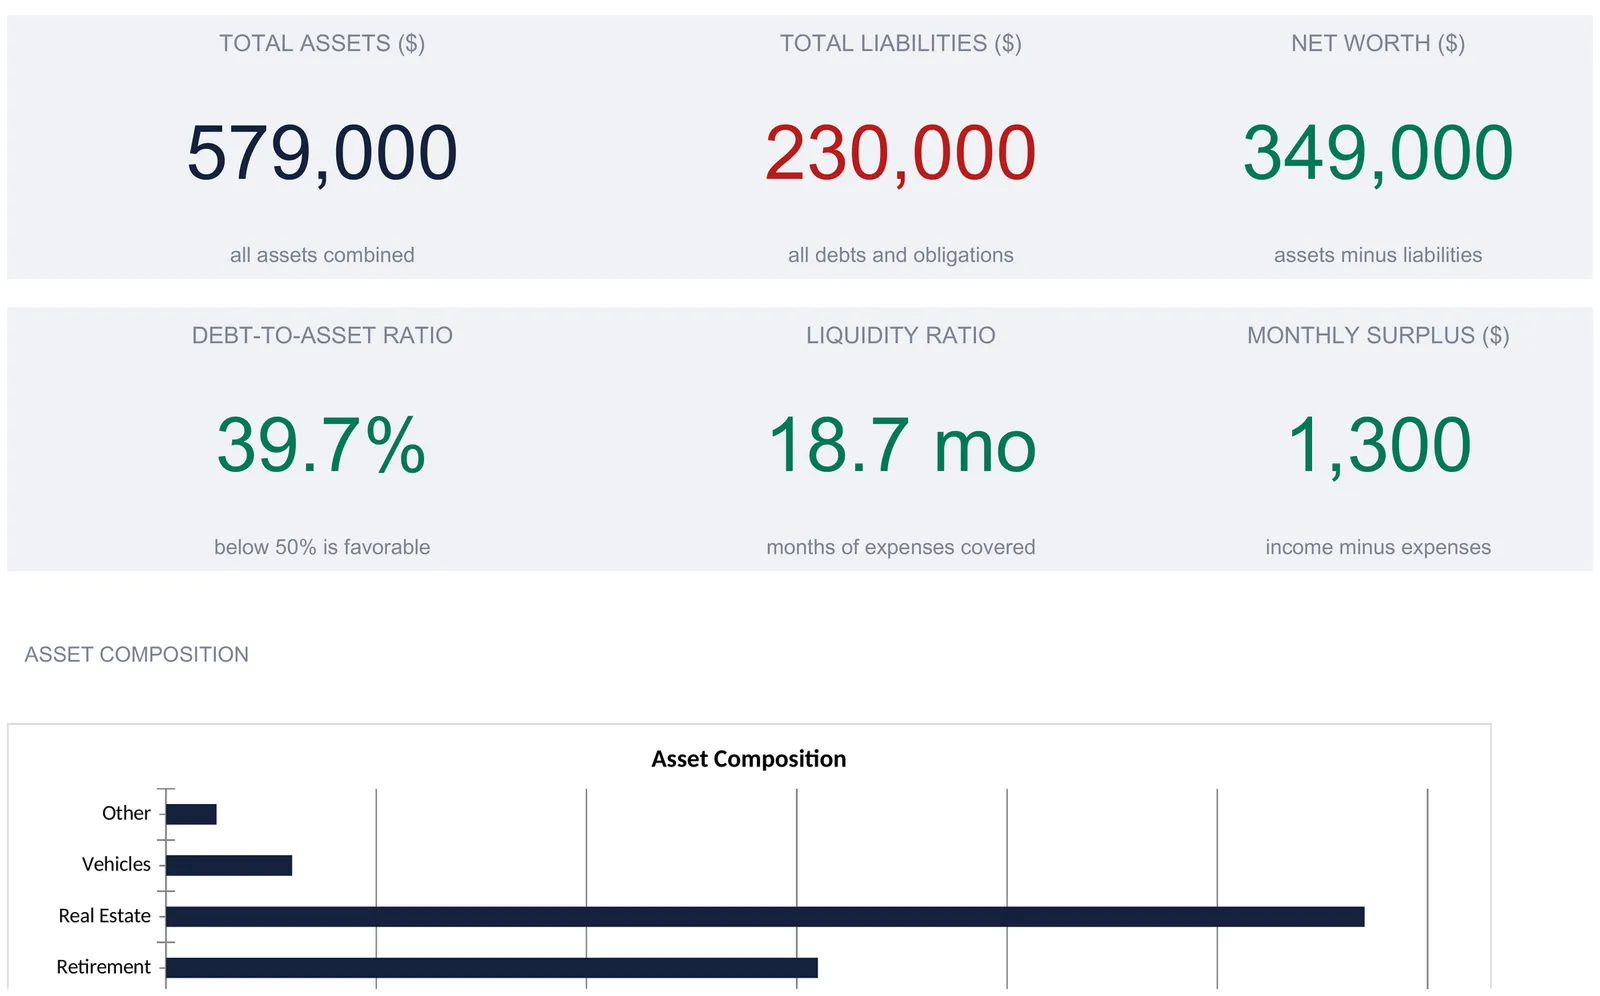
With the statement built, the Dashboard reads it all back at a glance. Six KPI tiles run across the top:
| Tile | Sample value | What it reads |
|---|---|---|
| Total assets | $579,000 | All assets combined |
| Total liabilities | $230,000 | All debts and obligations |
| Net worth | $349,000 | Assets minus liabilities |
| Debt-to-asset ratio | 39.7% | Below 50% is favorable |
| Liquidity ratio | 18.7 mo | Months of expenses covered |
| Monthly surplus | $1,300 | Income minus expenses |
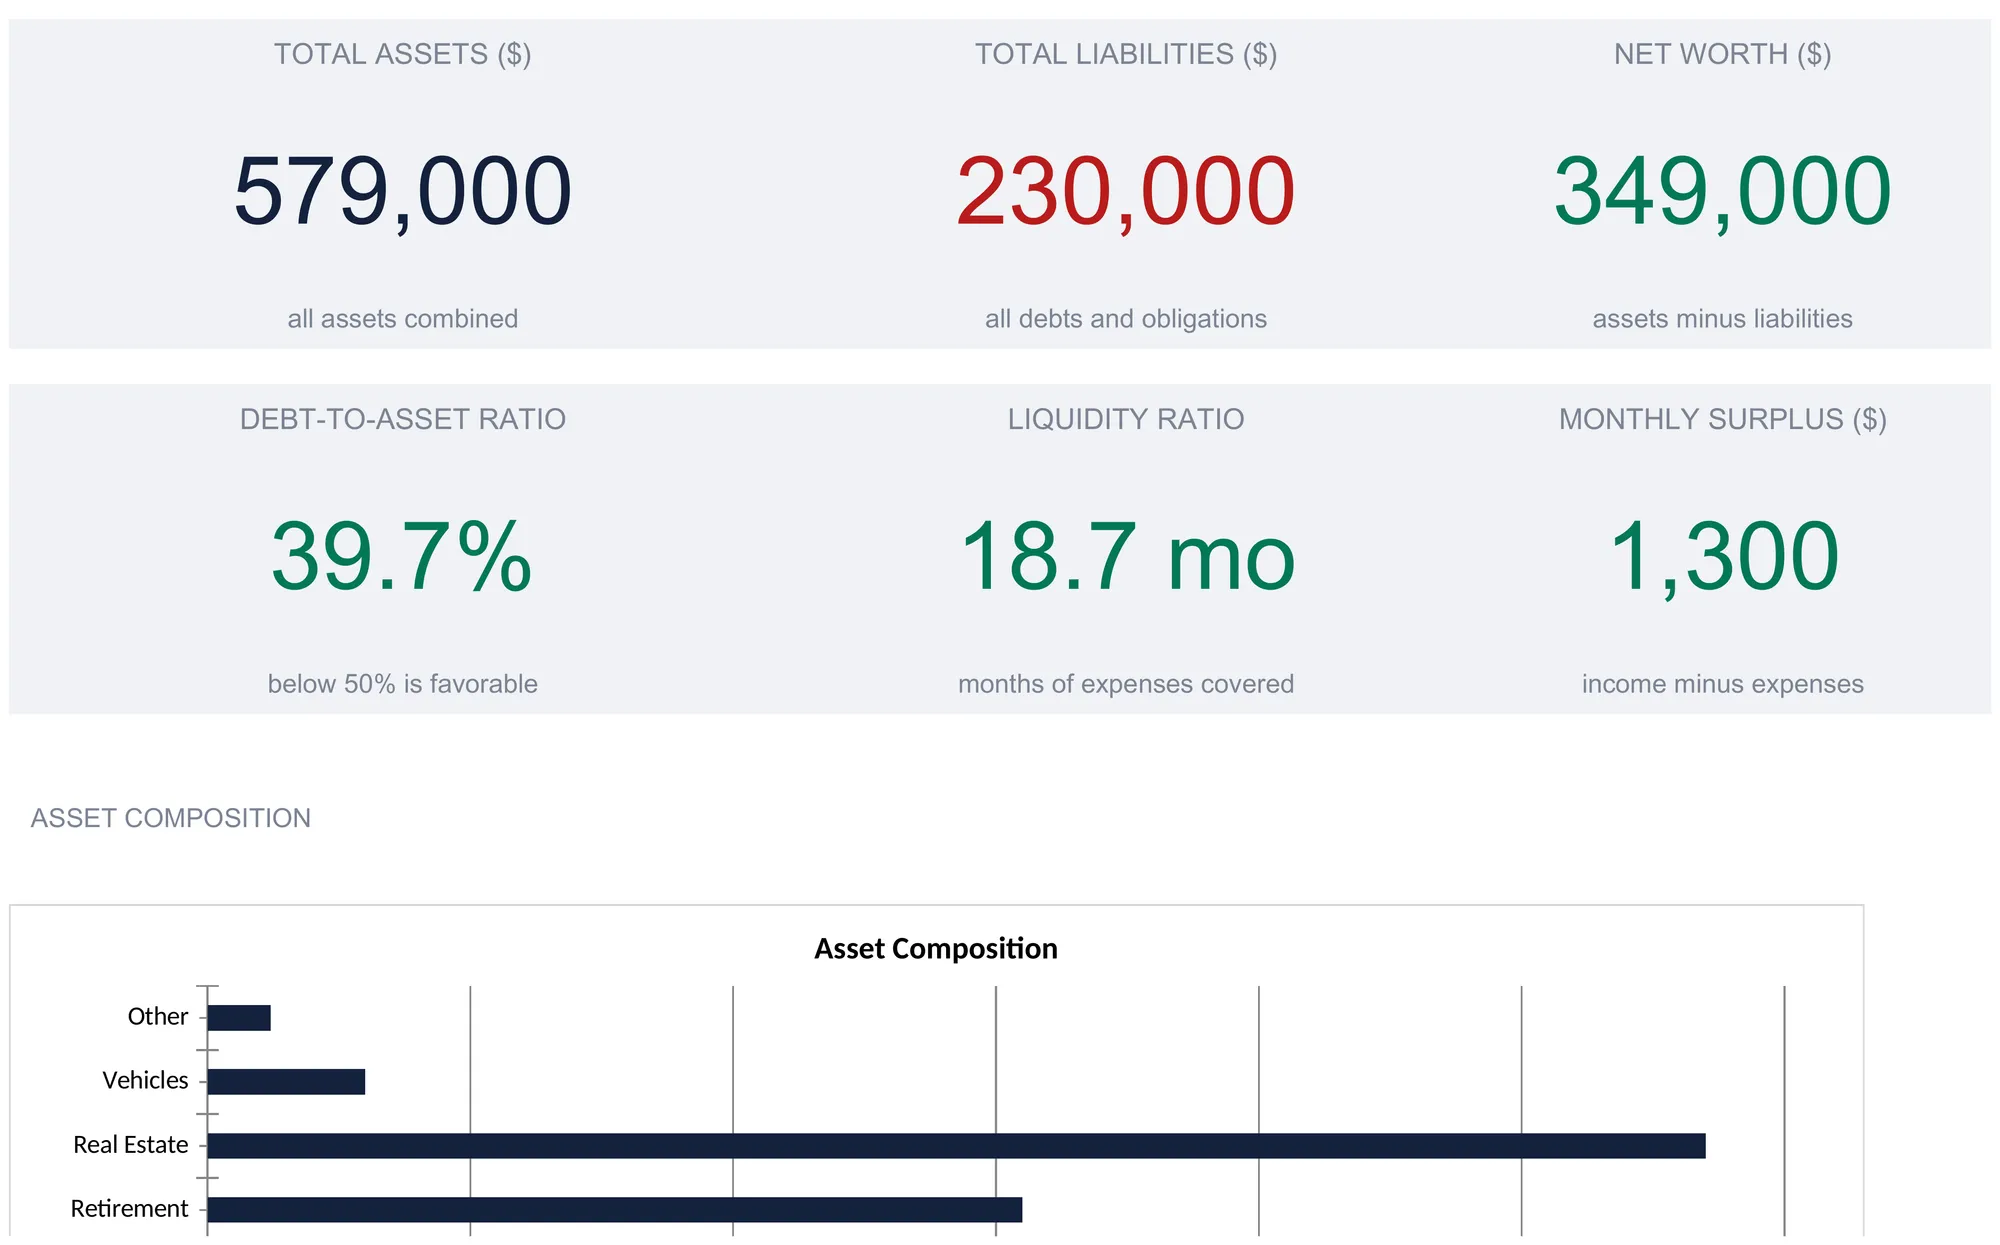
Below the tiles sit two composition views that regroup the ledger into a handful of buckets. The asset composition splits the $579,000 into $55,000 of cash and equivalents, $42,000 of investments, $155,000 of retirement, $285,000 of real estate, $30,000 of vehicles, and $12,000 of other, which is the fastest way to see that this household’s wealth is concentrated in a home and a retirement account rather than in liquid holdings. The debt composition splits the $230,000 into $198,000 of mortgages, $14,000 of auto loans, $8,000 of student loans, $5,000 of credit cards, and $5,000 of other, making plain that nearly all the debt is a single mortgage rather than a spread of consumer balances. A quick summary table below lists six figures in a compact form, gross monthly income, total monthly expenses, monthly debt payments, total assets, total liabilities, and net worth, which puts the cash-flow numbers the tiles leave out on the same screen as the balance-sheet ones.
The two compositions matter because a personal financial statement can hide its own shape behind two large totals. Seeing $579,000 resolve into six bars, and $230,000 into five, is what turns a pair of numbers back into a description of a household.
Where a personal financial statement ends
A personal financial statement is a record, not an instrument. This workbook computes what a household owns, owes, earns, and spends, expresses the balance as ratios, and formats a page a lender can read, but it does not apply for anything, submit anything, or connect to any bank or bureau. The benchmarks in it are general reference points rather than approval thresholds, and the sheet says so plainly in its own guide. Which ratios a specific lender weighs, and where it sets its lines, is a question for that lender, and the value of a tidy statement is that the answer becomes a lookup rather than a scramble when they ask.
The Consumer Financial Protection Bureau’s explanation of the debt-to-income ratio is a useful companion here, because it defines the single ratio a lender leans on most and is clear that different loan products and lenders apply different limits. A statement that presents the ratio honestly, alongside the assets, liabilities, and cash flow behind it, is doing exactly what it should, which is to describe a financial situation accurately rather than to argue for a particular outcome.
Excel or Google Sheets for a personal financial statement
The template is an .xlsx file built on standard formulas, with no macros and no add-ons, so it behaves the same in Microsoft Excel and in Google Sheets after upload, and the How to Use sheet notes it works in LibreOffice Calc as well. Google Sheets suits a household that wants to open the same live statement from more than one device, or share it with a partner or an advisor; Excel suits one that prefers a local file it keeps on its own machine, which for a document this personal is often the point. The structure described here, a balance sheet feeding a ratio sheet feeding a lender summary, is equally buildable in either, and nothing in this walkthrough depends on a feature only one of them has.
The workbook also carries a currency selector on the Dashboard. Choosing a symbol from the Currency dropdown relabels the money headers and KPI titles on the Dashboard, Assets & Liabilities, Income & Expenses, Multi-Period, and Lender Summary at once, leaving the Financial Ratios sheet as it is because its columns carry percentages and a month count rather than amounts. The selector changes the symbol shown rather than converting the underlying numbers, so it fits a household that keeps its records in a currency other than the dollar without turning the statement into an exchange-rate calculator. Throughout the file, tinted cells are the ones to fill in and white cells with a thin underline are calculated, which makes it clear at a glance where typing belongs and where a formula is already doing the work.
Which template fits the job
- Personal Financial Statement Ultimate Spreadsheet Template ($29) is the workbook this walkthrough follows: the twenty-asset, fifteen-liability balance sheet, the income and expenses sheet, the five-ratio analysis, the three-year comparison, the six-KPI dashboard, and the one-page lender summary, ready for a loan application or a full year-end review. The tier family starts smaller, with a free Personal Financial Statement template for a single-sheet statement and a Personal Financial Statement Essentials ($19) in between. The Ultimate version is the one that adds the ratios, the multi-year trend, the dashboard, and the printable lender page.
- Net Worth Tracker Ultimate Spreadsheet Template ($29) is the closer fit when the goal is to follow one number over time rather than produce a lender document. It keeps assets and liabilities with an asset-allocation view, monthly snapshots, and a year-over-year sheet, so it is built for the ongoing tracking a personal financial statement freezes into a single dated page.
Related
- How to Track Net Worth in a Spreadsheet - the assets-and-liabilities half of this statement, followed month by month as its own document
- How to Create an Advanced Personal Finance Tracker in Google Sheets - the ongoing income-and-expense side, for a household that wants to watch cash flow week to week
- Net Worth Statement Checklist - a walkthrough of the assets and liabilities to gather before filling one of these in
Frequently asked questions
What is the difference between a personal financial statement and a net worth tracker?
A net worth tracker answers one question, what you own minus what you owe, and follows it over time. A personal financial statement is the broader document a lender asks for. It carries the same assets and liabilities, but it also records monthly income and expenses, turns both into five financial ratios such as debt-to-income and housing expense, and ends with a one-page summary formatted for a loan application. Net worth is the opening figure of a personal financial statement rather than the whole of it.
Can I hand the Lender Summary sheet to a bank?
It is built to be handed over. The Lender Summary is a single printable page headed Personal Financial Statement, with an applicant information block, a financial summary that pulls total assets, liabilities, net worth, income, expenses, and the key ratios from the other sheets, and a certification and signature block at the bottom. The How to Use sheet suggests printing it with File then Print then Print Active Sheet, set to fit one page. Whether a specific lender accepts a self-prepared statement or wants its own form is theirs to say, and the figures still need to be true and current.
Are the benchmark ratios in the template rules I have to meet?
No. The benchmarks are general reference points, not thresholds anyone is required to hit. The sheet marks debt-to-income against a 36 percent line, debt-to-asset against 50 percent, savings rate against 20 percent, liquidity against three months, and housing expense against 28 percent, and it colors each Good or Needs Attention against those figures. Where a lender actually draws its line is theirs to set, and the workbook says as much in its own benchmark guide. The ratios describe a situation; they do not prescribe an action.
Does the current year update on its own, or do I type it?
The current-year column on the Multi-Period sheet pulls from your other sheets automatically, so the 2026 net worth, income, and ratios read straight from Assets and Liabilities, Income and Expenses, and Financial Ratios. Only the two prior years, 2024 and 2025 in the sample, are typed in by hand from your own records. That split is why the file can show a three-year trend without asking you to re-enter this year's numbers twice.
How is the liquidity ratio getting to almost 19 months?
It divides liquid assets by monthly expenses. In the sample the liquid pool is cash, savings, certificates of deposit, and stocks and bonds, $12,000 plus $28,000 plus $15,000 plus $42,000, or $97,000, and monthly expenses are $5,200, which works out to 18.65 months. The figure counts marketable investments as liquid, so a household that would rather measure only cash-like assets can read the smaller cash, savings, and CD subtotal against the same expense figure instead.
Sources
- What is a debt-to-income ratio? - Consumer Financial Protection Bureau
About this article
Sheet names, row counts, sample figures, formulas, conditional formatting, chart types, dropdowns, and the currency selector re-checked on 2026-09-10 against the published Personal Financial Statement Ultimate workbook (Dashboard, Assets & Liabilities, Income & Expenses, Financial Ratios, Multi-Period, Lender Summary, How to Use), the exact file customers download. Tier boundaries re-checked on 2026-09-10 against the shipped free and Essentials Personal Financial Statement workbooks, and the Net Worth Tracker Ultimate description against its shipped workbook. The debt-to-income reference was re-checked against the live Consumer Financial Protection Bureau page on 2026-09-10. Last reviewed September 2026.