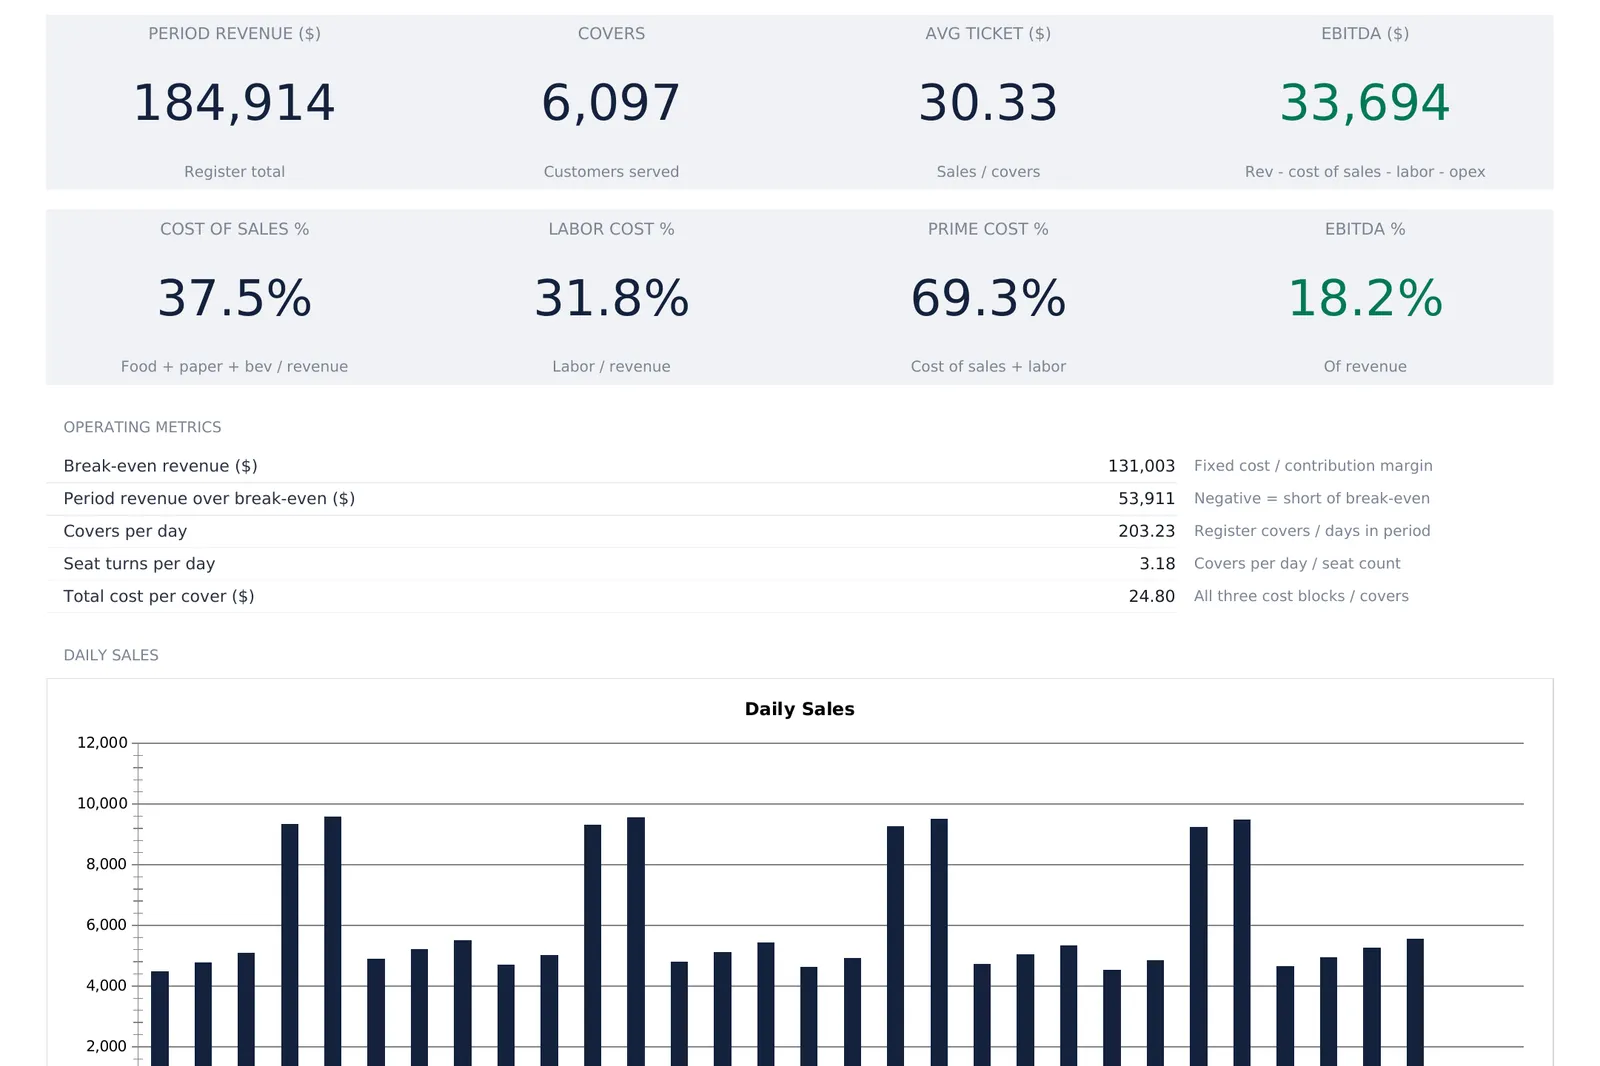
A restaurant financial model spreadsheet starts with one dated register of covers and sales, then layers cost rates, a labor roster, and a daypart split on top of it. The dashboard returns food cost, labor cost, prime cost, EBITDA, and the revenue the period has to clear to break even. This walkthrough follows a worked example, a 64-seat bistro with 6,097 covers and $184,914 of sales across 30 days. Our Restaurant Financial Model ($59) ships the same structure ready-made for Excel and Google Sheets.
A restaurant knows its revenue every night. The register closes, the number is real, and it exists before anyone goes home. Almost nothing else in the business behaves that way. Food cost sits inside invoices that arrive on their own schedule, labor is a roster rather than a bill until payday, and rent lands once a month whether the dining room was full or empty. One number arrives daily and every other number arrives late, which is the gap a restaurant financial model is built to close.
It closes the gap with arithmetic rather than accounting. Sales are the one figure known with certainty, so the model expresses the costs that scale as rates against sales and states the costs that do not scale as flat period amounts. Both then come back as ratios, which read the same way in a slow month and a busy one. The examples below come from our Restaurant Financial Model Spreadsheet Template ($59), which ships the whole structure ready-made for Excel and Google Sheets. The sample file models a 64-seat bistro across a 30-day period, and every number quoted here is from that file.
What a restaurant financial model has to hold
Underneath the dashboard there are only four kinds of information, and every restaurant model is some arrangement of them.
- A sales record. Covers and sales for each day, which together give the average ticket. Nothing else in the model works without this.
- Cost rates. The share of every dollar of sales that leaves again as food, paper and beverage. These scale with volume by definition.
- Costs that do not scale. The roster and the monthly bills. A quiet Tuesday still pays the chef and still pays the rent.
- Derived ratios. Cost of sales percent, labor cost percent, prime cost, EBITDA, break-even revenue, covers per day, seat turns. None of these are ever typed.
The template gives each group a sheet. Settings holds the four business constants, Daily Sales holds the register, Cost Model holds the rates and the fixed bills, Labor holds the roster, and Daypart Mix splits revenue by service period. The Dashboard computes everything on top of them, and a How to Use sheet carries the definitions. That is seven sheets, and the order above is also the build order, because each layer reads the one before it. Typing stops at Settings and the four input sheets. Every total and every ratio downstream of them is a formula.
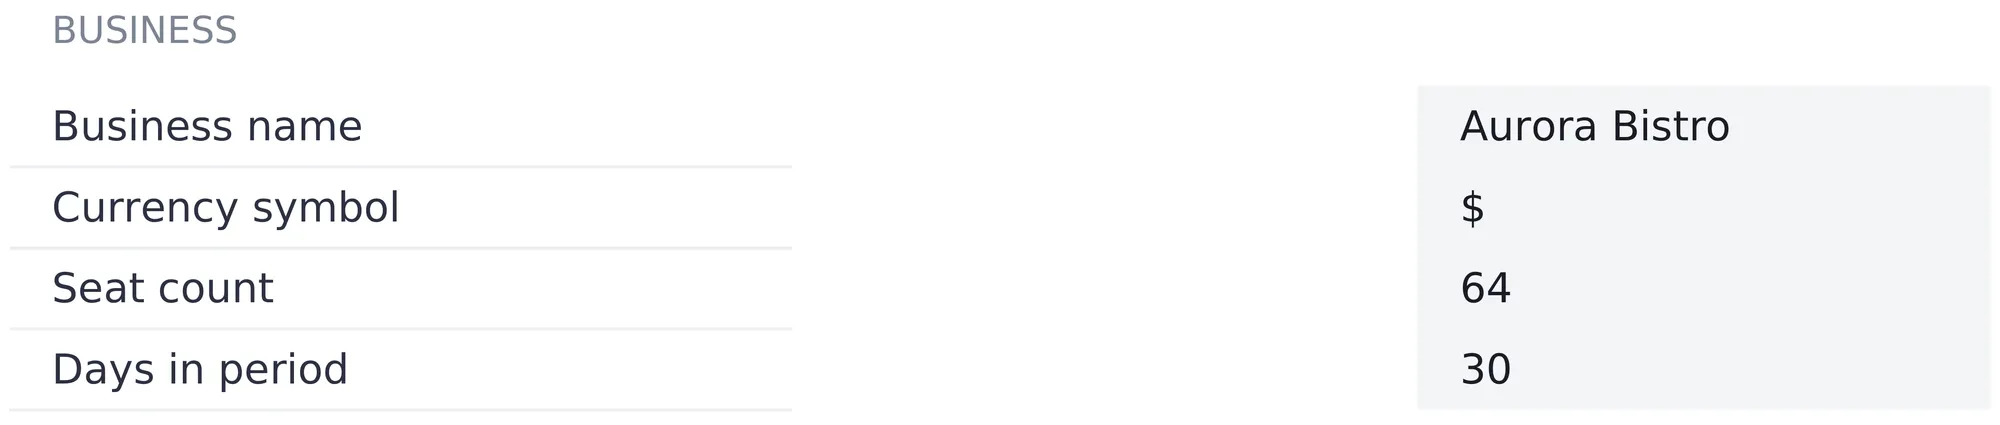
Settings first: seats, days, and the period the model covers
Four entries on the Settings sheet decide how the rest of the workbook reads, so they come first.
Business name, Aurora Bistro in the sample, appears under the title on every sheet, which is what keeps a folder of files distinguishable.
Currency symbol is a dropdown of 35 options. Choosing one relabels every money header and KPI tile across the workbook. It relabels only, with no conversion of the underlying numbers.
Seat count, 64 in the sample, is the denominator for seat turns per day and does nothing else.
Days in period, 30 in the sample, does considerably more. It scales the weekly labor roster into a period cost, and it divides register covers into covers per day. This figure is typed rather than counted from the register, so the two can disagree. A register holding seven dated days with days in period still set to 30 would report a month of labor against a week of sales. Both the break-even line and the prime cost ratio inherit that mismatch. The sheet’s own note keeps the rule short: the daily register and the cost rates cover the same period.
The daily register: one row a day, three cells typed
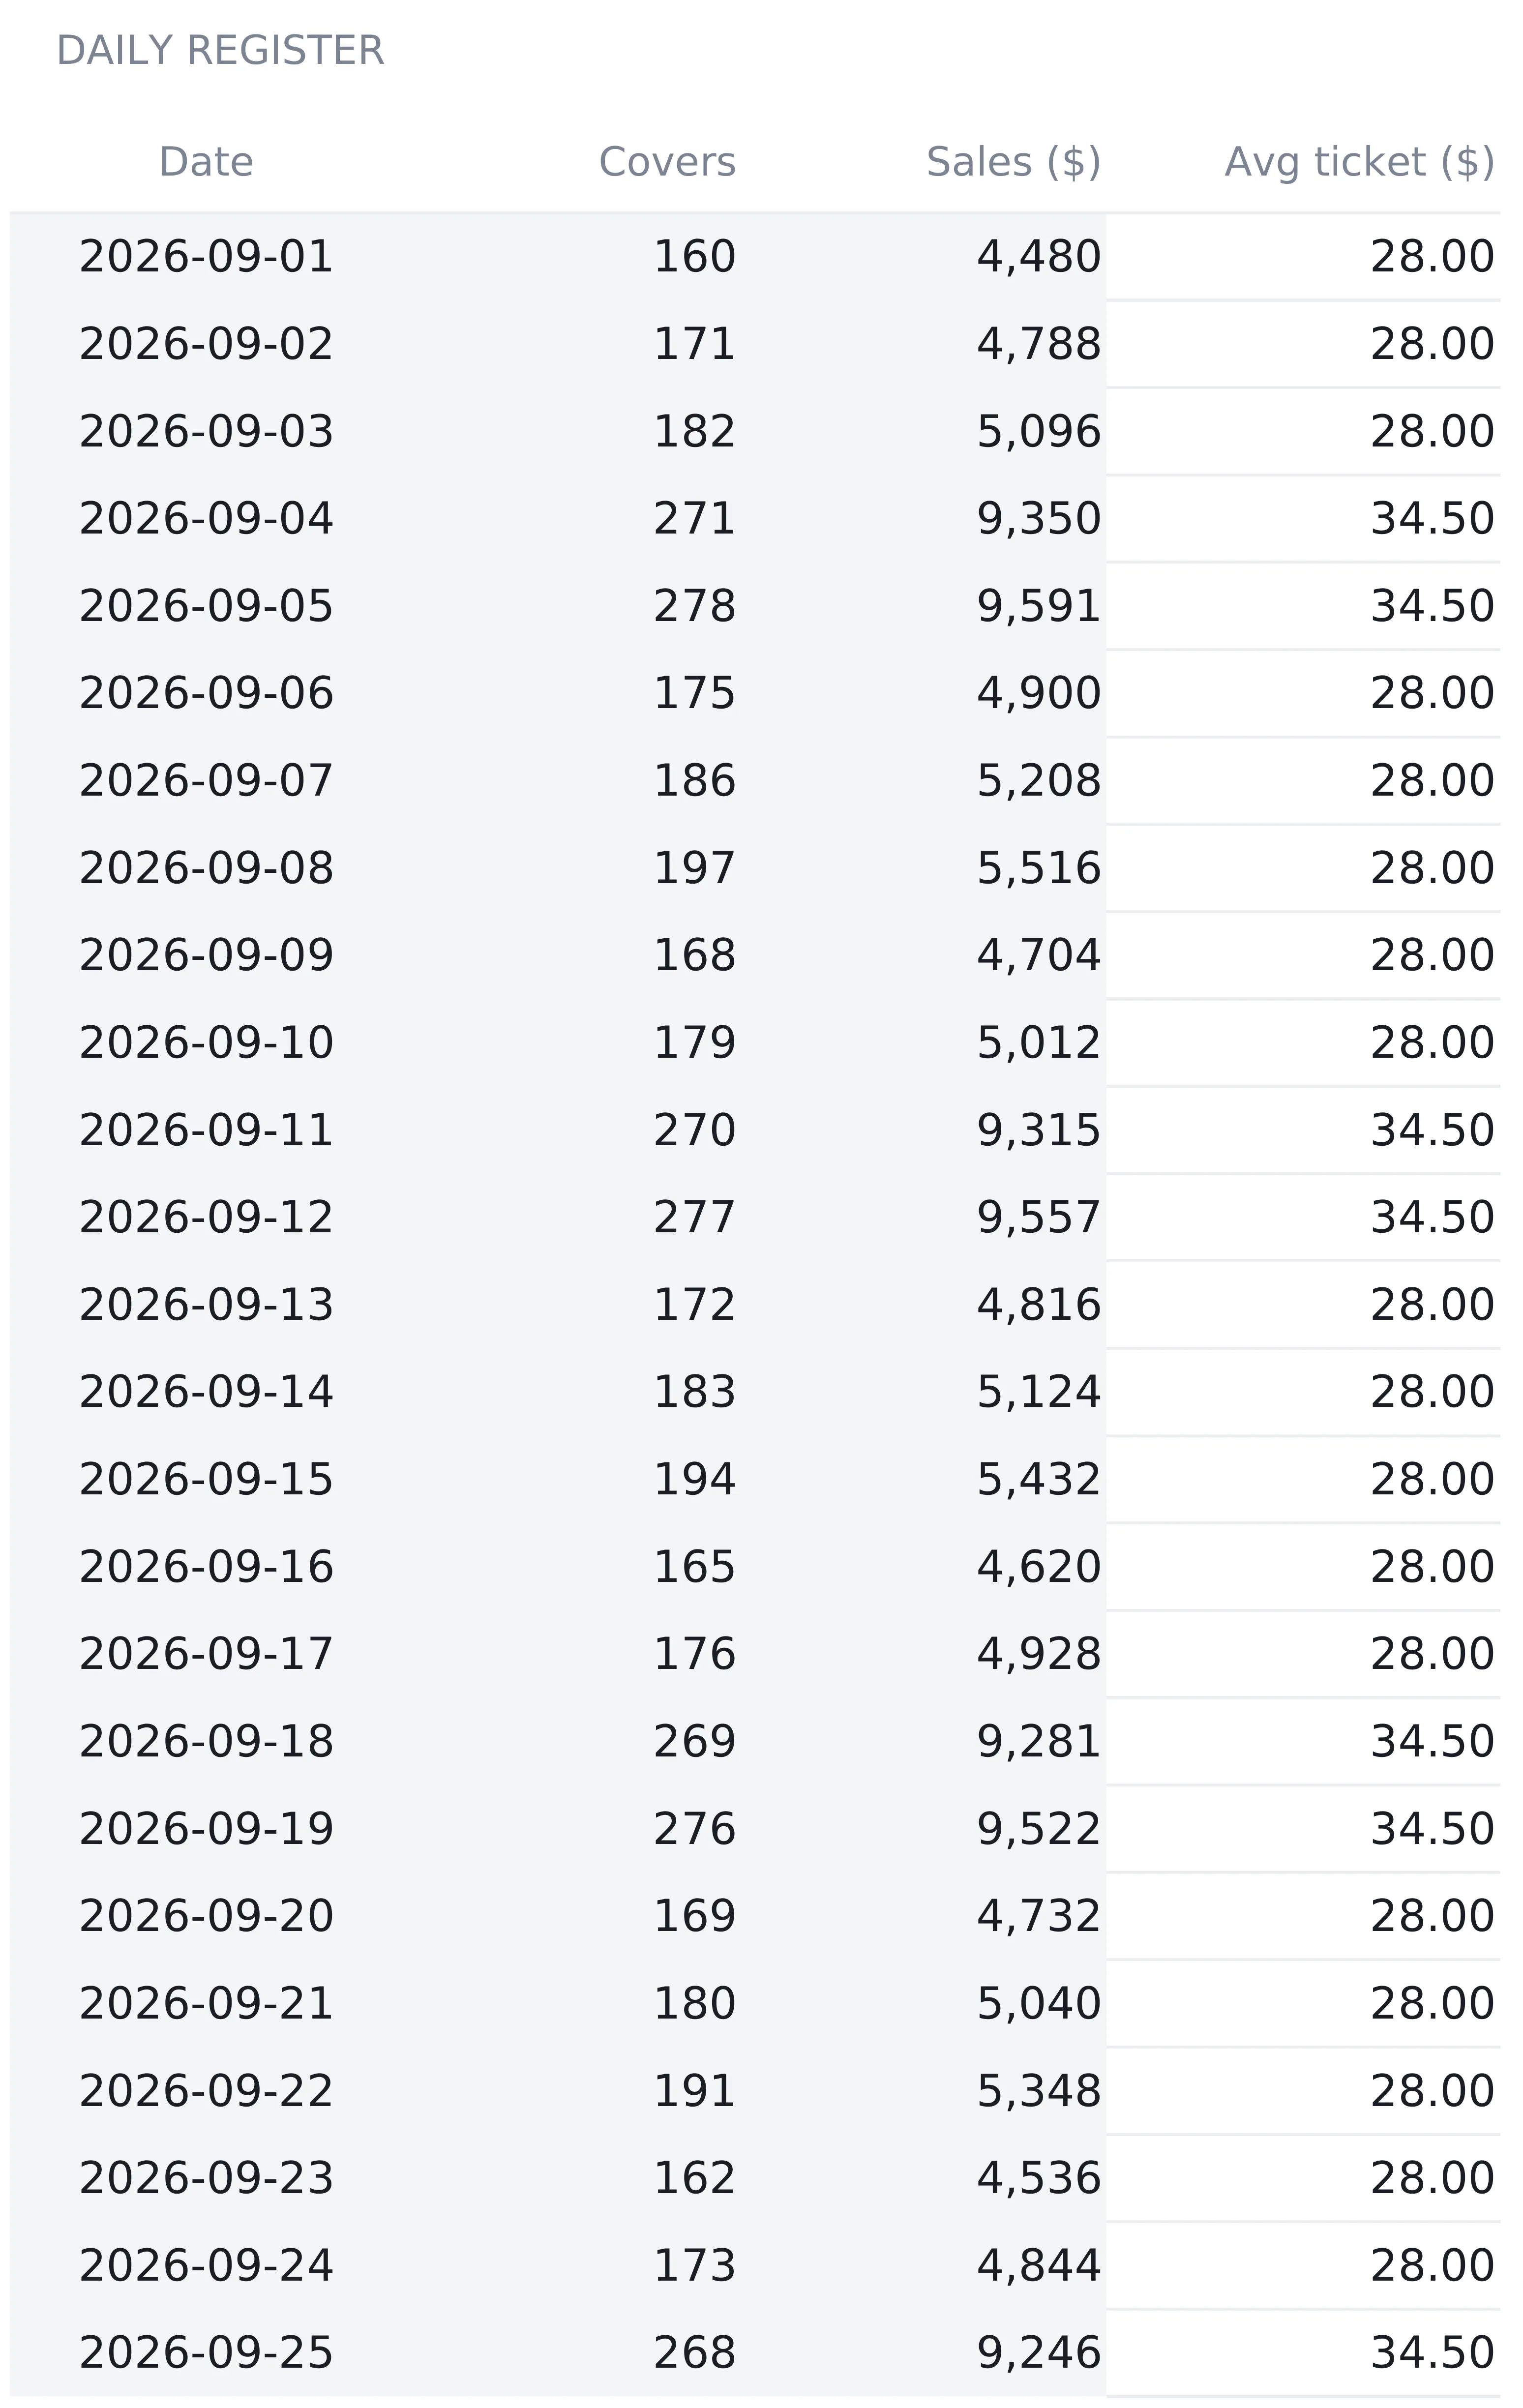
The Daily Sales sheet is the only place a sales figure is ever entered. Each row takes a date, a cover count and a sales total, and the fourth column computes the average ticket as sales divided by covers. A row with no covers reads N/A rather than zero, because a ticket average over nothing is undefined rather than nil.
The sample runs 1 September to 30 September and the shape of a restaurant week comes straight out of it. Weekdays sit between 160 and 199 covers at an average ticket of exactly $28.00, while Fridays and Saturdays run 268 to 278 covers at $34.50. The busiest day, 5 September, took $9,591 from 278 covers. The quietest, 1 September, took $4,480 from 160. Two days a week produce roughly double the sales per day of the other five, on a higher ticket as well as a higher cover count. That is the pattern the dashboard’s daily sales chart shows as a run of tall bars in pairs.
The totals row adds up to 6,097 covers and $184,914 of sales, and divides one into the other for a period average ticket of $30.33. Every other sheet in the workbook reads those two totals.
Two structural details are worth copying into any hand-built version.
The spare rows are already wired. The register ships 32 rows with 30 dated, and the two blanks already carry the average ticket formula and already sit inside the totals. Dating one puts it into the totals and the chart with no formula to drag and no range to extend. The same pattern repeats elsewhere, with two spare variable rows and three spare fixed rows on the Cost Model sheet, three spare positions on Labor, and two spare dayparts on Daypart Mix.
Nothing downstream stores its own copy of sales. Food cost, break-even, covers per day and every daypart figure all read the same total cell. A model that keeps a second sales figure somewhere is a model that will eventually disagree with itself.
The Cost Model: rates that scale, amounts that do not
The Cost Model sheet is split in two, and the split is the whole idea.
The top block holds variable costs as a percentage of sales. Food cost is 30 percent, paper and supplies 2.5 percent, beverage cost 5 percent. Each row’s amount is its rate multiplied by the register total, so food cost computes to $55,474, paper to $4,623 and beverage to $9,246. The three rates add to 37.5 percent and the three amounts to $69,343.
The bottom block holds fixed operating costs as flat amounts for the period. Occupancy, which combines rent and insurance, is $14,000. Utilities are $4,500, marketing $2,200, repairs and maintenance $800, and other $1,500, for a total of $23,000. Occupancy alone is roughly three fifths of that block. None of the five lines move when the dining room does, which is what makes the fixed total the same number in a record month and a dead one.
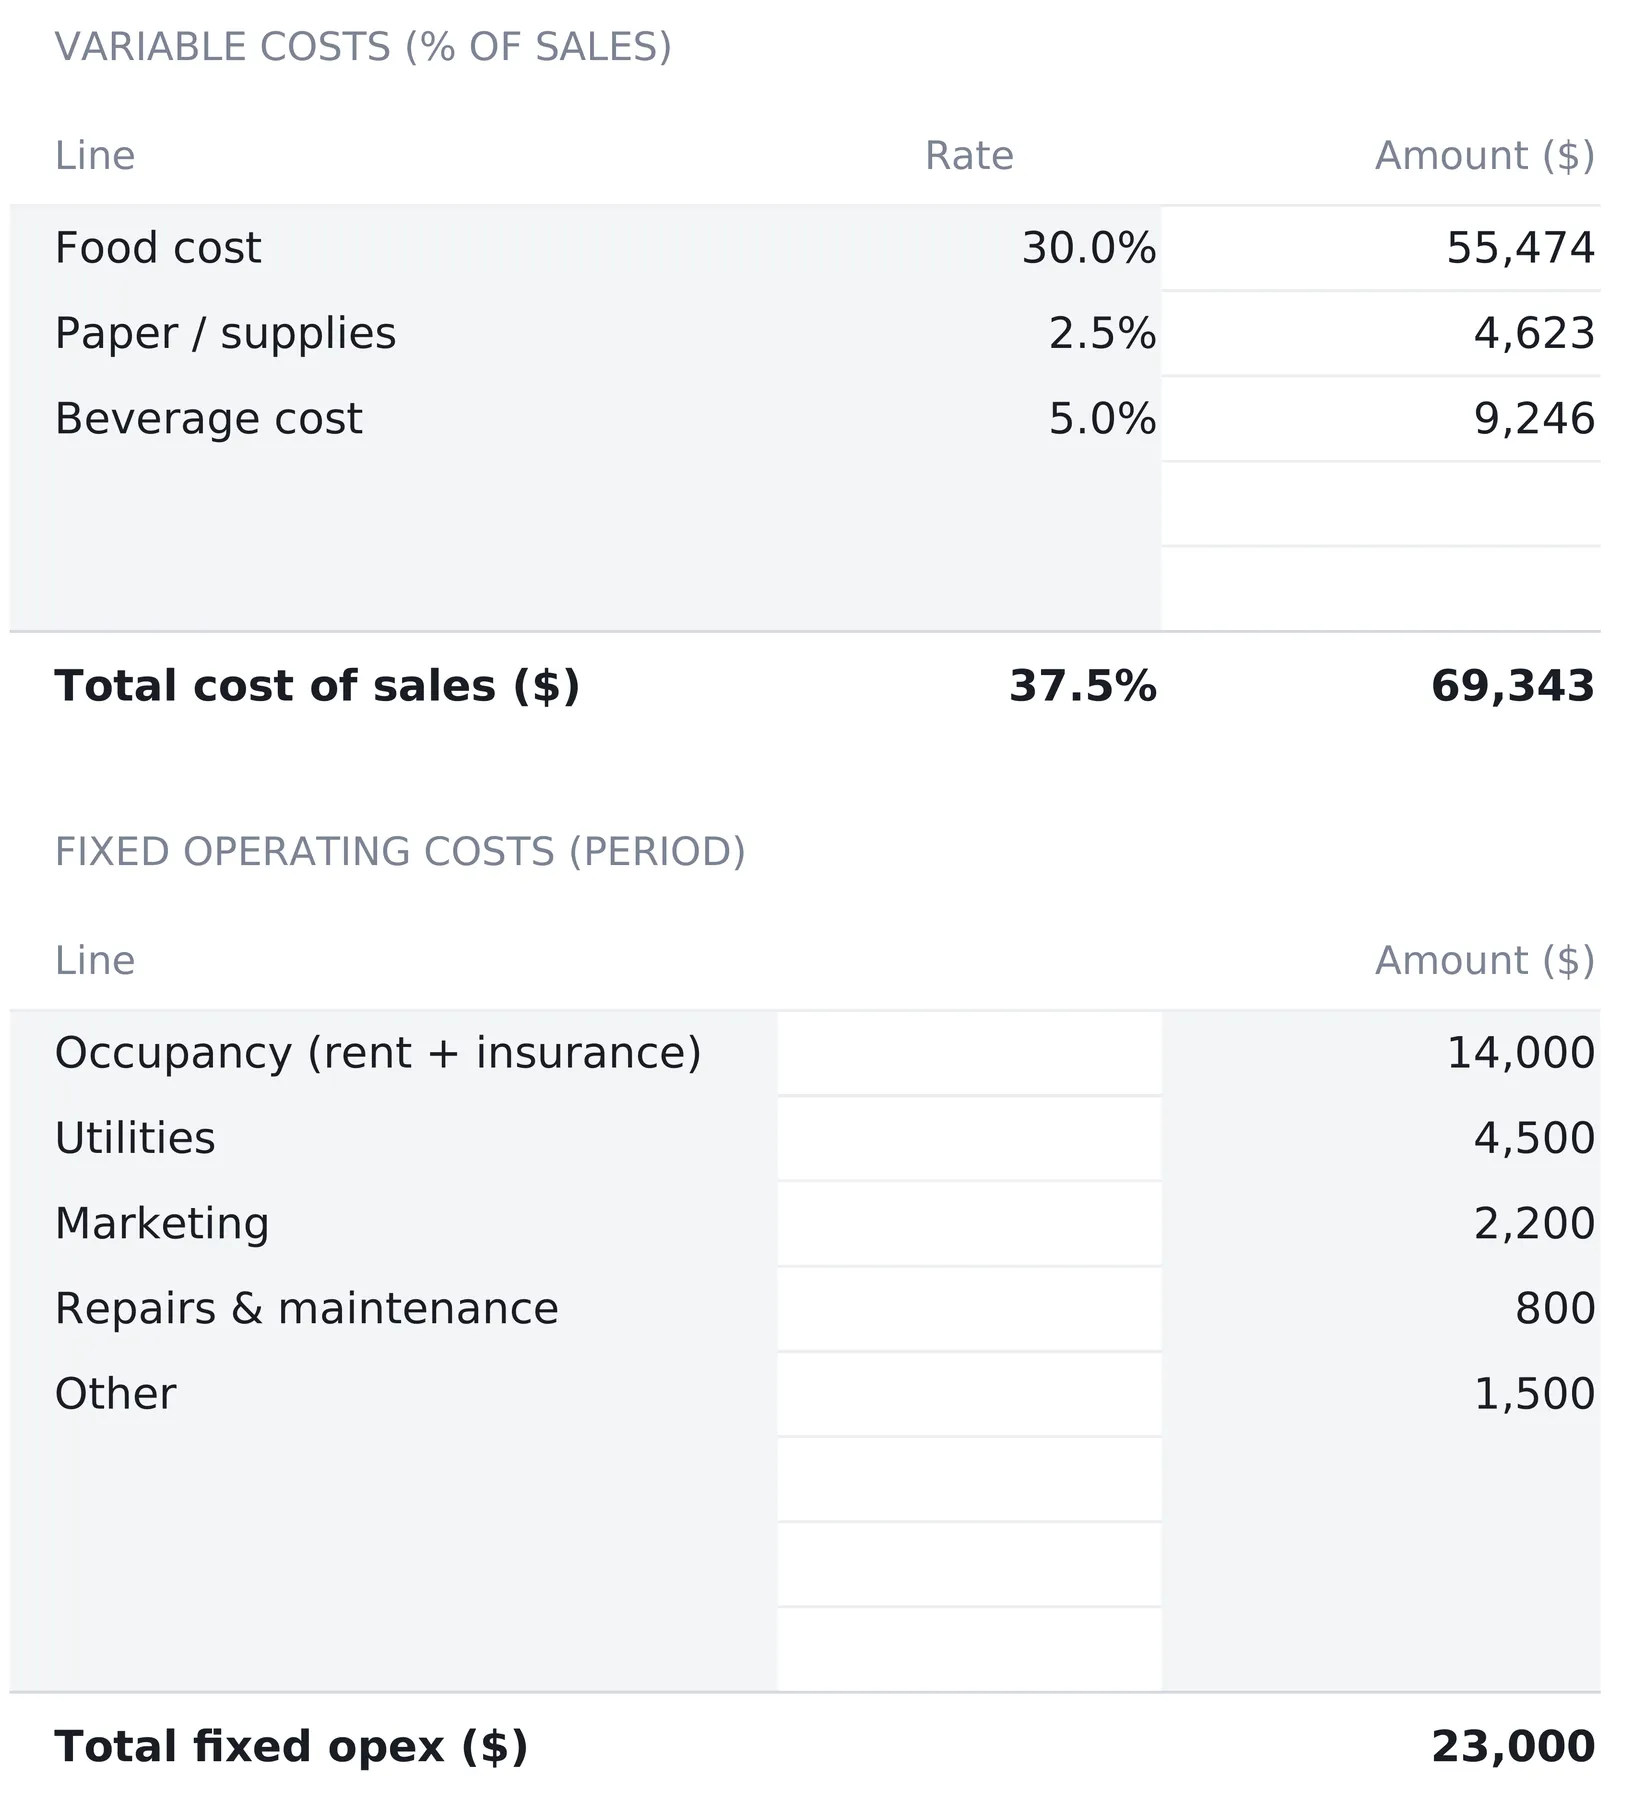
Keeping the two blocks apart is what makes break-even computable at all. The variable rates take 37.5 cents from every dollar, leaving 62.5 cents behind to pay for the fixed block, and that 62.5 percent contribution margin is the divisor in the break-even calculation further down. Merge the two blocks into one expense list and the arithmetic disappears, along with any way of answering how much the restaurant has to sell before it stops losing money.
The trade the rate approach makes is precision for responsiveness. Food cost here is an assumption applied to sales rather than a count of what actually left the walk-in, so it cannot detect waste, theft or a supplier price rise on its own. What it can do is answer the question restaurants ask constantly, which is what happens to the month if food cost drifts a point and a half.
Labor: a weekly roster scaled to the period
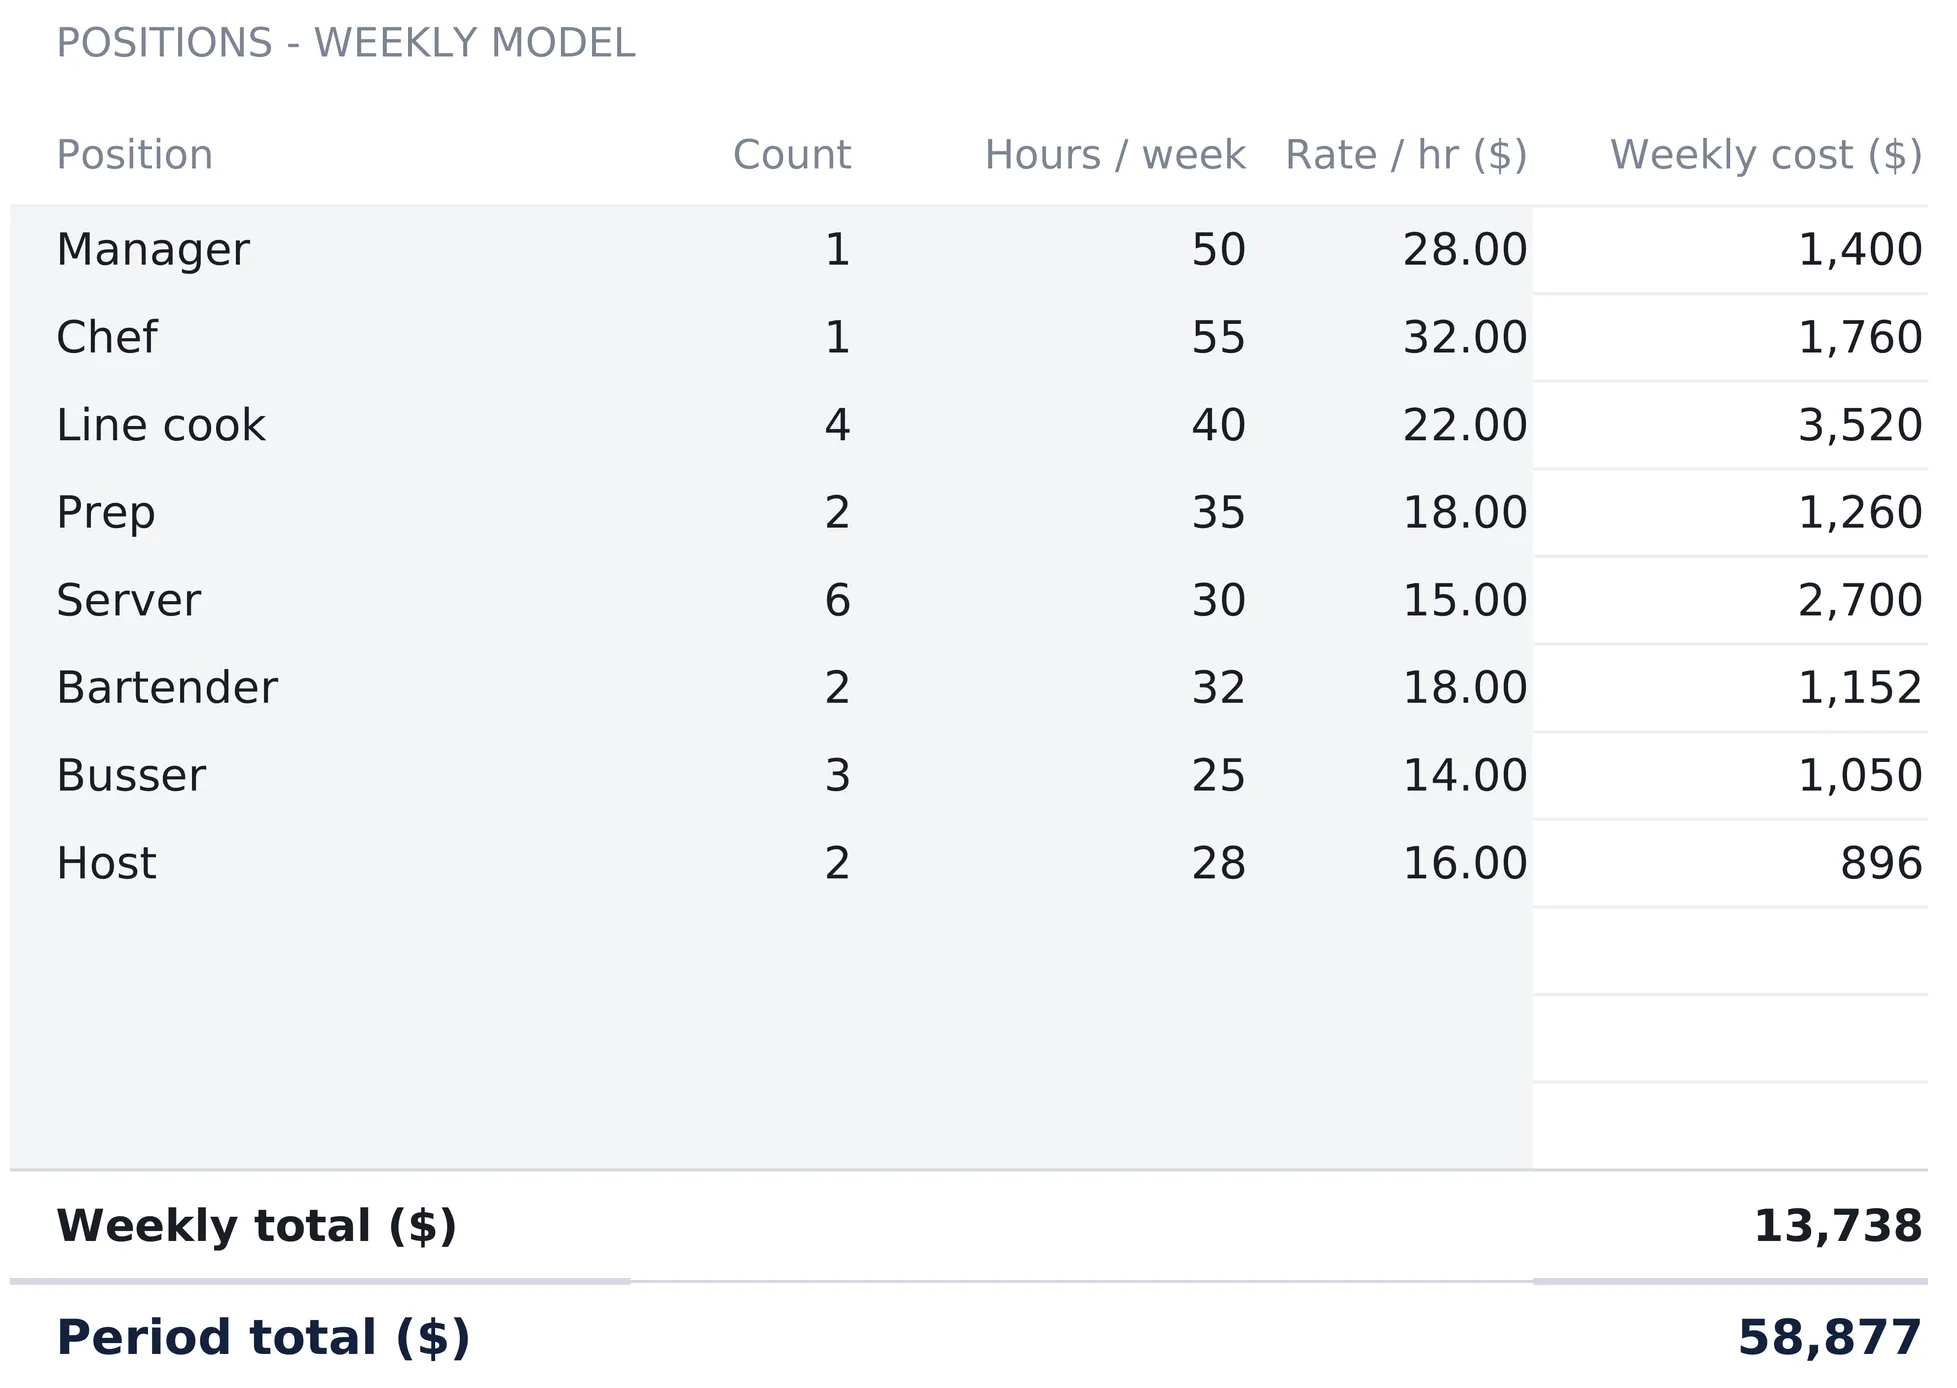
Labor is modeled as a schedule rather than a payroll figure. Eight positions each carry a headcount, weekly hours and an hourly rate, and the weekly cost per row is the three multiplied together.
| Position | Count | Hours / week | Rate / hr ($) | Weekly cost ($) |
|---|---|---|---|---|
| Manager | 1 | 50 | 28.00 | 1,400 |
| Chef | 1 | 55 | 32.00 | 1,760 |
| Line cook | 4 | 40 | 22.00 | 3,520 |
| Prep | 2 | 35 | 18.00 | 1,260 |
| Server | 6 | 30 | 15.00 | 2,700 |
| Bartender | 2 | 32 | 18.00 | 1,152 |
| Busser | 3 | 25 | 14.00 | 1,050 |
| Host | 2 | 28 | 16.00 | 896 |
| Weekly total | 13,738 |
Twenty-one people and 710 scheduled hours a week come to $13,738, and the period total converts that with a single formula: the weekly figure divided by seven and multiplied by the days in period. For a 30-day period that is 4.29 weeks, which lands at $58,877.
The kitchen carries the weight. Chef, line cooks and prep together account for $6,540 of the weekly total, just under half of it, on seven of the twenty-one scheduled people. A roster is also the one cost block an operator can reshape between one week and the next. Modeling it by position and hours rather than as a single wage number is what makes that reshaping visible, which is what the extra rows buy.
What this sheet is not is a timesheet. It costs the schedule as planned, so overtime, call-offs and the difference between hours rostered and hours actually worked all sit outside it. The number it produces is what the roster costs if the roster runs as written.
Daypart Mix: where the revenue actually comes from
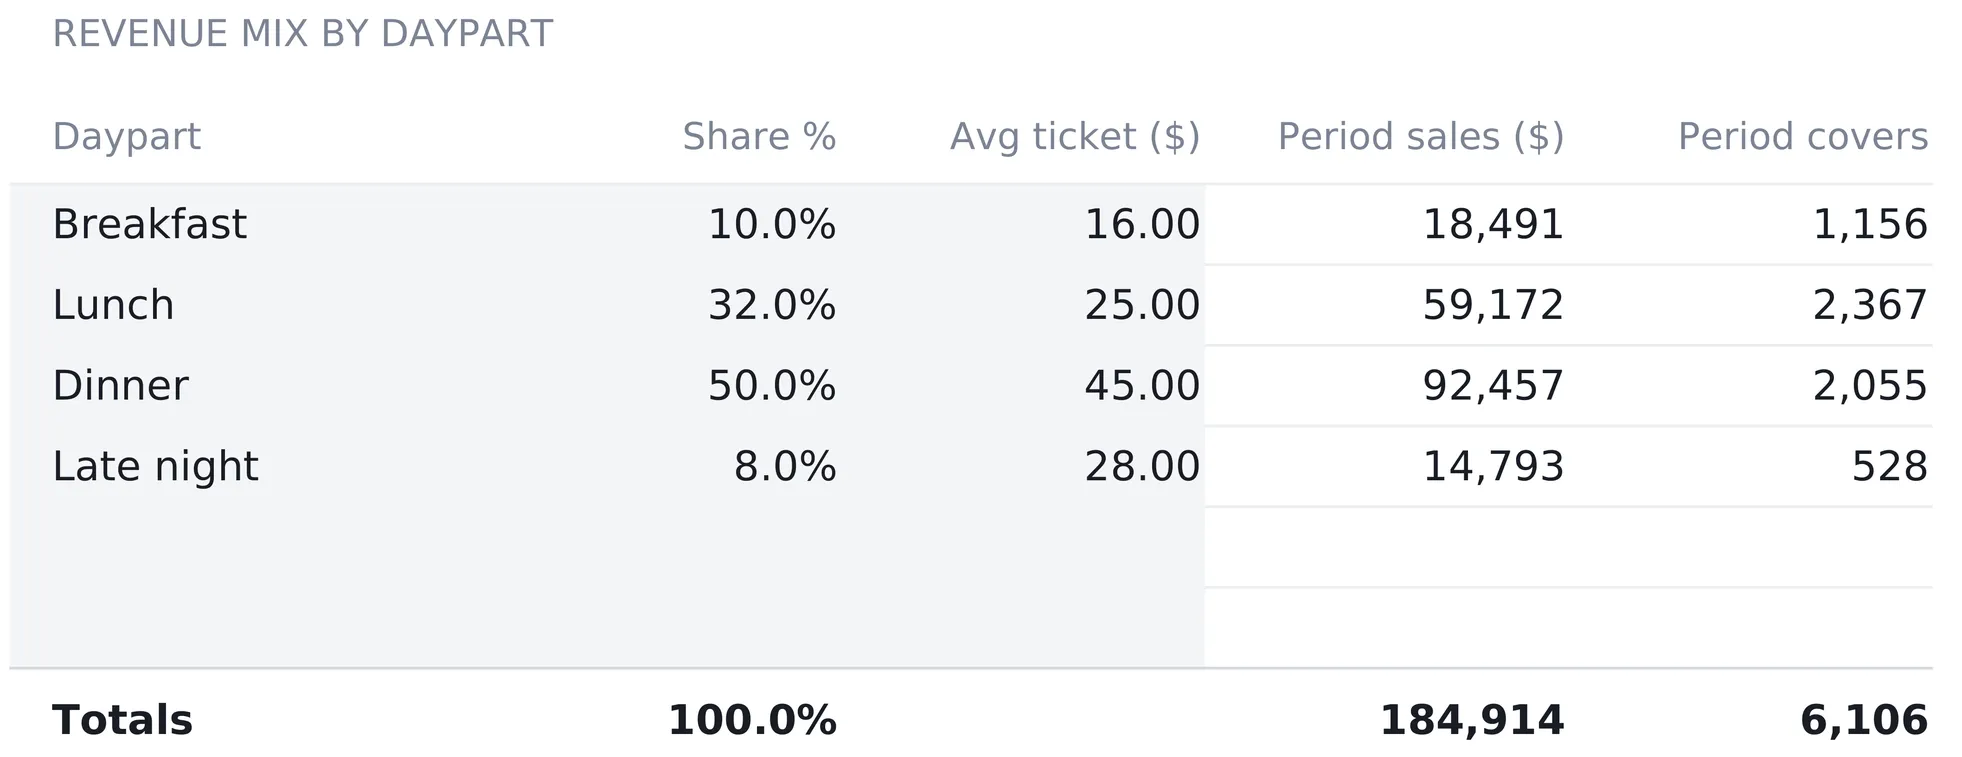
The Daypart Mix sheet takes the period total and splits it four ways by share of revenue. Each row carries a share percentage and an average ticket, and the sheet computes period sales as share times total, then implied covers as those sales divided by the ticket.
| Daypart | Share % | Avg ticket ($) | Period sales ($) | Period covers |
|---|---|---|---|---|
| Breakfast | 10.0% | 16.00 | 18,491 | 1,156 |
| Lunch | 32.0% | 25.00 | 59,172 | 2,367 |
| Dinner | 50.0% | 45.00 | 92,457 | 2,055 |
| Late night | 8.0% | 28.00 | 14,793 | 528 |
| Totals | 100.0% | 184,914 | 6,106 |
The two columns on the right disagree in a useful way. Dinner brings in half the revenue on a third of the covers, because a $45 ticket does the work of nearly three breakfasts. Breakfast is the mirror image, 19 percent of the covers for 10 percent of the money. Every one of those covers still needs a table turned, a server on the floor and a kitchen lit, none of which the revenue share reflects.
The totals line carries a built-in reconciliation. The four tickets imply 6,106 covers while the register rang up 6,097, and the sheet states both figures side by side in a note. That closeness is what tells you the share and ticket assumptions describe the same restaurant the register does. A daypart sheet implying four thousand covers against six thousand rang up is describing a different business.
The dashboard: eight tiles, break-even revenue, and a status banner
With the four input sheets filled, the Dashboard states the period.
| Metric | Sample value | How it is derived |
|---|---|---|
| Period revenue | $184,914 | Register total |
| Covers | 6,097 | Customers served |
| Avg ticket | $30.33 | Sales ÷ covers |
| EBITDA | $33,694 | Revenue - cost of sales - labor - opex |
| Cost of sales % | 37.5% | Food, paper and beverage ÷ revenue |
| Labor cost % | 31.8% | Period labor ÷ revenue |
| Prime cost % | 69.3% | Cost of sales plus labor ÷ revenue |
| EBITDA % | 18.2% | Of revenue |
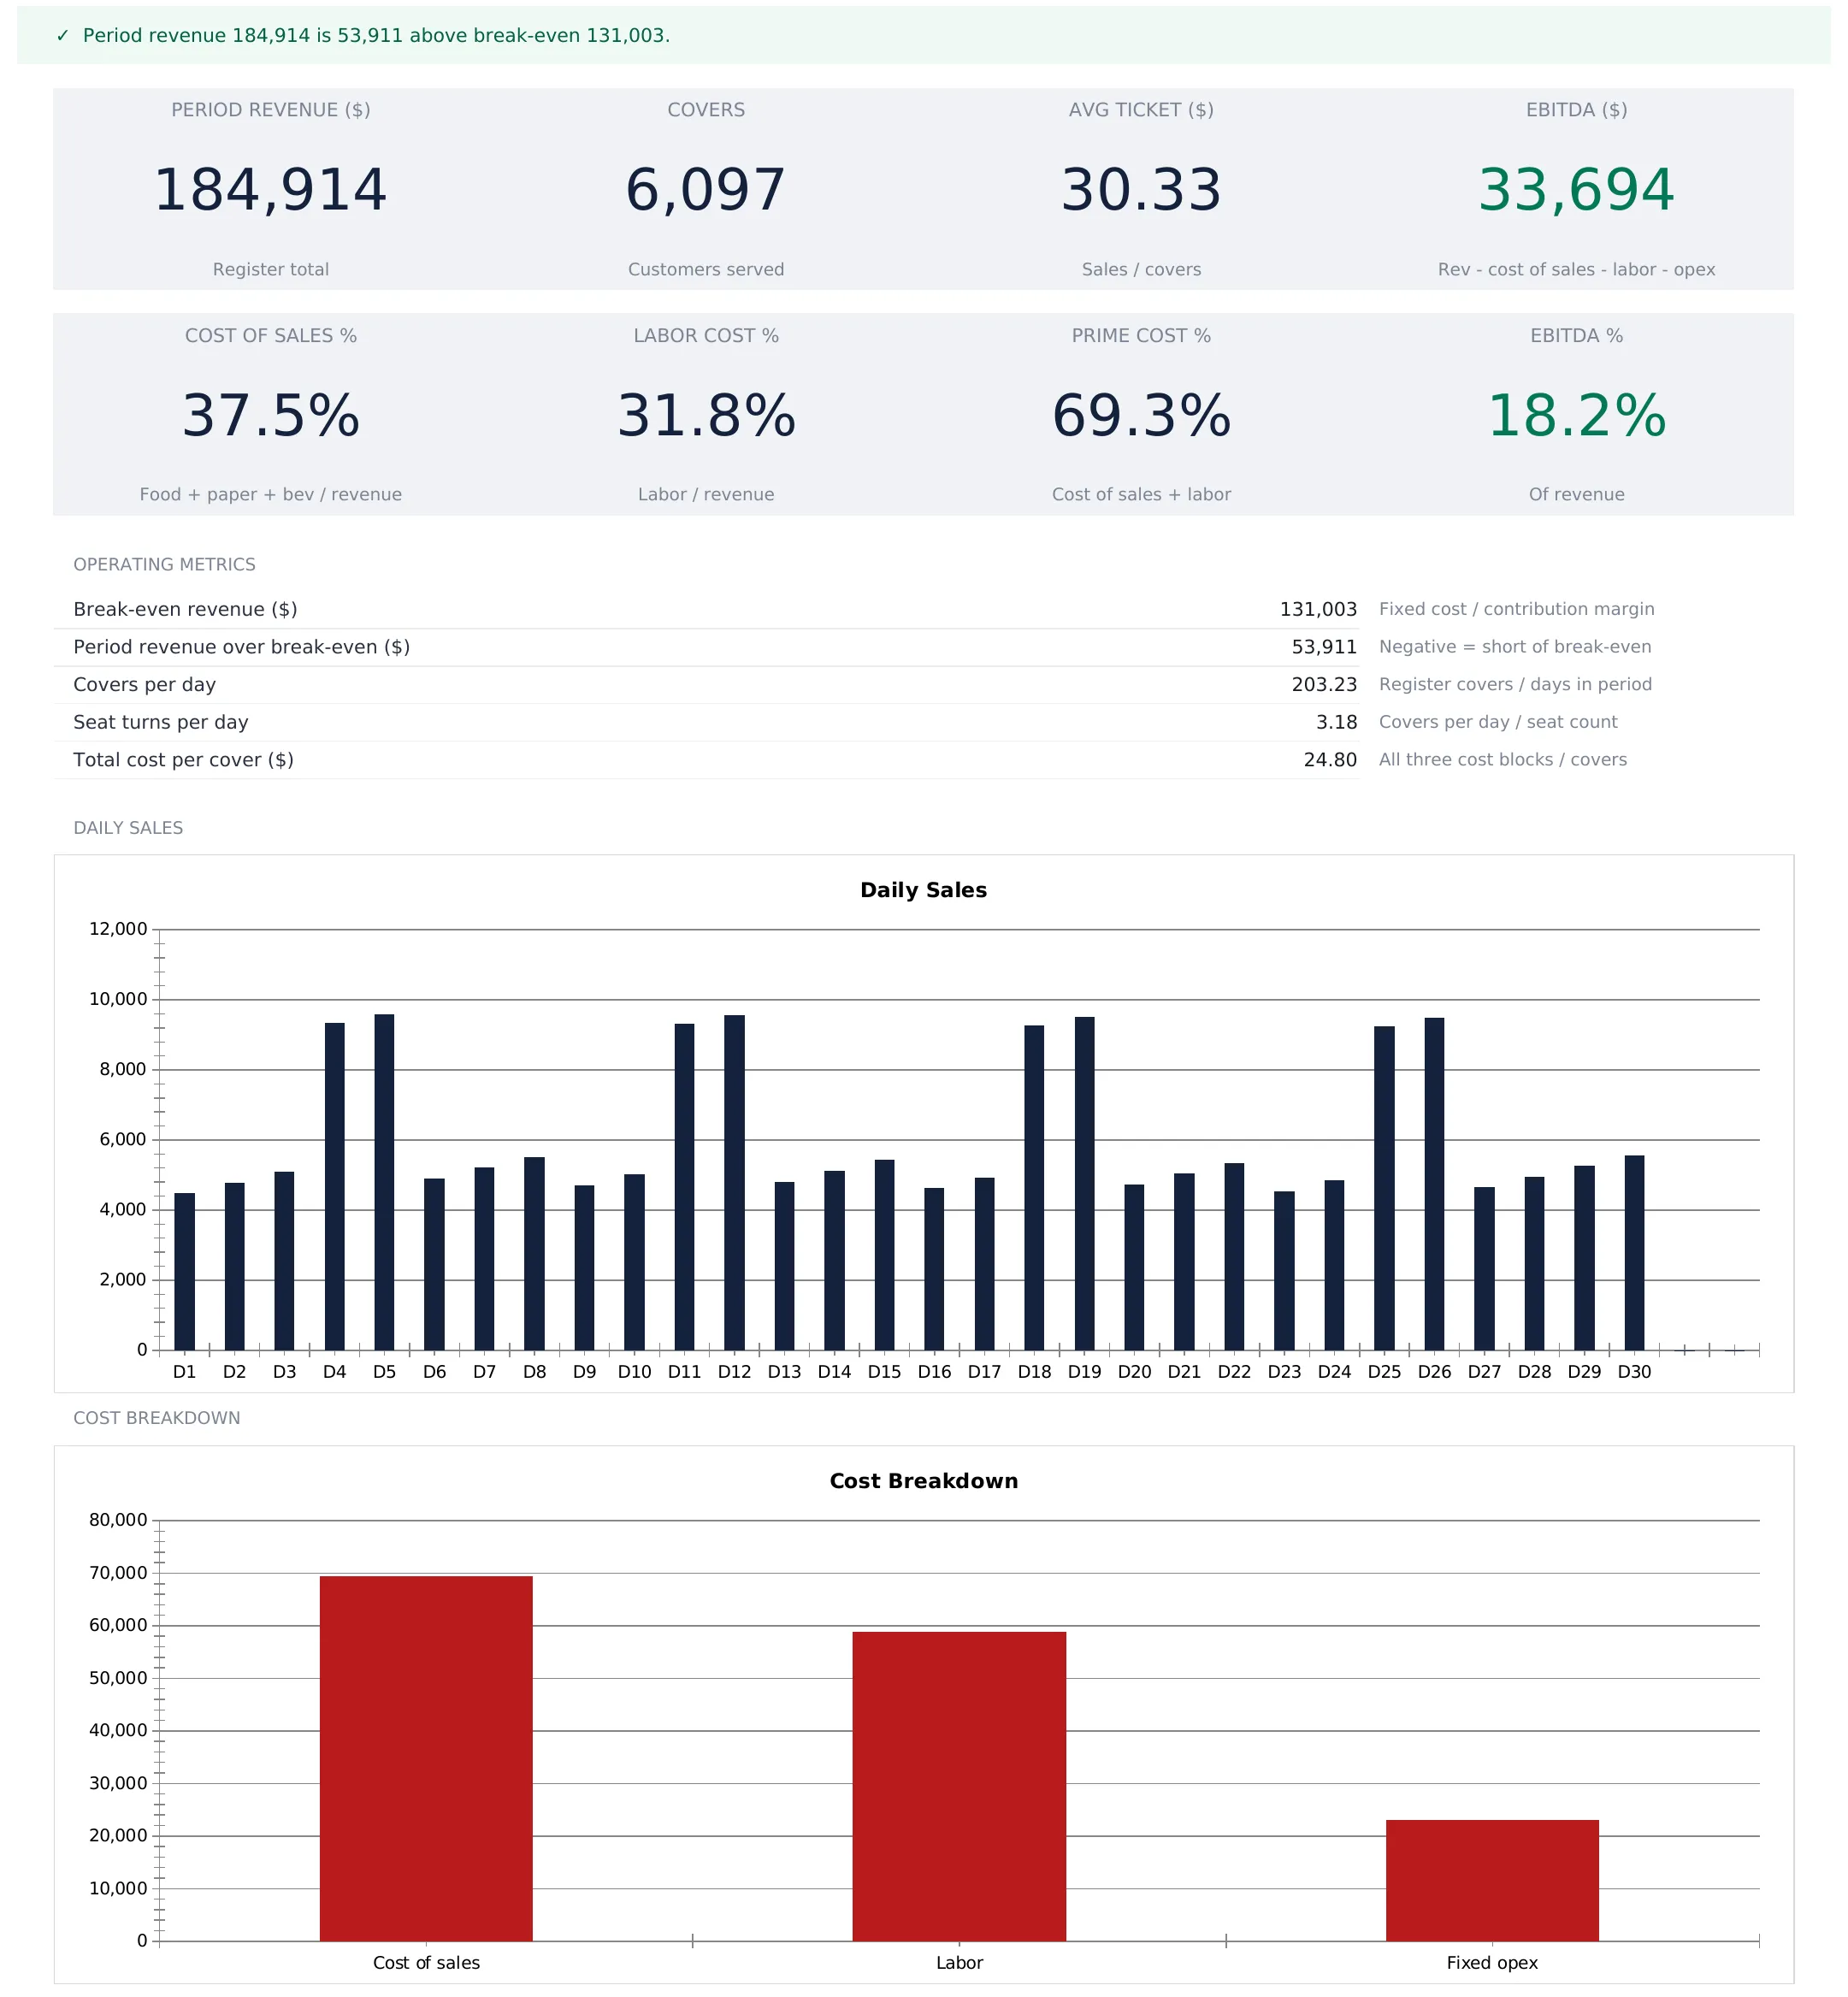
Below the tiles sit five operating metrics that no register report produces. Break-even revenue is $131,003, and the period cleared it by $53,911. Covers per day are 203.23, seat turns per day are 3.18, and total cost per cover, all three cost blocks divided by covers served, is $24.80.
Set that last figure against the $30.33 average ticket and the whole month fits in one line. Every cover through the door brings in $30.33 and costs $24.80 to serve, leaving about $5.53, and that margin across 6,097 covers is the $33,694 of EBITDA on the tile above.
A banner across the top of the sheet says the same thing in a sentence, reading period revenue 184,914 is 53,911 above break-even 131,003 on a green background. It flips to an amber warning when the period falls short. A third state covers the case where the variable rates reach 100 percent, at which point break-even has no answer to give and the banner says so in words rather than showing an error. Two charts close the sheet: one plots the 30 daily sales figures, the other shows the three cost blocks as bars, with cost of sales at $69,343 and labor at $58,877 both well above fixed opex at $23,000.
Food cost, labor cost and prime cost in plain terms
Three of those ratios carry the industry’s vocabulary, and all three are the same division with a different numerator.
Cost of sales percent, 37.5 percent here, is what the food, drink and packaging that go out the door cost against the revenue they generated. Since the three rates behind it are typed, this ratio reports the assumption back rather than discovering anything.
Labor cost percent is the period roster cost against the same revenue, 31.8 percent here. It is not a typed rate, because the roster is a fixed weekly amount while revenue moves, so this figure falls in a busy month and rises in a quiet one without a single cell changing.
Prime cost adds the two, 69.3 percent. It is reported as one number because the two halves substitute for each other in practice. Buying prepared products raises food cost and cuts kitchen hours, scratch cooking does the reverse, and either move looks like an improvement if you watch only one half. Prime cost is the figure that does not shift when the work moves from one side of the line to the other.
The obvious next question is whether 69.3 percent is good, and that is the one thing the workbook does not answer. It reports the figure and carries no benchmark. Published rules of thumb exist, but they vary by service format, by region and by how each operator classifies costs. Some operators sidestep that entirely and compare a period against their own earlier periods, computed the same way each time.
What is left after prime cost has to cover the fixed block, which is the $23,000 of occupancy, utilities, marketing and repairs. In the sample that leftover is just under 31 percent of revenue, roughly $56,700, and the $33,694 of EBITDA is what remains once the $23,000 comes out of it.
What this model leaves out
Knowing the gaps is part of using any model, and this one has clear edges.
It is pre-tax and pre-interest by construction. EBITDA is revenue less the three cost blocks, so loan payments, depreciation on the fit-out and income tax all sit outside it. It also holds no balance sheet, which means no inventory value, no accounts payable and no cash position. A restaurant can post the sample’s $33,694 of EBITDA and still be short of cash on the fifteenth if the invoices land badly.
The food cost line models a rate rather than a count. Actual cost of goods sold is inventory arithmetic, opening stock plus purchases minus closing stock, and for a sole proprietor filing Schedule C that calculation is covered in IRS Publication 334. The model’s rate view and the tax view answer different questions, and the rate view is the one that responds when you change an assumption.
The register caps at 32 dated rows, which fits a month or any shorter period and rules out a quarter in one file. Break-even is reported as revenue rather than as a cover count. And the whole workbook models one unit, with a single business name and a single seat count on Settings, so a second location is a second copy of the file.
None of that makes it a replacement for a POS report or a bookkeeping system, which read actual transactions and actual invoices. The model reads assumptions. That is the reason it can answer a question about next month, and the reason it cannot tell you what happened to the walk-in last week.
Excel or Google Sheets for a restaurant financial model
The template is an .xlsx file built on plain formulas, with no macros and no add-ons, so it behaves identically in Microsoft Excel and in Google Sheets after upload. The choice usually comes down to who types the register. Google Sheets suits a manager entering covers and sales from a phone at close, with the owner reading the dashboard from somewhere else the next morning. Excel suits keeping a file per period on one machine. The structure described above is buildable by hand in either.
Which spreadsheet template fits which job
- Restaurant Financial Model Spreadsheet Template ($59) is the workbook this walkthrough follows: the daily register, variable and fixed cost blocks, the labor roster, the daypart split, and a dashboard carrying prime cost, EBITDA, break-even and seat turns for a single unit.
- Break-Even Analysis Spreadsheet Template ($29) takes the break-even question on its own and goes further into it, working per product as well as blended, with a sensitivity table and a tornado chart behind the single break-even figure the restaurant dashboard reports.
- Business Bookkeeping Spreadsheet Template ($29) covers the recording side that the model deliberately skips, a transaction ledger with a chart of accounts, a monthly rollup and a profit and loss summary that builds itself from the transactions.
- The three are sold together as the Restaurant Owner Bundle ($79, from $117).
Related
- Spring Sprint: Our Business Spreadsheet Library, Built Out - the wider set of business workbooks, including the other industry models
- How to Forecast Cash Flow for a Small Business - the month-by-month cash view that sits alongside an operating model
- Google Sheets vs Excel for Business Cash Flow - the platform question in more detail
Frequently asked questions
What is prime cost, and how does the spreadsheet calculate it?
Prime cost is cost of sales plus labor, measured against revenue in the same period. The model computes each half separately and adds them. In the sample, cost of sales is food, paper and beverage at 37.5 percent of revenue, labor is the period roster cost at 31.8 percent, and prime cost is 69.3 percent. The workbook reports the figure and carries no target for it.
Why does the model take food cost as a percentage of sales instead of actual invoices?
Because the rate is the thing being modeled. Each variable line on the Cost Model sheet is a rate multiplied by the register total, so food cost at 30 percent of $184,914 computes to $55,474 and moves the moment either the rate or the sales figure changes. That is a planning view rather than an accounting one. Actual cost of goods sold for a tax return is inventory arithmetic, opening stock plus purchases minus closing stock, which IRS Publication 334 covers for sole proprietors filing Schedule C.
How is break-even revenue derived, and when does it read N/A?
Break-even revenue is the period labor cost plus fixed operating costs, divided by one minus the total variable cost rate. In the sample that is $58,877 plus $23,000, or $81,877, divided by 0.625, which gives $131,003. The figure reads N/A when the variable rates on the Cost Model sheet reach 100 percent or more, because at that point no volume of sales covers the fixed block and break-even has no answer. The dashboard banner says so in words rather than showing an error.
Can the model cover a week or a quarter instead of a month?
The register holds 32 dated rows, so any period up to 32 days fits, and the sample fills 30 of them. The period length itself is a separate typed figure on Settings called days in period, which scales the weekly labor roster and drives covers per day and seat turns. It is not read from the register, so a week-long register with days in period still set to 30 would report labor and per-day metrics for a month. A quarter does not fit the 32-row register.
Can one file model more than one location?
One unit per file. Settings holds a single business name, a single seat count and one days-in-period figure, and every sheet reads from those, so a second restaurant is a second copy of the workbook. Operators running several units sometimes keep one file per location and compare the dashboard tiles side by side, since prime cost and seat turns are already stated as ratios and compare directly across sites of different sizes.
Sources
- About Publication 334, Tax Guide for Small Business (For Individuals Who Use Schedule C) - Internal Revenue Service
About this article
Every figure, sheet name, formula, and feature description verified against the published Restaurant Financial Model Pro workbook (the exact file customers download). IRS Publication 334 reference checked against the live IRS page at writing time. Last reviewed August 2026.