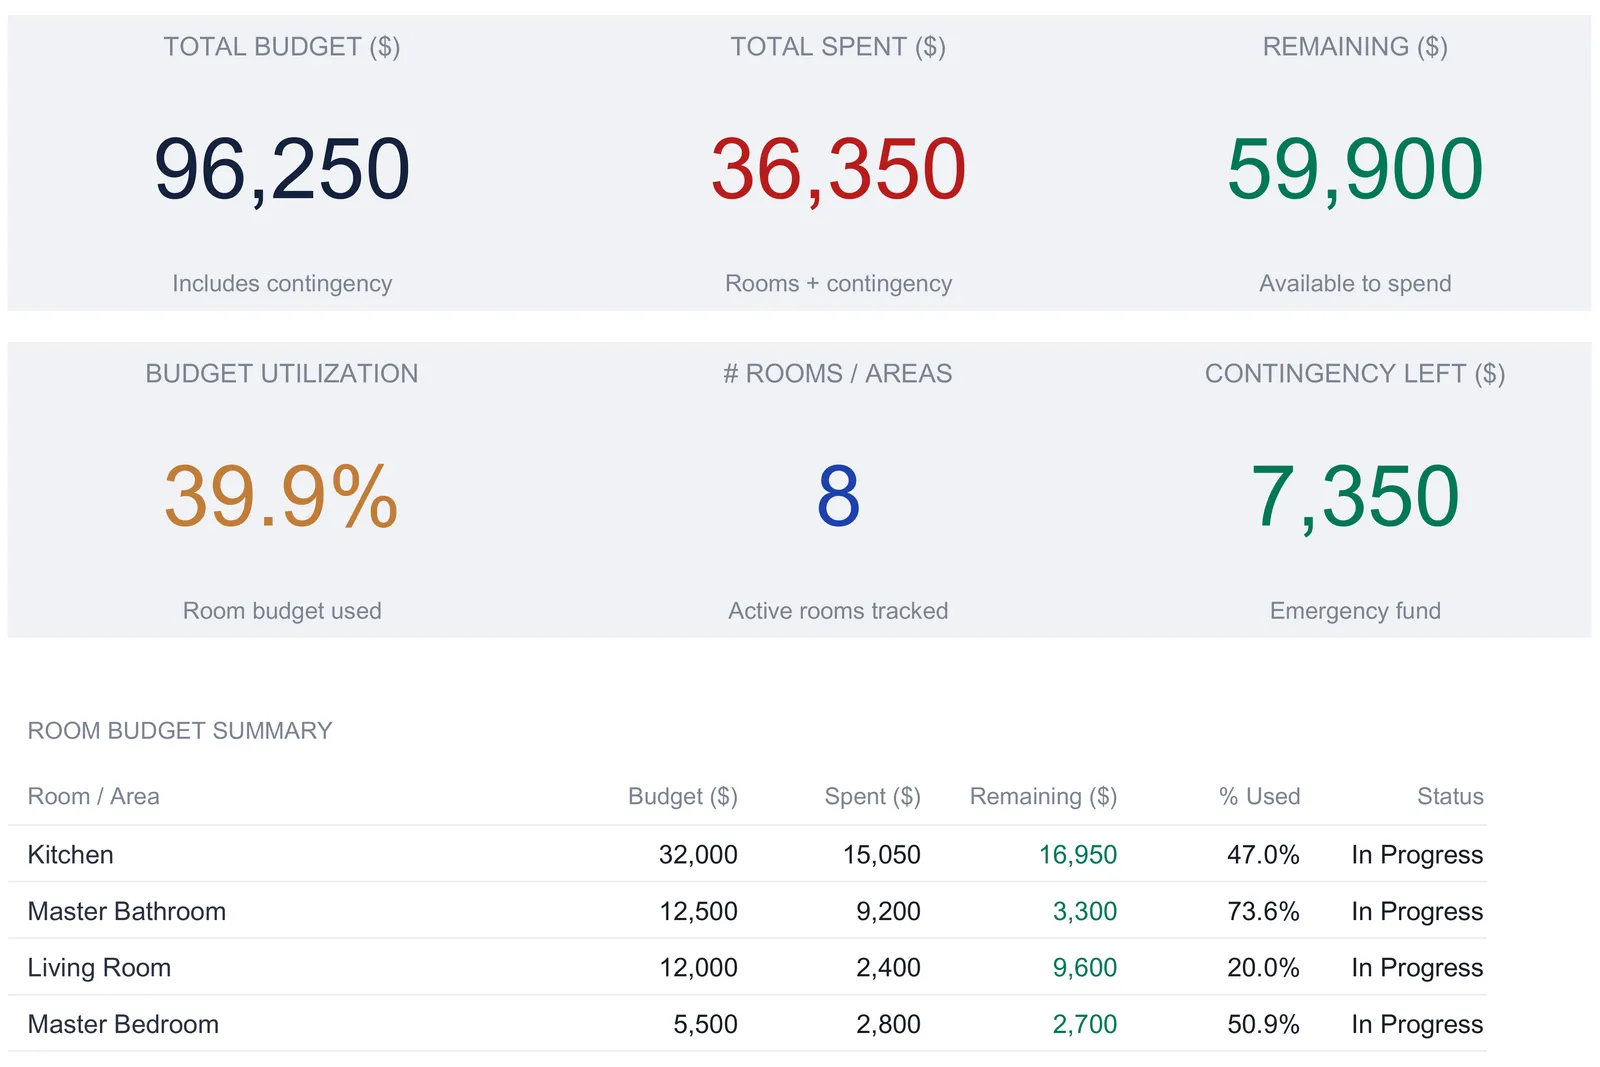
A home renovation budget spreadsheet plans the job room by room, tracks every contractor quote and payment, and keeps a contingency fund on its own line so a surprise shows the moment it lands. This walkthrough follows the full structure with a worked example, an eight-room project carrying a $96,250 total budget, $36,350 spent so far, and $59,900 still available. Our Home Renovation Budget Ultimate Spreadsheet Template ($29) ships the same structure ready-made for Excel and Google Sheets.
A renovation spends money in two directions at once, and that is what makes it hard to hold in your head. Estimates go out room by room while cash goes out contractor by contractor, and the two never line up cleanly until the last invoice clears. A kitchen can be half demolished and fully paid in deposits, or finished and still carrying a balance. Most people running a project can say what the general contractor was paid last week. Far fewer can say, without digging, how the kitchen is tracking against its budget, how much of the contingency is already gone, or what the whole job will cost once the rooms that have not started yet are counted in. The gap between those questions is structure, and a spreadsheet built for a renovation closes it.
That structure is a set of sheets that hand off in order: a room-by-room budget, a 100-line detail sheet under it, a contractor tracker, a payment log, a budget-versus-actual view, and a dashboard that reads everything back. The examples below come from our Home Renovation Budget Ultimate Spreadsheet Template ($29), which ships the whole thing ready-made for Excel and Google Sheets. Everything it does is reproducible by hand if you would rather build your own renovation budget spreadsheet from scratch.
What a renovation budget spreadsheet has to hold, and what a single list leaves out
A one-column budget list and a working renovation tracker are not the same document. A list answers “what did I plan to spend?” and then, if it is kept current, “what have I spent so far?” That is the right size for a small, single-room refresh handled by one contractor. A larger job across several rooms and a dozen trades asks harder questions, and this workbook is built to answer them. It carries four things a single list does not.
- A room dimension. Every cost belongs to a room or area, and almost every rollup in the file, the dashboard, the budget-versus-actual view, the spend-by-room chart, cuts by room. That is what turns a pile of receipts into a view of where the money is going.
- Detail under the headline. Each room budget is not a single number typed from a guess. It is the sum of up to ten line items, so a $32,000 kitchen is demolition, framing, plumbing, electrical, cabinets, countertops, and the rest, each with its own estimate, its own actual, and its own vendor.
- Contractors and cash, tracked apart from the plan. A dedicated Contractor Tracker carries every quote and what has been paid against it, and a Payment Schedule logs each disbursement with a running total, so the file answers “what do I still owe?” separately from “what did I budget?”
- A contingency that stays visible. A separate reserve sits on its own line with its own spent and remaining figures, so the buffer shrinks in plain sight as surprises hit rather than disappearing into padded estimates.
A job that spans several rooms and a dozen trades, with a five-figure budget and payments spread across months, is exactly the kind of project that rewards this much structure. The walkthrough below follows the sheets in the order the work happens, starting with the room budget that feeds all of them and a How to Use sheet that carries the instructions.
Set the room budgets: the Project Overview sheet
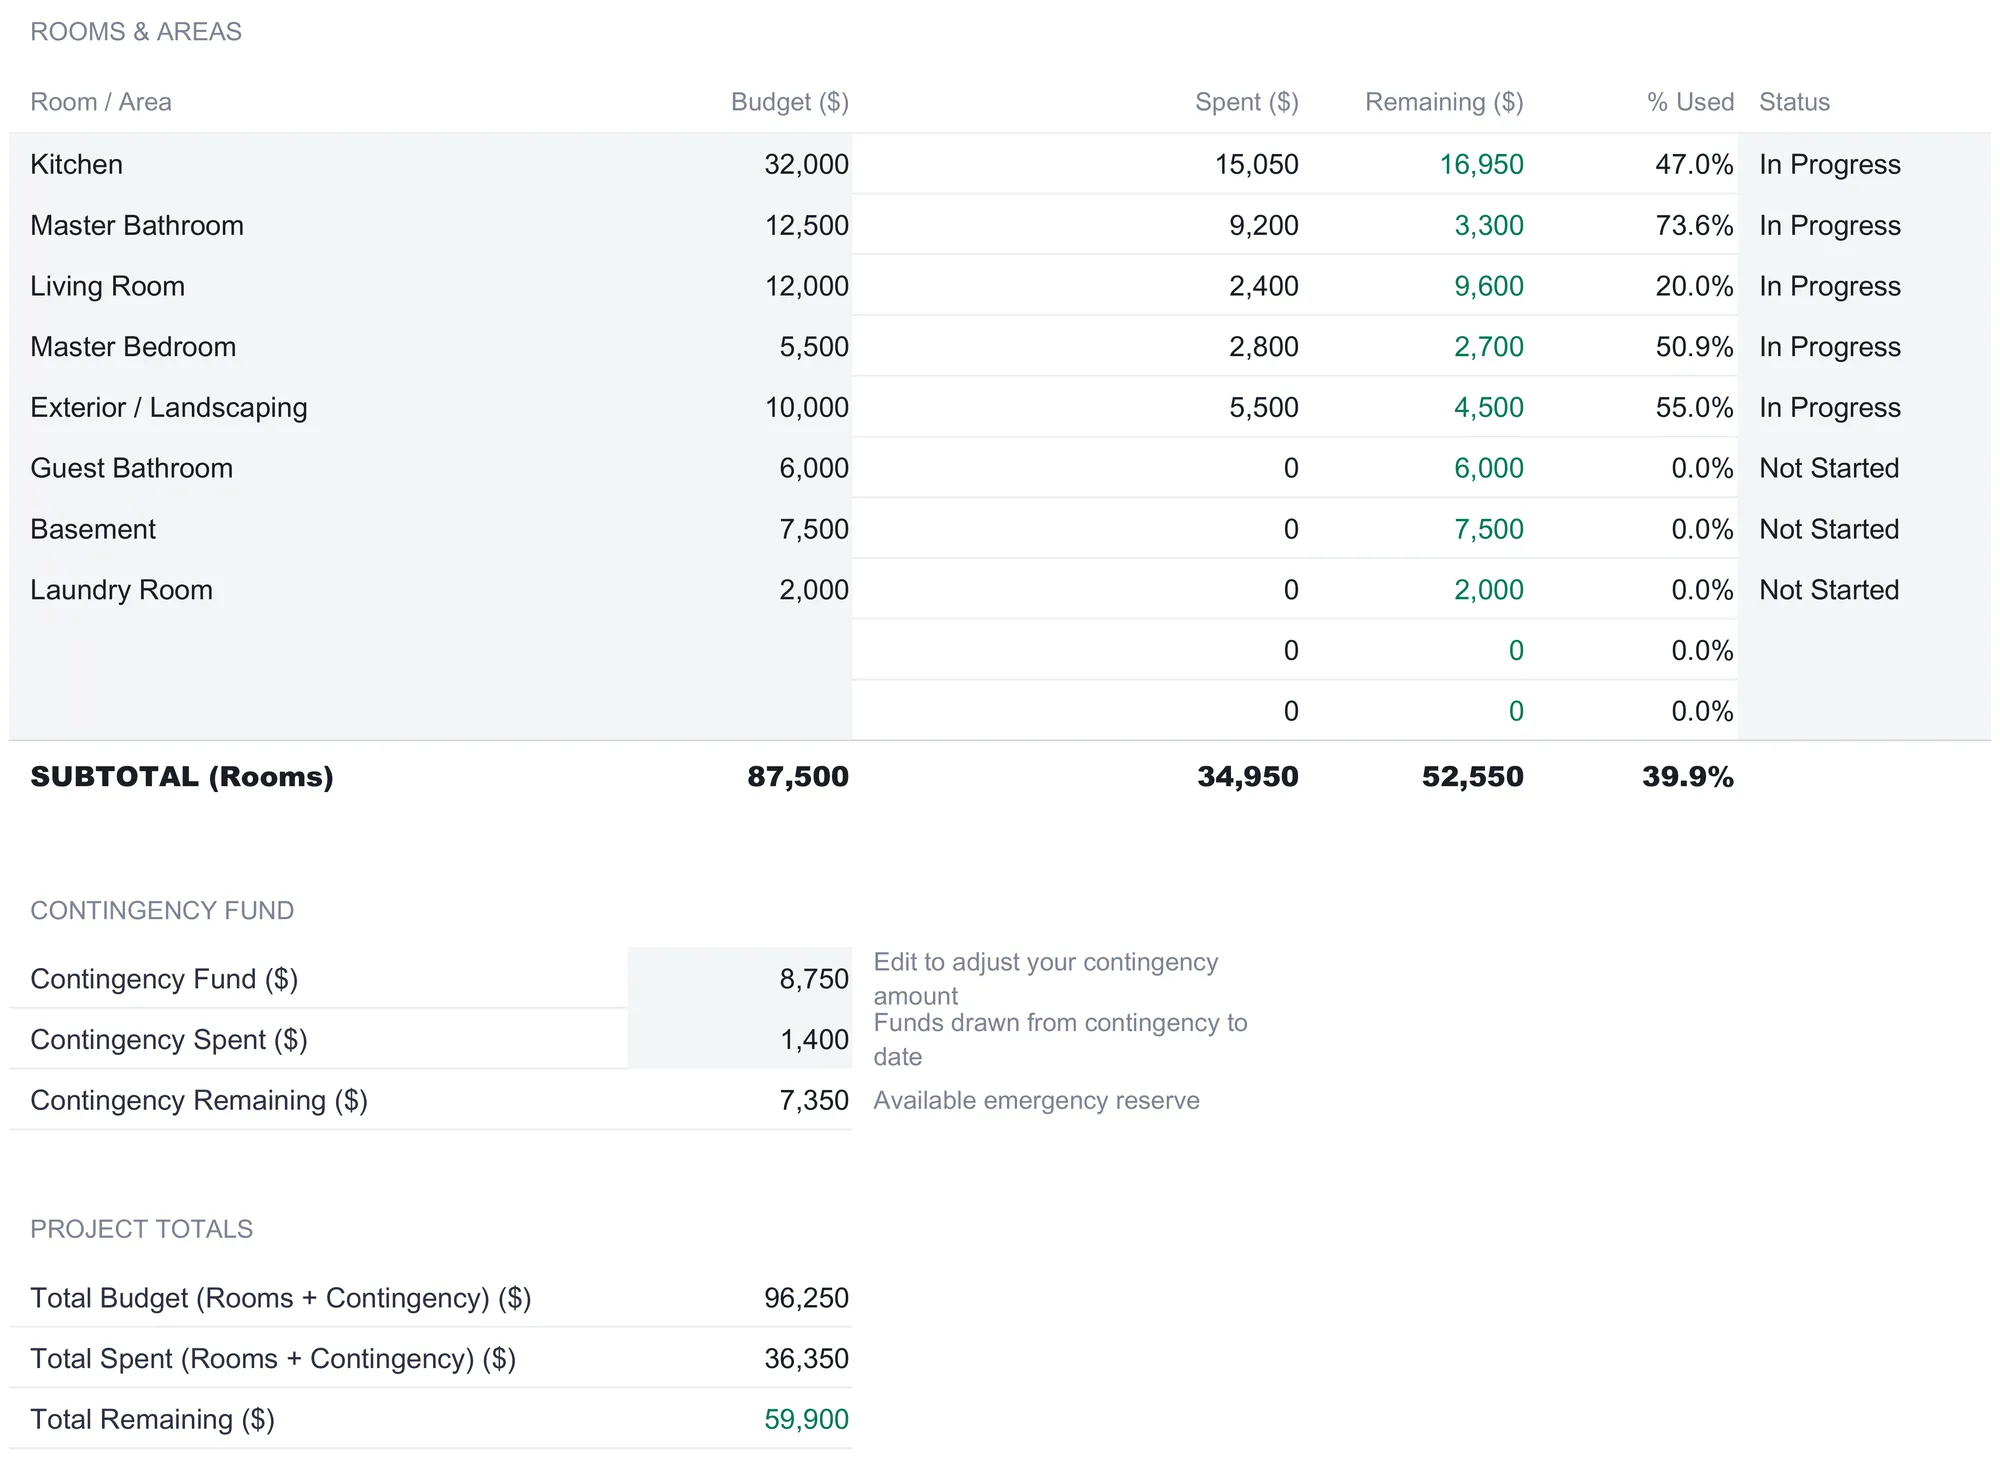
Project Overview is where the whole job is framed in one screen, and every working sheet reads back from it. It holds up to 10 rooms, and for each one the sheet lays out a budget, the amount spent, the remaining balance, a percentage used, and a status. Only the room name, the budget, and the status are typed; the rest computes. The sample carries an eight-room project.
| Room / Area | Budget ($) | Spent ($) | Remaining ($) | % Used | Status |
|---|---|---|---|---|---|
| Kitchen | 32,000 | 15,050 | 16,950 | 47.0% | In Progress |
| Master Bathroom | 12,500 | 9,200 | 3,300 | 73.6% | In Progress |
| Living Room | 12,000 | 2,400 | 9,600 | 20.0% | In Progress |
| Master Bedroom | 5,500 | 2,800 | 2,700 | 50.9% | In Progress |
| Exterior / Landscaping | 10,000 | 5,500 | 4,500 | 55.0% | In Progress |
| Guest Bathroom | 6,000 | 0 | 6,000 | 0.0% | Not Started |
| Basement | 7,500 | 0 | 7,500 | 0.0% | Not Started |
| Laundry Room | 2,000 | 0 | 2,000 | 0.0% | Not Started |
| Subtotal (Rooms) | 87,500 | 34,950 | 52,550 | 39.9% |
The Spent column does no typing of its own. It reads each room’s own total from the Room Budgets sheet, so the moment a line item is entered downstream, the room’s spent figure and its remaining balance move with it. Remaining is simply Budget minus Spent, and % Used is Spent divided by Budget, which is why the Kitchen reads 47.0 percent used against its $32,000 while the Living Room, barely begun, reads 20.0 percent. The Status tag is a dropdown of Not Started, In Progress, or Complete, and it feeds both the dashboard and the milestone tracker, so the three rooms still marked Not Started in the sample, the guest bathroom, the basement, and the laundry room, carry through the whole file as work that is budgeted but not yet touched.
Below the room list sits the piece that separates a renovation budget from an ordinary one. The contingency fund is its own block: a $8,750 reserve in the sample, with $1,400 already spent and $7,350 remaining. The How to Use sheet notes the sample ships that reserve at 10 percent of the $87,500 of room budgets, and the figure is a plain input cell, so raising it for an older house or lowering it for a straightforward job is a single edit. Keeping it here, apart from the rooms, is what lets the file report a room budget and an emergency reserve as two different numbers rather than one soft total that quietly absorbs every overrun.
Those two blocks roll up into Project Totals. The Total Budget of $96,250 is the $87,500 of rooms plus the $8,750 contingency. The Total Spent of $36,350 is the $34,950 of room costs plus the $1,400 drawn from contingency. The Total Remaining of $59,900 is the difference. That is the headline the dashboard reports, and it is built from figures that every other sheet can trace back to.
Build the detail: the Room Budgets sheet
A room budget on the overview is a headline; the Room Budgets sheet is where that headline is earned. It gives each of the ten rooms its own block of ten line items, 100 detail lines in all, and each line carries an item name, an estimated cost, an actual cost, a variance, a vendor, and a status. The room headings are not typed twice, either. They follow the names entered on Project Overview automatically, so renaming a room in one place relabels its block here.
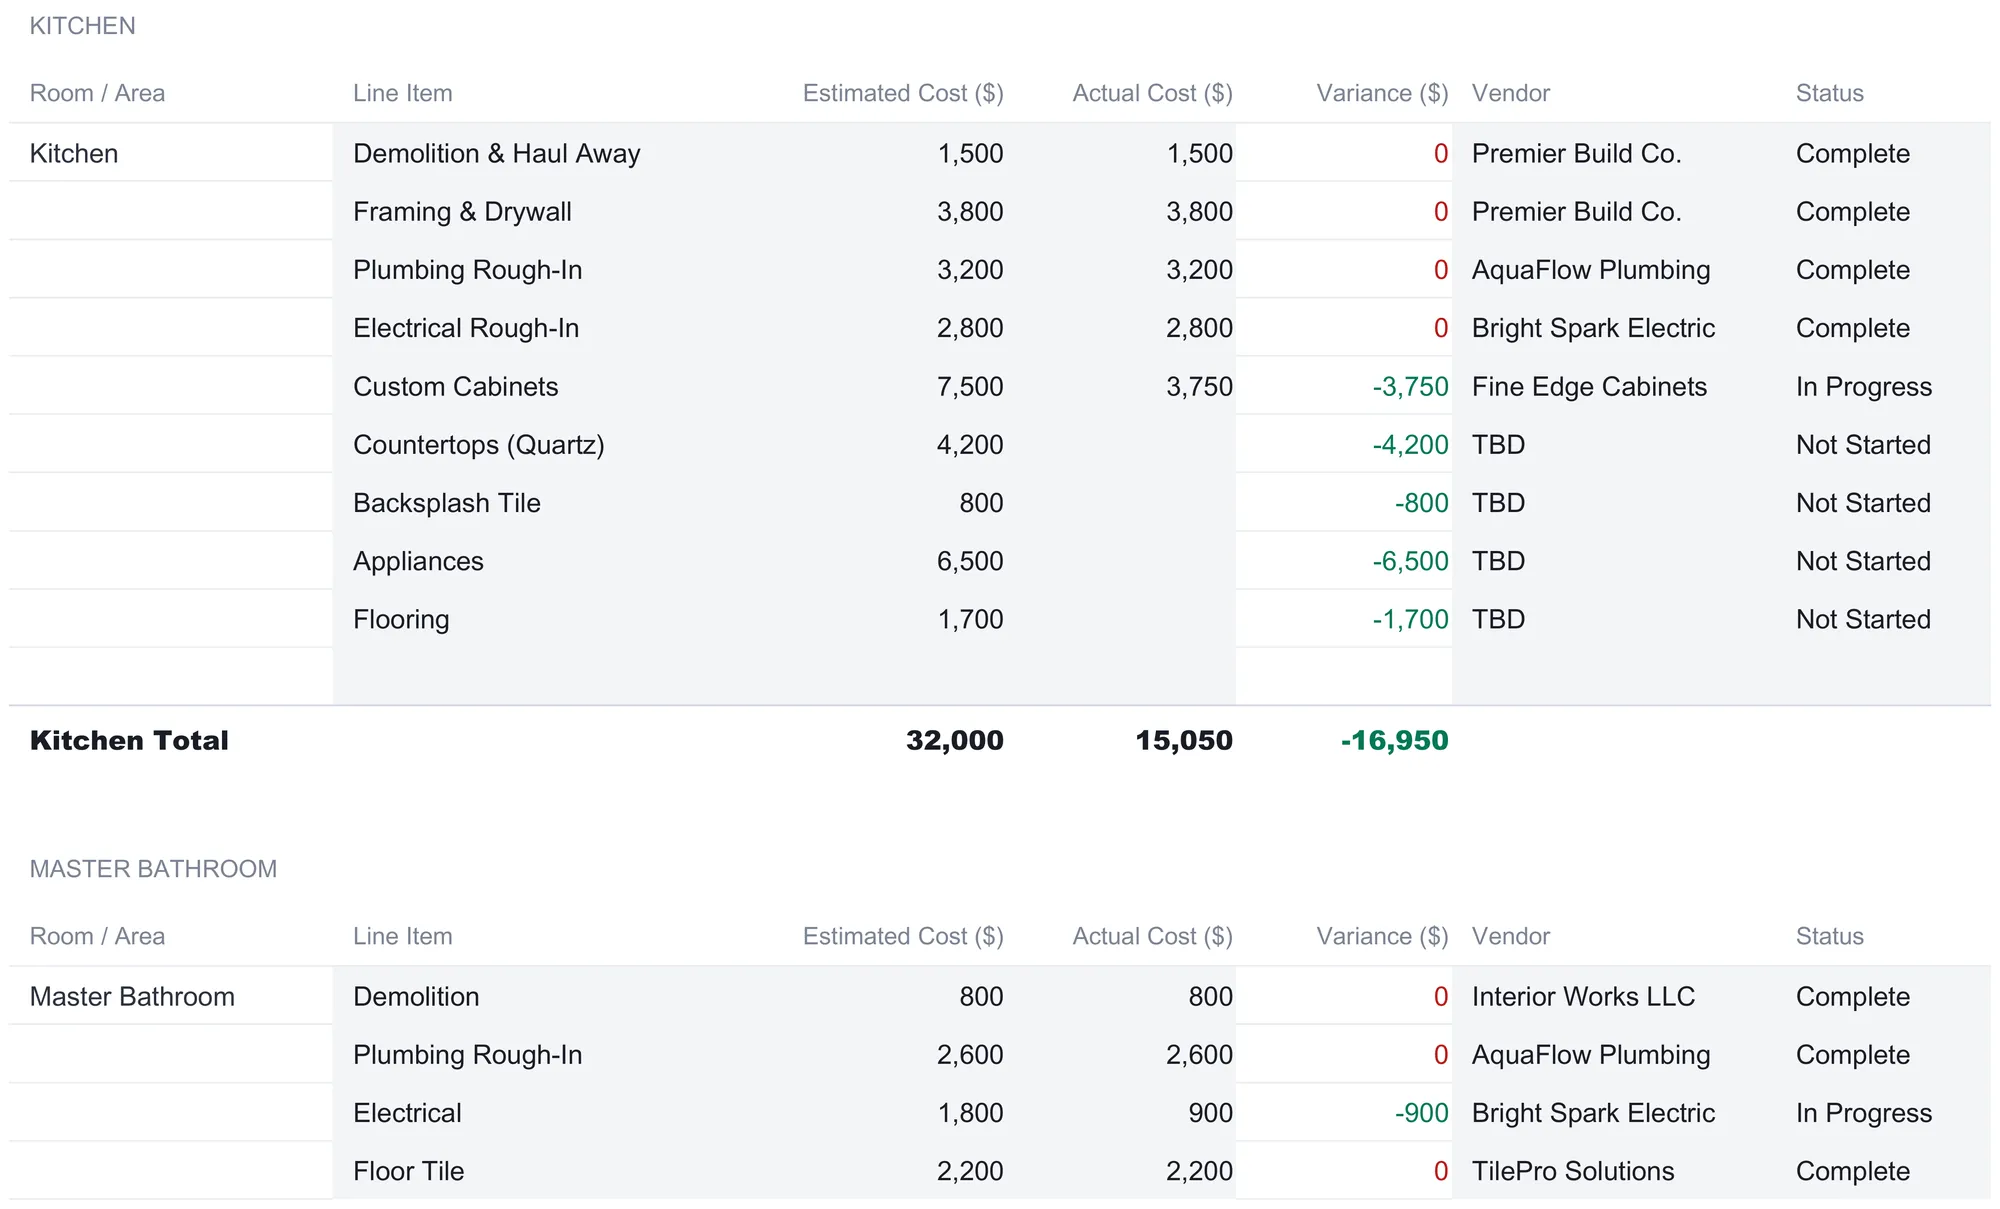
The kitchen block makes the pattern concrete. Its nine estimates add up to the $32,000 budget on the overview, which is the habit the sample models throughout: the room budget is the sum of its parts rather than a round number pulled from the air.
| Line Item | Estimated ($) | Actual ($) | Variance ($) | Status |
|---|---|---|---|---|
| Demolition & Haul Away | 1,500 | 1,500 | 0 | Complete |
| Framing & Drywall | 3,800 | 3,800 | 0 | Complete |
| Plumbing Rough-In | 3,200 | 3,200 | 0 | Complete |
| Electrical Rough-In | 2,800 | 2,800 | 0 | Complete |
| Custom Cabinets | 7,500 | 3,750 | -3,750 | In Progress |
| Countertops (Quartz) | 4,200 | -4,200 | Not Started | |
| Backsplash Tile | 800 | -800 | Not Started | |
| Appliances | 6,500 | -6,500 | Not Started | |
| Flooring | 1,700 | -1,700 | Not Started | |
| Kitchen Total | 32,000 | 15,050 | -16,950 |
Variance here is Actual minus Estimated, so a line that has not been paid yet shows the full negative of its estimate and the completed lines that came in on budget show zero. It reads as a running measure of how much of the estimate is still to come rather than a verdict on overspending, and the render colors a negative variance green. A line that overran would swing positive and flag red, which is the moment the sheet is built to make obvious. The Vendor column carries the trade doing each line, and the not-yet-assigned lines read a plain “TBD” so an unbooked cost is visible rather than blank.
The value of the detail is that it explains the headline. The kitchen shows 47.0 percent of its budget used not because someone estimated it that way, but because demolition, framing, and the rough-ins are done and paid while the cabinets are half in and the countertops, tile, appliances, and flooring have not started. Anyone reading the overview sees a number; anyone reading the detail sees why. As on every input sheet here, the blank line below the filled ones is already wired into the room total, so a cost nobody planned for goes on the first free row and flows straight into the room, the overview, and the dashboard with no formula to touch.
Track who is doing the work: the Contractor Tracker sheet
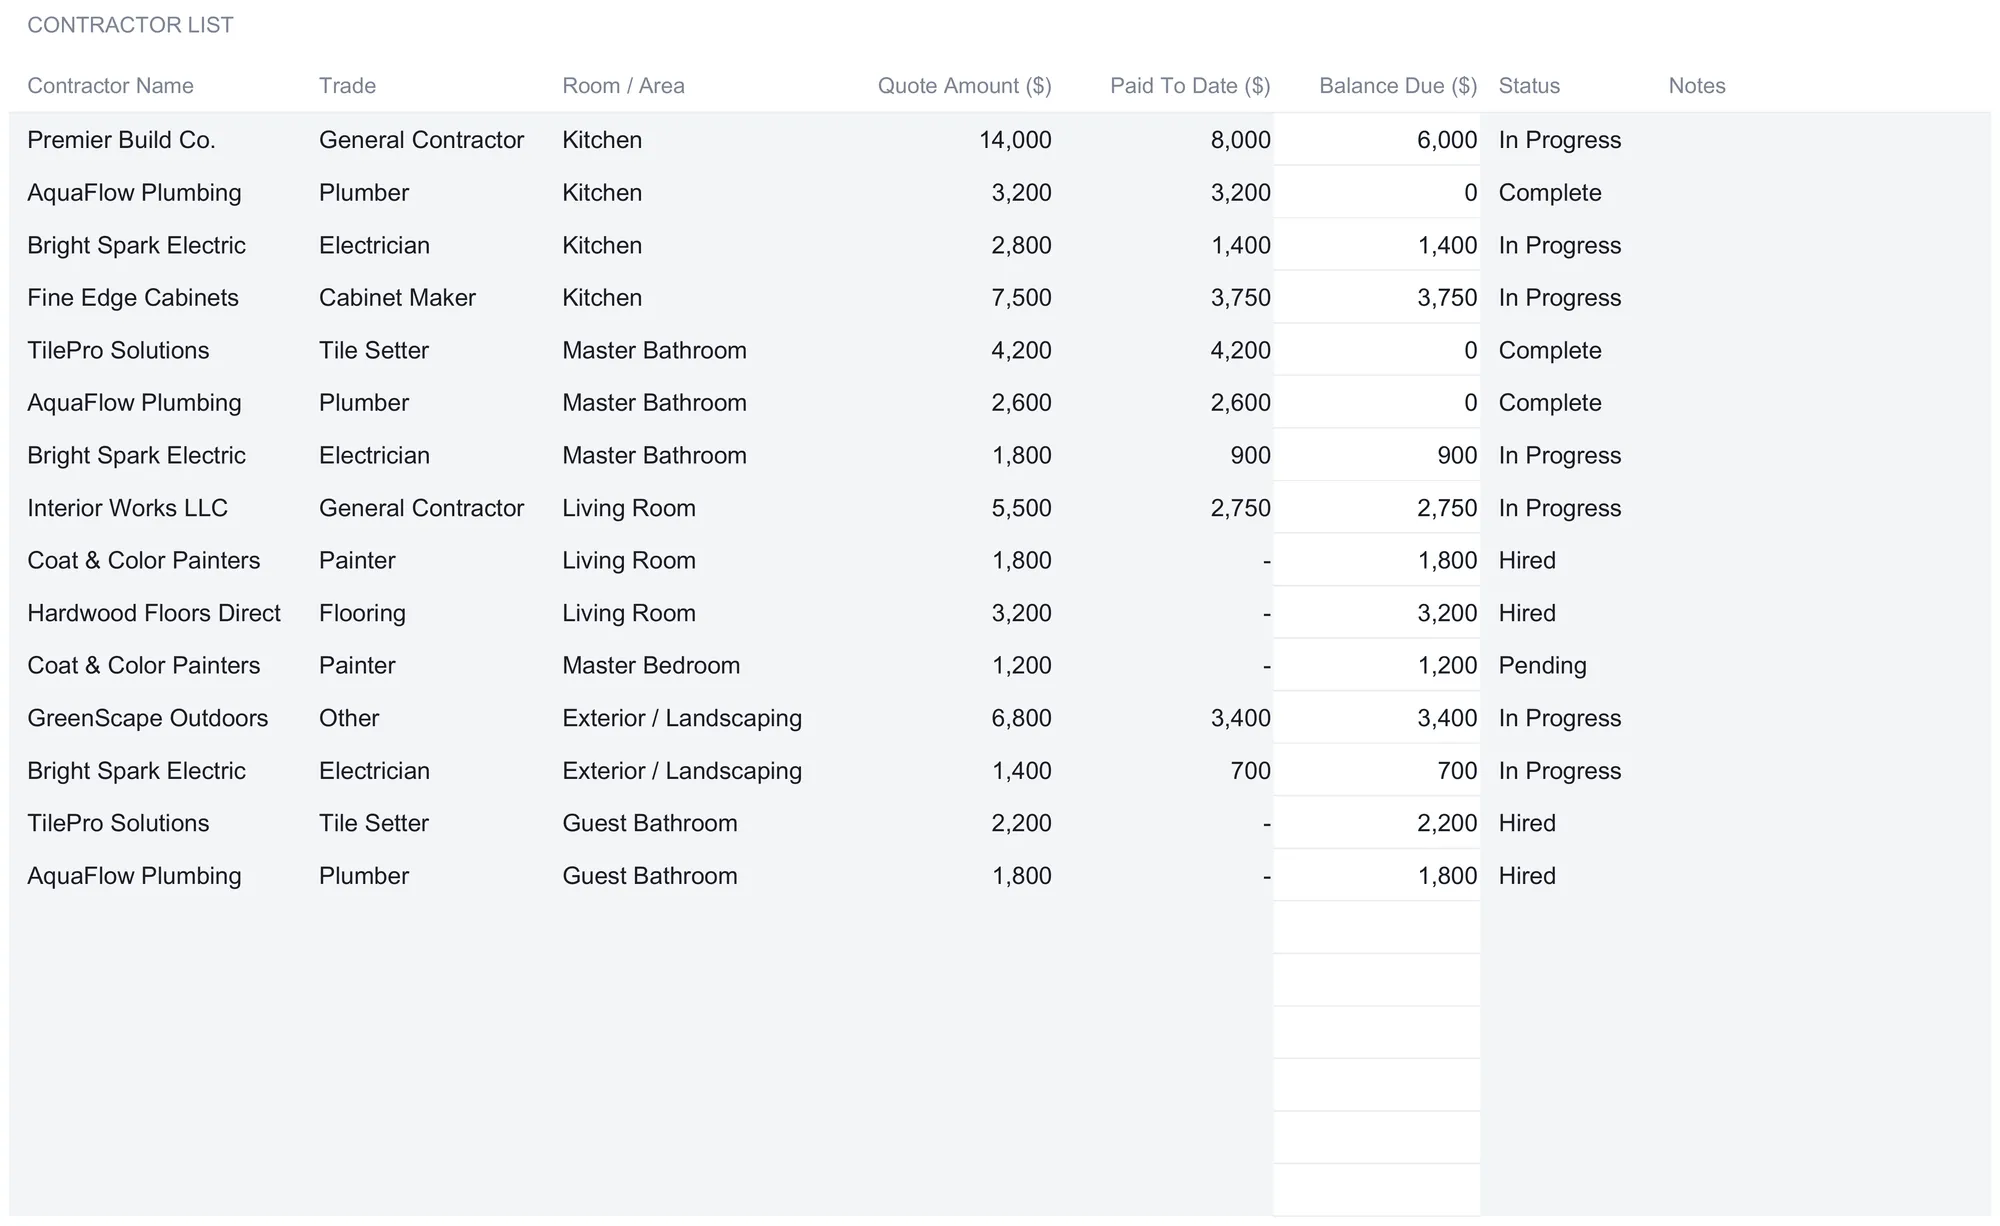
Rooms are one way to slice a renovation; the people doing the work are another, and they do not map one to one. A single plumber shows up in the kitchen, the master bathroom, and the guest bathroom, and the kitchen alone runs through a general contractor, a plumber, an electrician, and a cabinet maker. The Contractor Tracker holds up to 30 of them, and for each it carries a name, a trade, the room, the quote amount, what has been paid to date, the balance due, a status, and a notes field.
Balance Due is the one figure that computes, and it is simply the quote minus what has been paid. Premier Build Co., the general contractor on the kitchen, quoted $14,000 and has been paid $8,000, so it carries a $6,000 balance and a status of In Progress. Across the 15 contractor rows in the sample, the quotes total $60,000, the payments to date total $30,900, and the balance still owed is $29,100. That $29,100 is the number no room budget shows on its own: the outstanding commitment to the people already hired, sitting alongside the $59,900 of budget still unspent.
The status column is a dropdown of Hired, In Progress, Complete, and Pending, which is how a contractor moves from a quote in hand to a job signed off. Trade is a dropdown too, offering General Contractor, Plumber, Electrician, Carpenter, Painter, Tile Setter, Cabinet Maker, Flooring, HVAC, and Other. The sample lists its rows room by room rather than by craft, so the four kitchen trades sit together at the top and the two guest bathroom rows sit at the bottom. None of it feeds the room budgets directly, which is deliberate. The room sheets track what the work costs; the contractor sheet tracks who is owed for it, and reading the two side by side is how a project sees both its budget and its obligations at once.
Log the cash as it goes out: the Payment Schedule sheet
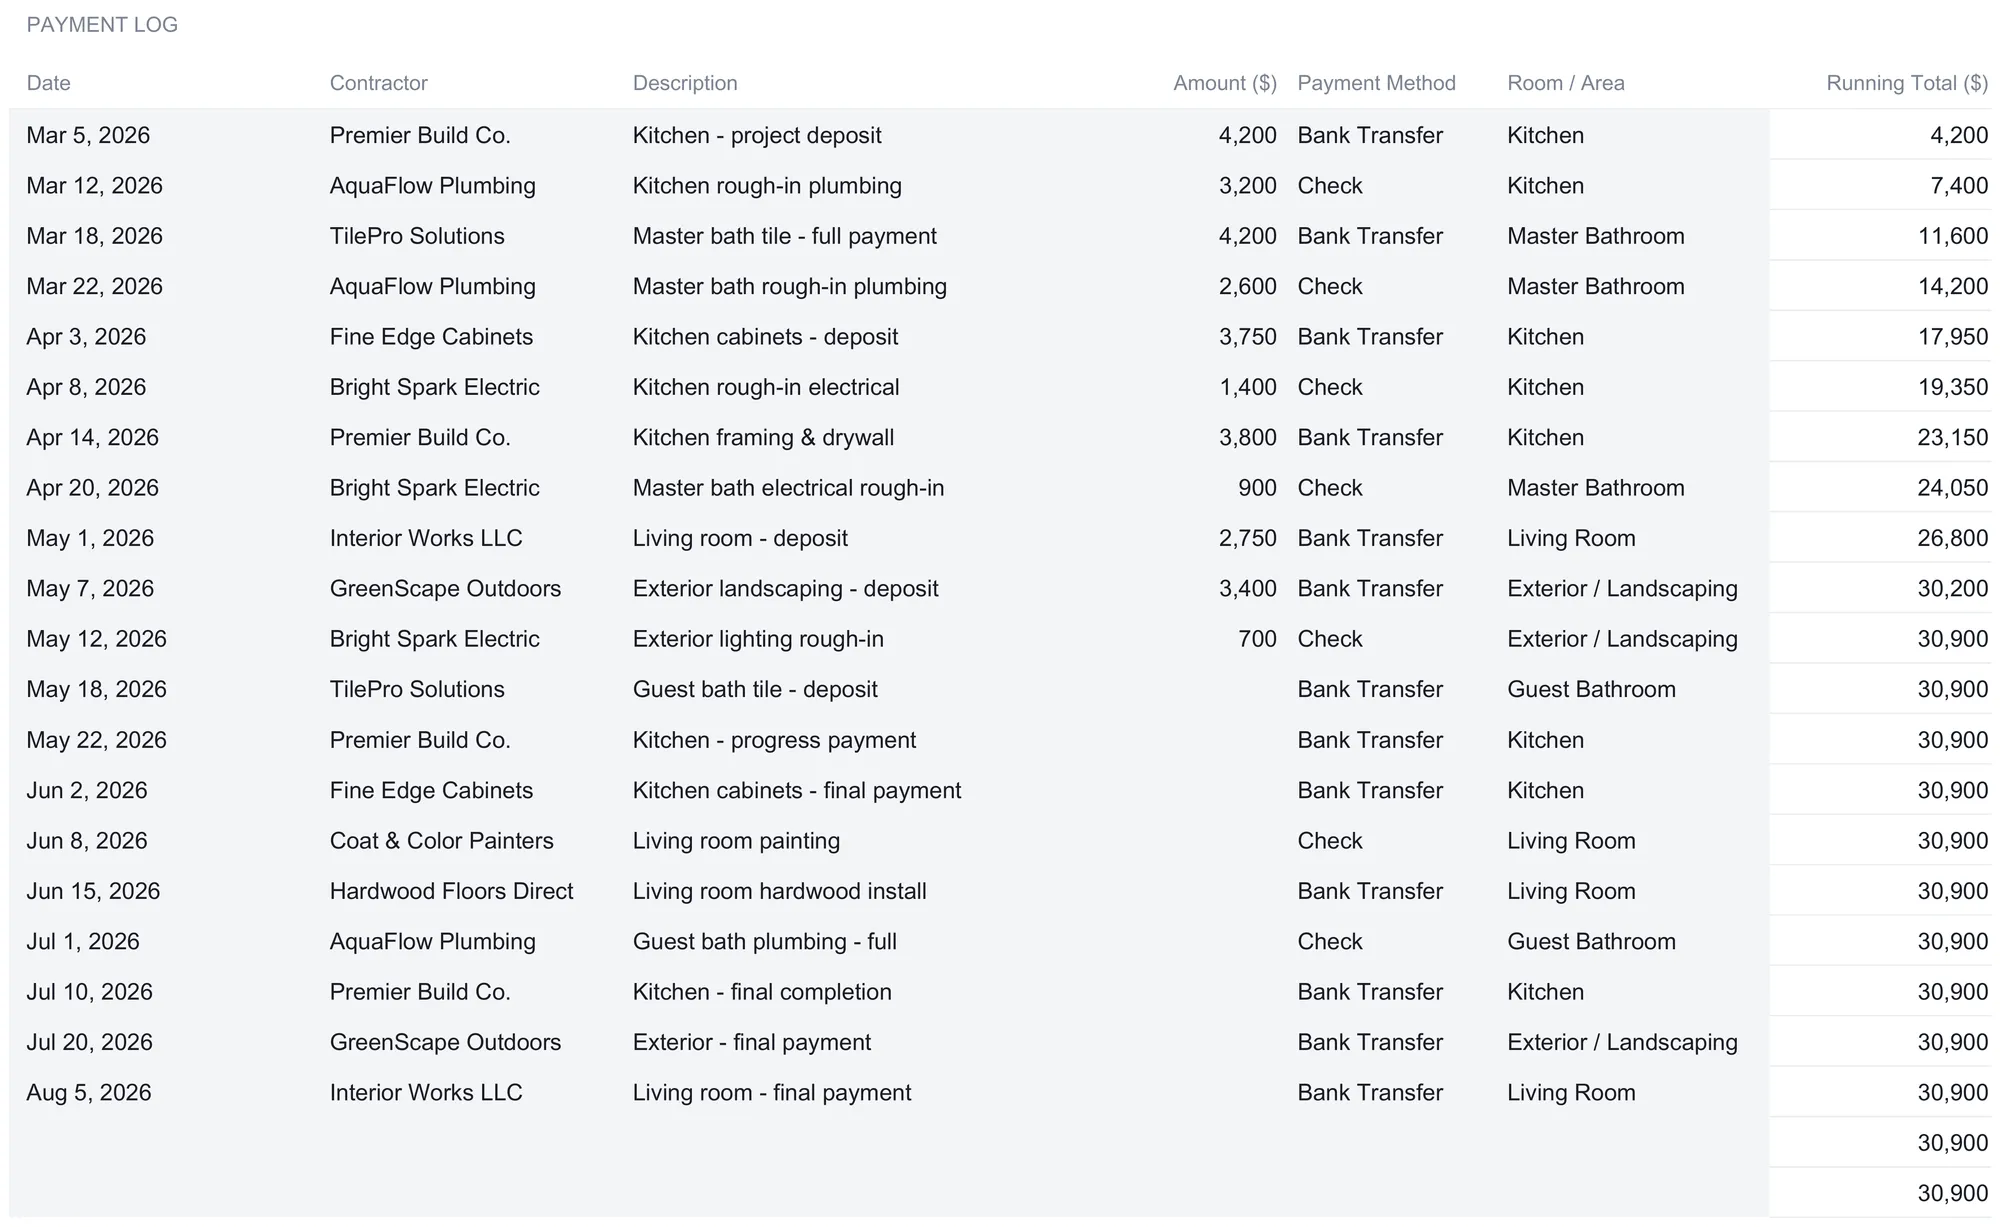
Budgets and quotes describe intent. The Payment Schedule records what actually happened to the bank account. It logs up to 50 individual payments, and each row carries a date, the contractor, a description, the amount, the payment method, the room, and a running total that accumulates down the column. An entry in the ledger is six typed cells, two of them dropdowns, and the running total keeps itself.
The sample tells the story of the first months of the project. It opens with a kitchen deposit to Premier Build Co. on March 5, and the running total climbs payment by payment, past the plumber’s rough-in, the tile setter’s payment on the master bath, the cabinet deposit, and on through spring. Eleven payments carry amounts, and they lift the running total to $30,900 by mid-May. The rows below them show something a plainer log would hide: a description and a date but no amount, the payments that are scheduled but have not gone out yet. Because the running total only moves when an amount is present, it holds flat at $30,900 across those pending rows, and the Total Paid at the bottom reads the same $30,900, matching the contractor Paid To Date to the dollar.
At the foot of the sheet a Monthly Spending Trend block groups the payments into a twelve-month window that starts from the earliest one logged. March took $14,200 across four payments, an average of $3,550 each; April took $9,850 across four, averaging $2,463; May took $6,850 across three, averaging $2,283. A final row labeled for anything dated outside those twelve months catches stray dates so the block always adds back to the Total Paid rather than quietly dropping a payment. That monthly shape is what turns a flat list of disbursements into a cash-flow picture, the thing a renovation needs when deposits and progress payments cluster unevenly through a build.
Read the variance and the milestones: the Budget vs Actual sheet
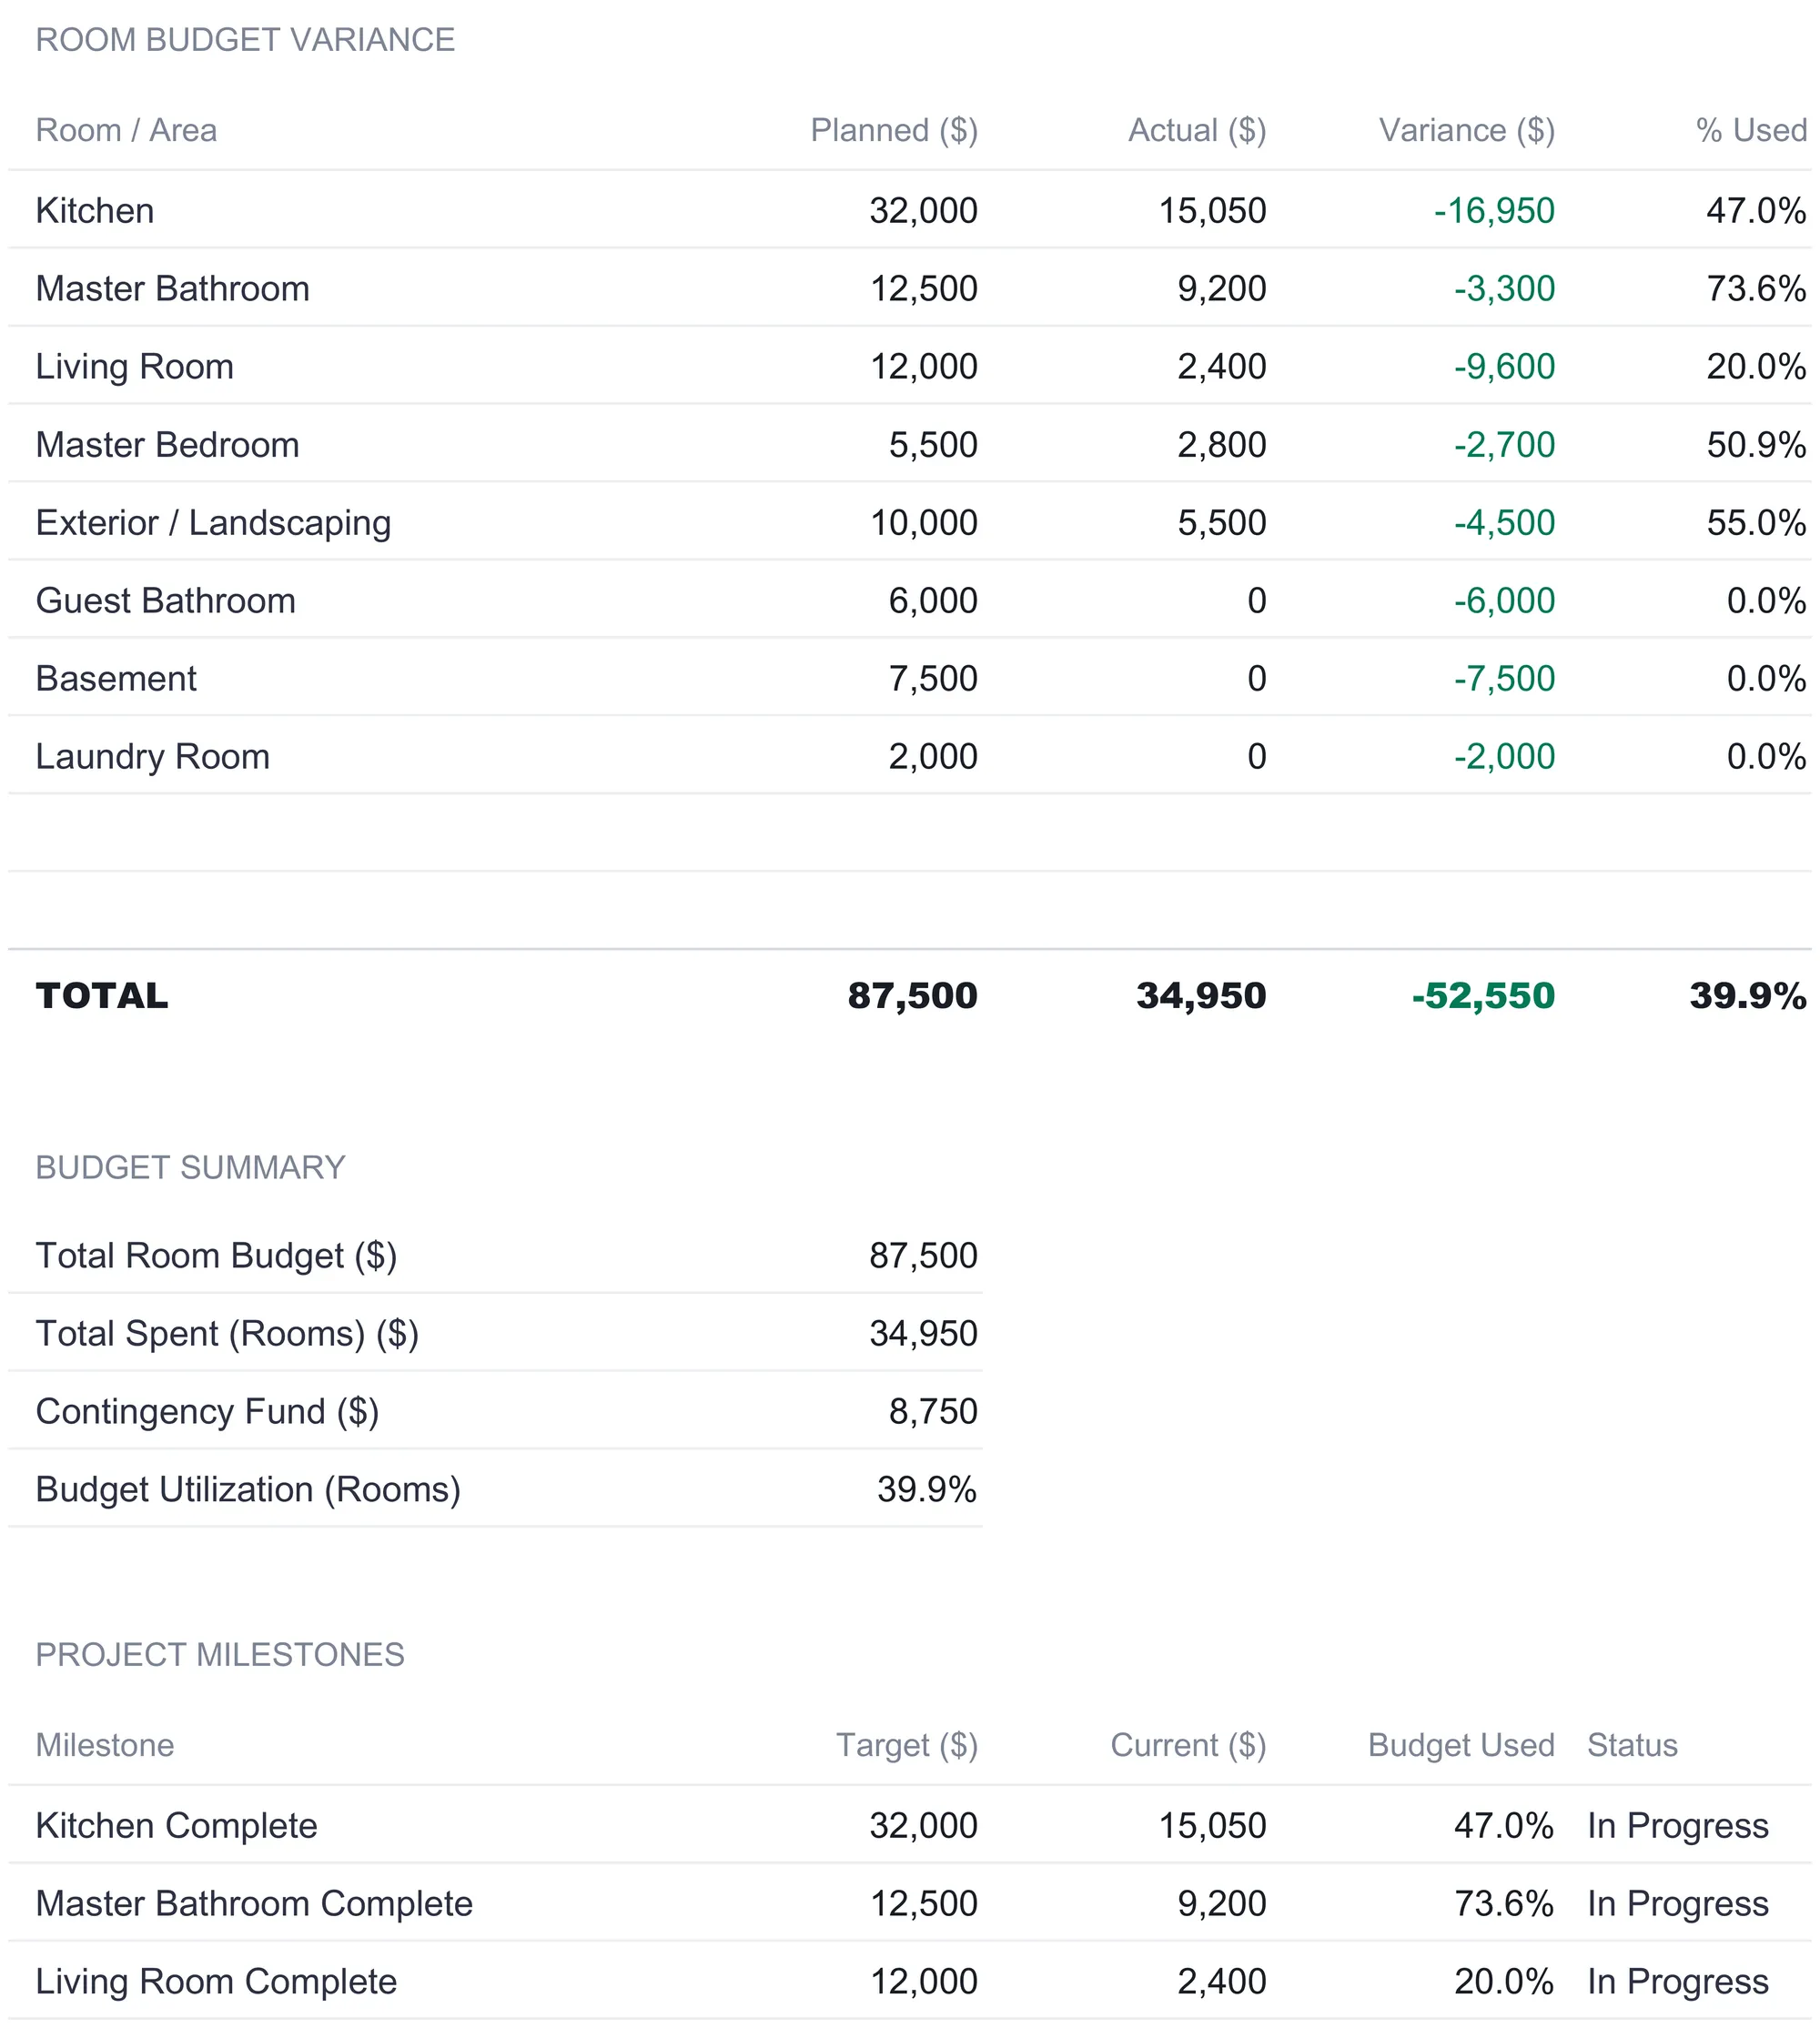
The Budget vs Actual sheet lifts the file up from the individual line and reports the whole job two ways. The first is a room-by-room variance table that mirrors Project Overview, laying each room’s planned budget against its actual spend, the variance between them, and the percentage used. Variance here reads as Actual minus Planned, so an underrun shows negative and green, and the totals line up: $87,500 planned against $34,950 actual, a variance of -$52,550, and 39.9 percent of the room budget used. Read down the percentage column and the state of the project is legible at a glance, the master bathroom furthest along at 73.6 percent, the exterior at 55.0 percent, and the three untouched rooms sitting at zero.
Below the variance table, a Budget Summary reports four lines, the total room budget, the total spent on rooms, the contingency fund, and the room budget utilization, so the room totals sit beside the reserve the variance table leaves out. The Milestone tracker underneath reframes each room as a target. Every room becomes its own “Complete” milestone, such as “Kitchen Complete,” with the room budget as its target, the room spend as its current figure, a budget-used percentage, and the status carried over from Project Overview. The kitchen milestone reads $15,050 of $32,000, 47.0 percent, In Progress, the same numbers the overview shows, now framed as progress toward finishing rather than money spent.
The last milestone is the one that ties the money views together. “All Contractor Payments Made” sets its target at the $60,000 of total contractor quotes and its current figure at the $30,900 paid so far, which works out to 51.5 percent and a status of In Progress. It is the cash-completion counterpart to the room-completion lines above it, and reading it next to the 39.9 percent of room budget used is a quiet reminder that the money owed to contractors and the money spent against room budgets move on their own schedules.
The dashboard: six numbers and two charts
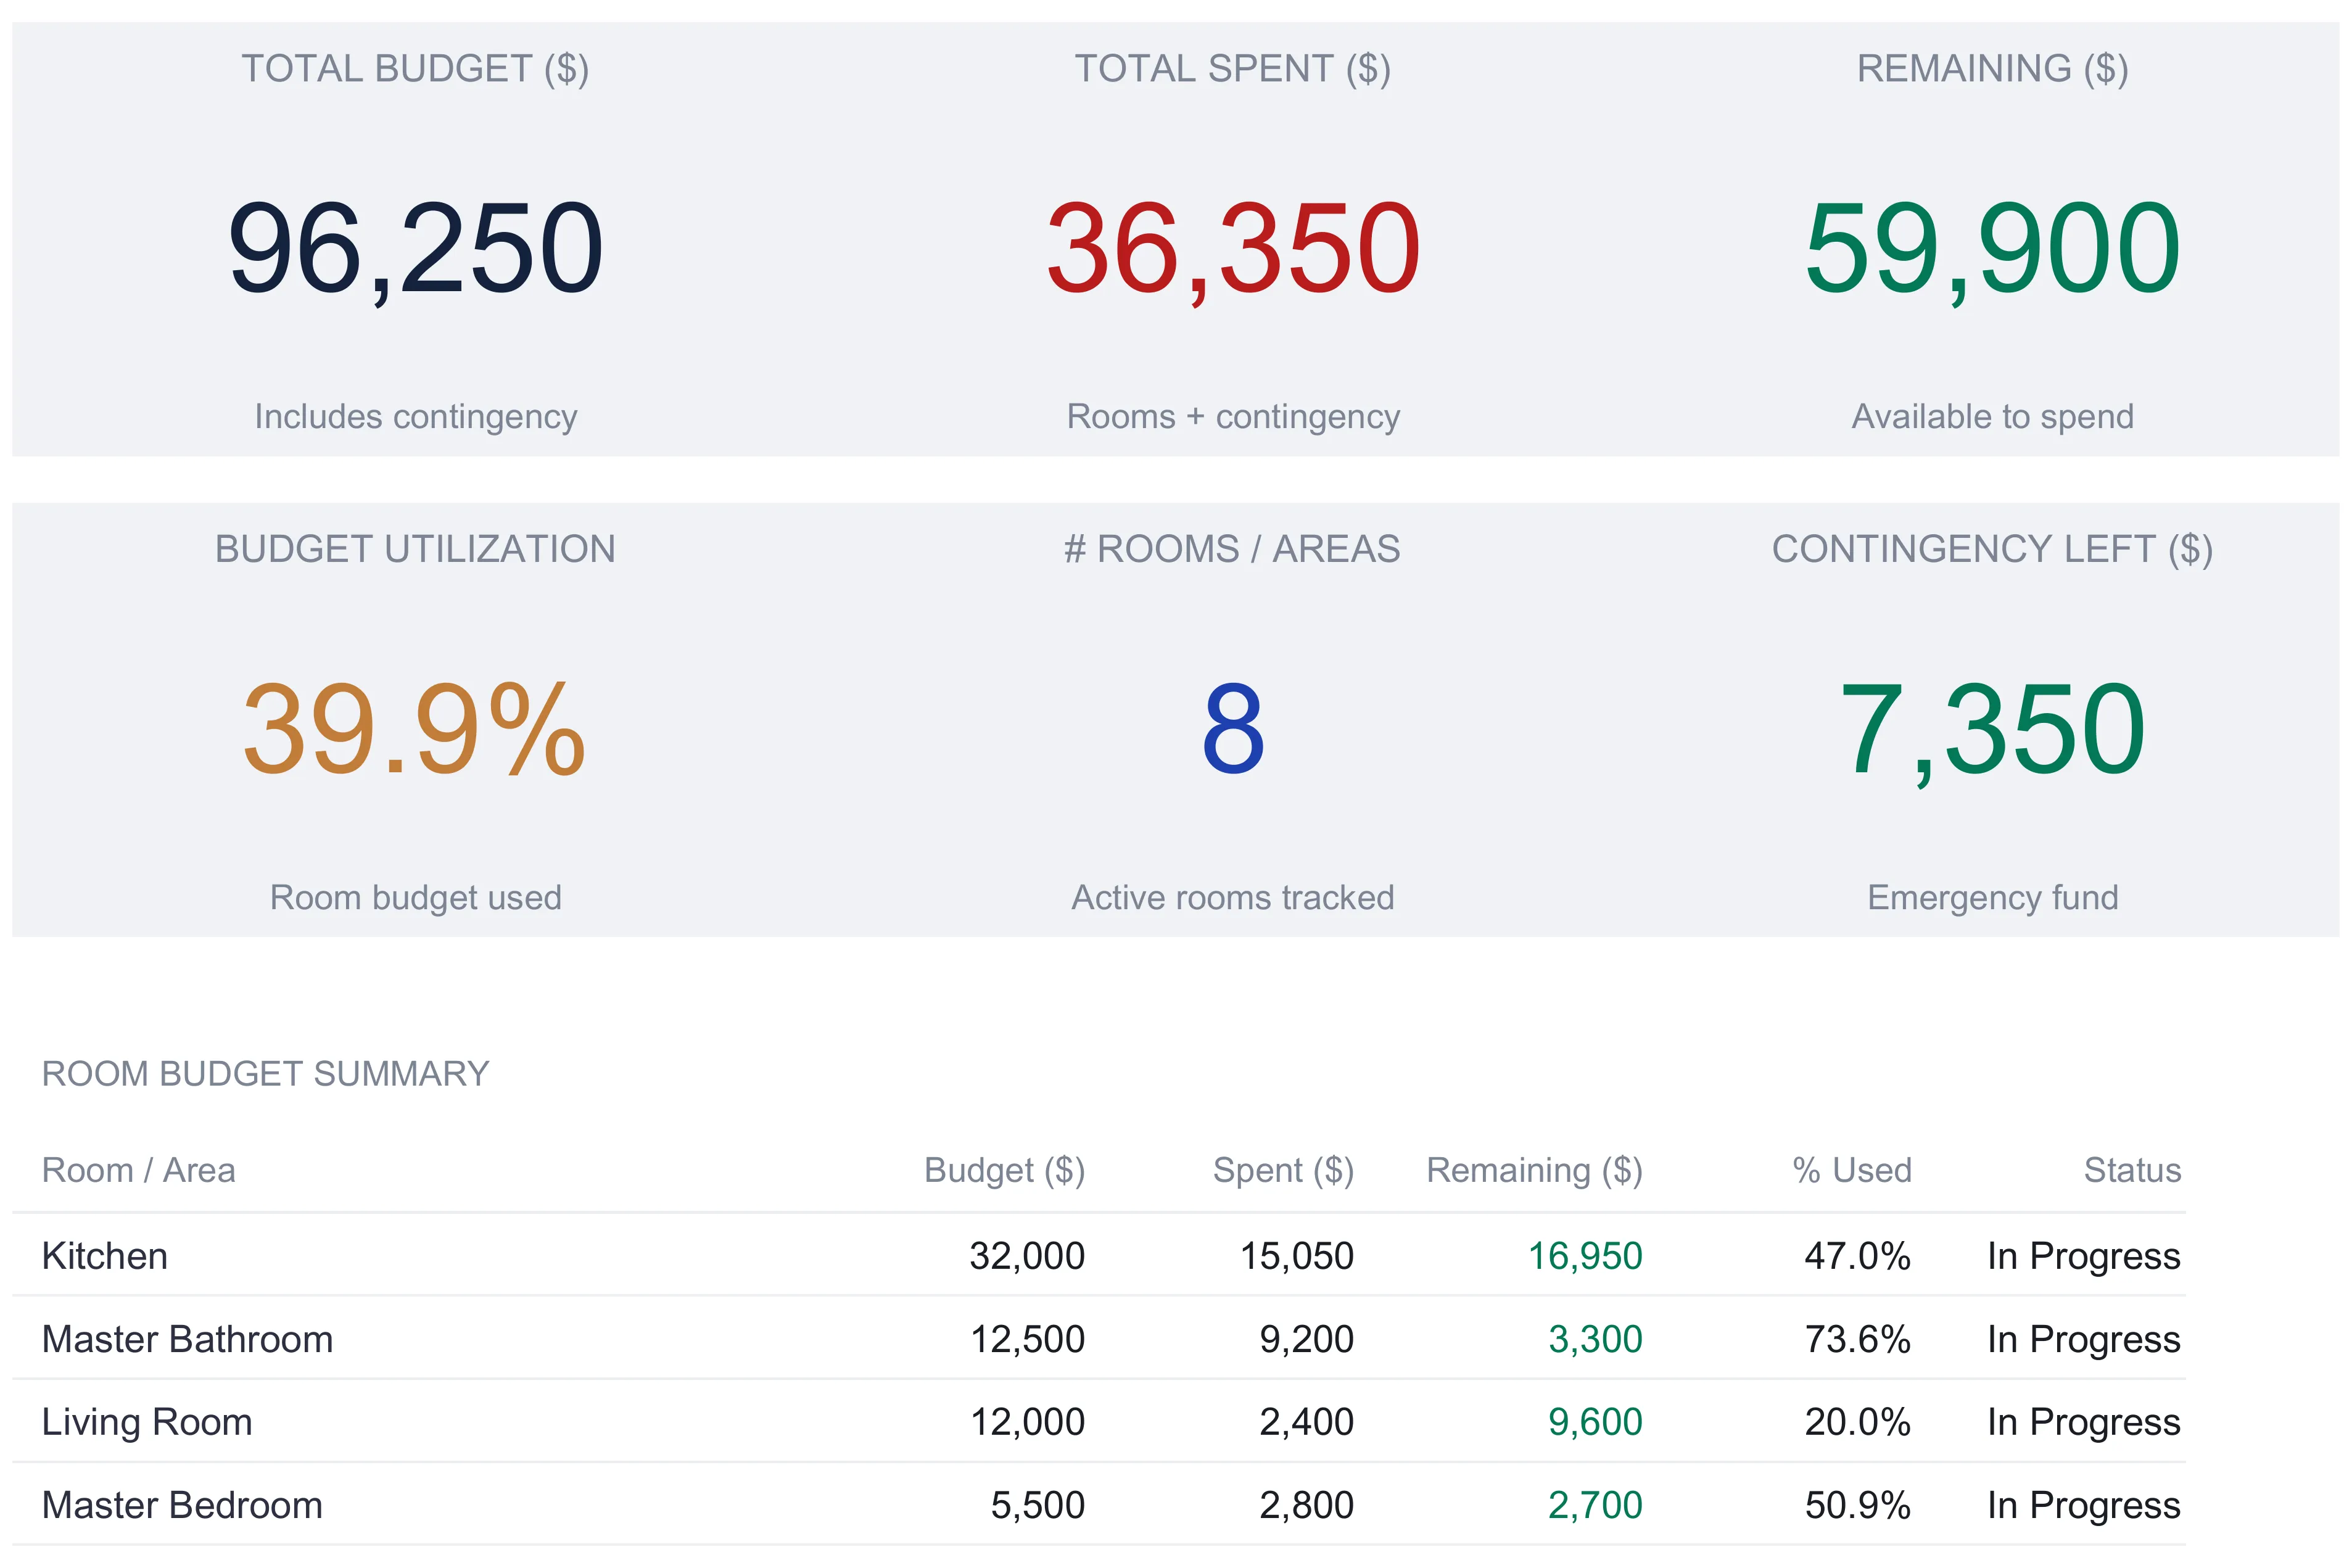
With the rooms budgeted, the contractors logged, and the payments recorded, the Dashboard reads it all back. Six KPI tiles sit across the top, each pulling live from the sheets below it.
| Tile | Sample value | What it reads |
|---|---|---|
| Total Budget | $96,250 | Room budgets plus the contingency fund |
| Total Spent | $36,350 | Room costs plus contingency drawn to date |
| Remaining | $59,900 | Total budget minus total spent |
| Budget Utilization | 39.9% | Room spend divided by room budget |
| # Rooms / Areas | 8 | Active rooms named on the overview |
| Contingency Left | $7,350 | The reserve minus what has been drawn |
Two of these repay a second look. Total Budget and Total Spent both fold the contingency in, so $96,250 and $36,350 are the fully-loaded figures including the reserve, while Budget Utilization deliberately leaves the contingency out, dividing the $34,950 of room spend by the $87,500 of room budget to land at 39.9 percent. Reading the two together separates how much of the plan has been executed from how much of the whole envelope, buffer and all, has been committed. Contingency Left, at $7,350, is the one tile that watches the reserve on its own, so a draw against it shows up here the instant it is entered rather than hiding inside a combined total.
Below the tiles, a Room Budget Summary table repeats each room’s budget, spent, remaining, percentage used, and status, and two charts turn the numbers into a picture: a Budget vs Actual by Room chart that stands each room’s planned bar next to its actual, and a Spend by Room chart that shows where the $34,950 of actual cost has landed so far. Renaming a room in its own row on Project Overview relabels its bar and its summary line, since each chart category and summary row reads that room’s cell on the overview.
The two “spent” numbers, and why they differ
The one thing worth slowing down on in this workbook is that it reports two different amounts spent, and both are correct. Total Spent on the dashboard is $36,350. The Payment Schedule Total Paid, and the contractor Paid To Date, are both $30,900. They are not a discrepancy to reconcile; they measure two stages of the same money.
The $36,350 is cost incurred: the actual costs entered against each room’s line items, $34,950, plus the $1,400 drawn from contingency. A cost lands here when the work is done and its price is known, whether or not the check has cleared. The $30,900 is cash disbursed: the sum of payments actually logged as leaving the account. The two drift apart because renovations pay on their own rhythm. A deposit goes out before the work exists, so cash can lead cost; a completed line can sit unpaid on net terms, so cost can lead cash. Watching both is how a project sees the difference between what it has committed to and what it has actually parted with, which is exactly the distinction a single running total blurs.
Excel or Google Sheets for a renovation budget
The template is an .xlsx file built on standard formulas, with no macros and no add-ons, so it behaves the same in Microsoft Excel and in Google Sheets after upload, and the How to Use sheet notes it works in LibreOffice Calc as well. Google Sheets suits a household where two people want to open the same live budget from different phones as quotes come in and payments go out; Excel suits one that prefers a local file it controls. The structure described here, a room budget feeding a detail sheet, a contractor tracker, a payment log, and a budget-versus-actual view that all reconcile on the dashboard, is equally buildable in either, and nothing in this walkthrough depends on a feature only one of them has. A currency selector on the dashboard relabels every money column and KPI label across the workbook, changing the symbol shown without converting the underlying numbers.
Which template fits the job
- Home Renovation Budget Ultimate Spreadsheet Template ($29) is the workbook this walkthrough follows: the ten-room Project Overview, the 100-line Room Budgets detail sheet, the 30-contractor tracker, the 50-payment log with its monthly trend, the budget-versus-actual and milestone views, and the six-KPI dashboard, ready to run a multi-room project. The tier family starts smaller, with a free Home Renovation Budget template for a single-sheet start and a Home Renovation Budget Essentials ($19) that gives each project its own row with contractor, materials, and permits split out. The Ultimate version is the one that carries the contractor tracker, the payment schedule, and the milestone tracker.
- Home Renovation Budget Essentials ($19) is the middle step in that family. Its Projects sheet gives each job a row that splits the budget into contractor, materials, and permits, then sets that total against one Actual Spent figure and a variance, without the separate contractor and payment ledgers. It fits a smaller project where a single budget line per job is enough and the cash side does not need its own sheet.
Related
- Home Renovation Budget Spreadsheet (Contingency + Phase Costs) - the concepts behind the numbers, why renovations overrun, and how big a contingency to carry
- Homeowners Budget Template for Utilities and Maintenance - the ongoing side of owning a home once the renovation is done
- How to Track Home Expenses in a Spreadsheet - logging what the finished home costs to run each month, with a repair reserve that projects ahead
Frequently asked questions
How is this different from a single renovation budget list?
A single list mixes every cost into one column and reports one running total. This workbook splits the job into four views that reconcile with each other: a room-by-room budget on Project Overview, a 100-line detail sheet on Room Budgets, a contractor tracker that carries quotes and payments, and a payment log that records cash as it goes out. It also keeps the contingency fund on its own line rather than folding it into the estimates, so the headline budget and the emergency reserve read as two separate numbers.
Why do the sheets show two different amounts spent?
They measure two different things, and the workbook keeps them apart on purpose. Total Spent on the dashboard is $36,350, the actual costs entered against each room's line items plus the contingency drawn to date. The Payment Schedule Total Paid and the contractor Paid To Date are both $30,900, the cash that has actually left the account. A cost can be incurred before it is paid, or paid in a deposit before the work is finished, so the incurred figure and the cash figure rarely match until a project closes out.
How big is the contingency fund, and can I change it?
In the sample it is $8,750, which the How to Use sheet notes ships at 10 percent of the $87,500 of room budgets. It is a plain input cell on Project Overview, so it is yours to raise or lower. The workbook tracks it apart from the room budgets, with its own spent and remaining lines, which is what lets the dashboard report remaining budget and remaining contingency as two separate figures rather than one blended number.
How many rooms and contractors does it hold?
Project Overview takes up to 10 rooms, and Room Budgets gives each of those rooms 10 line items, for 100 detail lines in all. Contractor Tracker holds up to 30 contractors, and Payment Schedule logs up to 50 individual payments. The sample fills 8 rooms, 15 contractor rows, and a run of payments from March to August, with the spare rows already wired into every total so a new entry flows through without a formula to edit.
Does the template work in Excel and Google Sheets?
Both. It is an .xlsx file built on standard formulas with no macros, so it behaves the same in Microsoft Excel and in Google Sheets after upload, and the How to Use sheet notes it also opens in LibreOffice Calc. The status, payment method, and room dropdowns work in Excel and Google Sheets alike. It is a one-time purchase rather than a subscription.
About this article
Figures, column names, formulas, dropdowns, charts and screenshot captions checked on 2026-09-10 against the shipped Home Renovation Budget Ultimate workbook (Dashboard, Project Overview, Room Budgets, Contractor Tracker, Payment Schedule, Budget vs Actual, How to Use), with the free and Essentials workbooks checked for the tier comparison. Last reviewed September 2026.