A renovation budget that survives the actual project carries phased line items (structural, mechanical, finish, fixtures), a vendor-quote comparison, a change-order log, and a 15 to 20 percent contingency that shrinks visibly as surprises hit. Thinner than that and it becomes a wishlist. Here is how to build each piece.
Renovations go over budget. Not occasionally - reliably. The 2025 Houzz & Home study found that 37 percent of renovating homeowners spent more than planned, and the rate climbs to 56 percent on high-end projects. Even on smaller projects, 31 percent overshoot - high enough that a flat budget without a buffer is mostly a fantasy.
The spreadsheet’s job is not to predict every cost. It is to make the inevitable surprises visible early, so the trade-off conversations happen at week three instead of week ten. Our Home Renovation Budget template covers the core of that, splitting each project into contractor, materials and permit costs with actual spend and variance alongside. The other structures in this piece, phase grouping, vendor-quote comparison and a change-order log, work in any blank sheet, and the sections below walk through each one.
Why renovation budgets blow up
Three structural reasons.
You cannot see what’s behind the walls. Older homes hide outdated wiring, galvanized pipes, sagging joists, asbestos around heating runs, and previous-owner shortcuts. None of it is visible until demo starts. The 2024 NAHB analysis of US housing stock put the median home age at 43 years, up from 30 in 2000. Older stock, more discoveries.
Scope grows as you decide. “While we have the walls open” turns a $20,000 bathroom into a $30,000 bathroom plus rewired bedroom. Houzz cited “increased project complexity” and “more expensive product choices” as two of the top reasons projects exceed plan.
Quotes are anchors, not ceilings. A contractor’s bid is based on what they can see during the walkthrough. Once work begins, change orders accumulate. Each one feels small. Together they often add 10 to 25 percent.
A budget spreadsheet does not stop these forces. It records them as they happen so you stay ahead of the running total.
The phase model
Renovations break naturally into four phases, and the spreadsheet should mirror them. Costs concentrate differently in each.
| Phase | What it covers | Typical share of budget |
|---|---|---|
| Structural | Demo, framing changes, joists, sub-floor, drywall | 20 to 30 percent |
| Mechanical | Electrical, plumbing, HVAC rough-in, permits | 20 to 30 percent |
| Finish | Flooring, cabinets, tile, paint, trim | 25 to 35 percent |
| Fixtures | Appliances, lighting, faucets, hardware | 10 to 20 percent |
This matters for the spreadsheet on two fronts. Each phase pulls from different vendors (demo crew, electrician, plumber, tile setter, finish carpenter, cabinet installer), and tracking by phase keeps invoices grouped. Payment timing also diverges: structural and mechanical typically front-load; fixtures arrive last and surface late expenses (forgot the hood vent, undercabinet lighting was extra).
The phase column lets you filter and group. A pivot table is overkill; SUMIF by phase is enough.
What the spreadsheet needs
Five tabs cover the project. Less, and pieces fall through. More, and you stop updating.
1. Line Items. One row per task or material purchase. Columns: phase, room, item description, vendor, estimated cost, quoted cost, actual cost, paid to date, status, notes.
2. Vendor Quotes. Side-by-side comparison for any line where you are gathering competitive bids. Same scope across columns, totals at the bottom, a chosen-vendor flag. The main Line Items tab pulls from the chosen quote.
3. Change Orders. Each change is a row: date, description, vendor, cost or credit, paid status, contingency drawdown.
4. Payment Schedule. A timeline of deposits, progress payments, and final payments. Most contractors take a deposit at signing (10 to 30 percent), draws at milestones, and a holdback at completion. The schedule lets you forecast cash flow.
5. Dashboard. Total budget, total spent, remaining, contingency used, percent complete, days elapsed vs days planned. A handful of cells, formula-driven, no manual updates.
Anything more is project management, which a renovation rarely needs in spreadsheet form.
The contingency calculation
The single most important line. Most overruns come from things nobody could predict at quote time, and the buffer is what absorbs them.
Common guidance ranges by scope and home age:
| Scope and home age | Contingency |
|---|---|
| Cosmetic refresh (paint, fixtures) on any house | 5 to 10 percent |
| Mid-scope (one room, finishes only) on a newer home | 10 to 15 percent |
| Mid-scope on a pre-1980 home | 15 to 20 percent |
| Whole-room with walls opening up (kitchen, bath) | 20 to 25 percent |
| Whole-house or pre-1940 home | 25 percent or more |
The age cutoffs are not arbitrary. Census housing data shows pre-1980 homes are roughly six times more likely to have basement leakage and nearly twice as likely to report roof issues than newer construction. Older mechanical and structural systems mean more discoveries during demo.
The contingency line lives in the dashboard. When a change order is approved, two cells update: the change order row gets the cost, and the contingency line shrinks by the same amount. Watching the contingency drop from 20 percent to 8 percent in week two of a six-week project is a useful early warning. Funding the buffer before work starts, the way a sinking fund sets money aside for a known-but-undated expense, keeps a surprise from becoming a scramble.
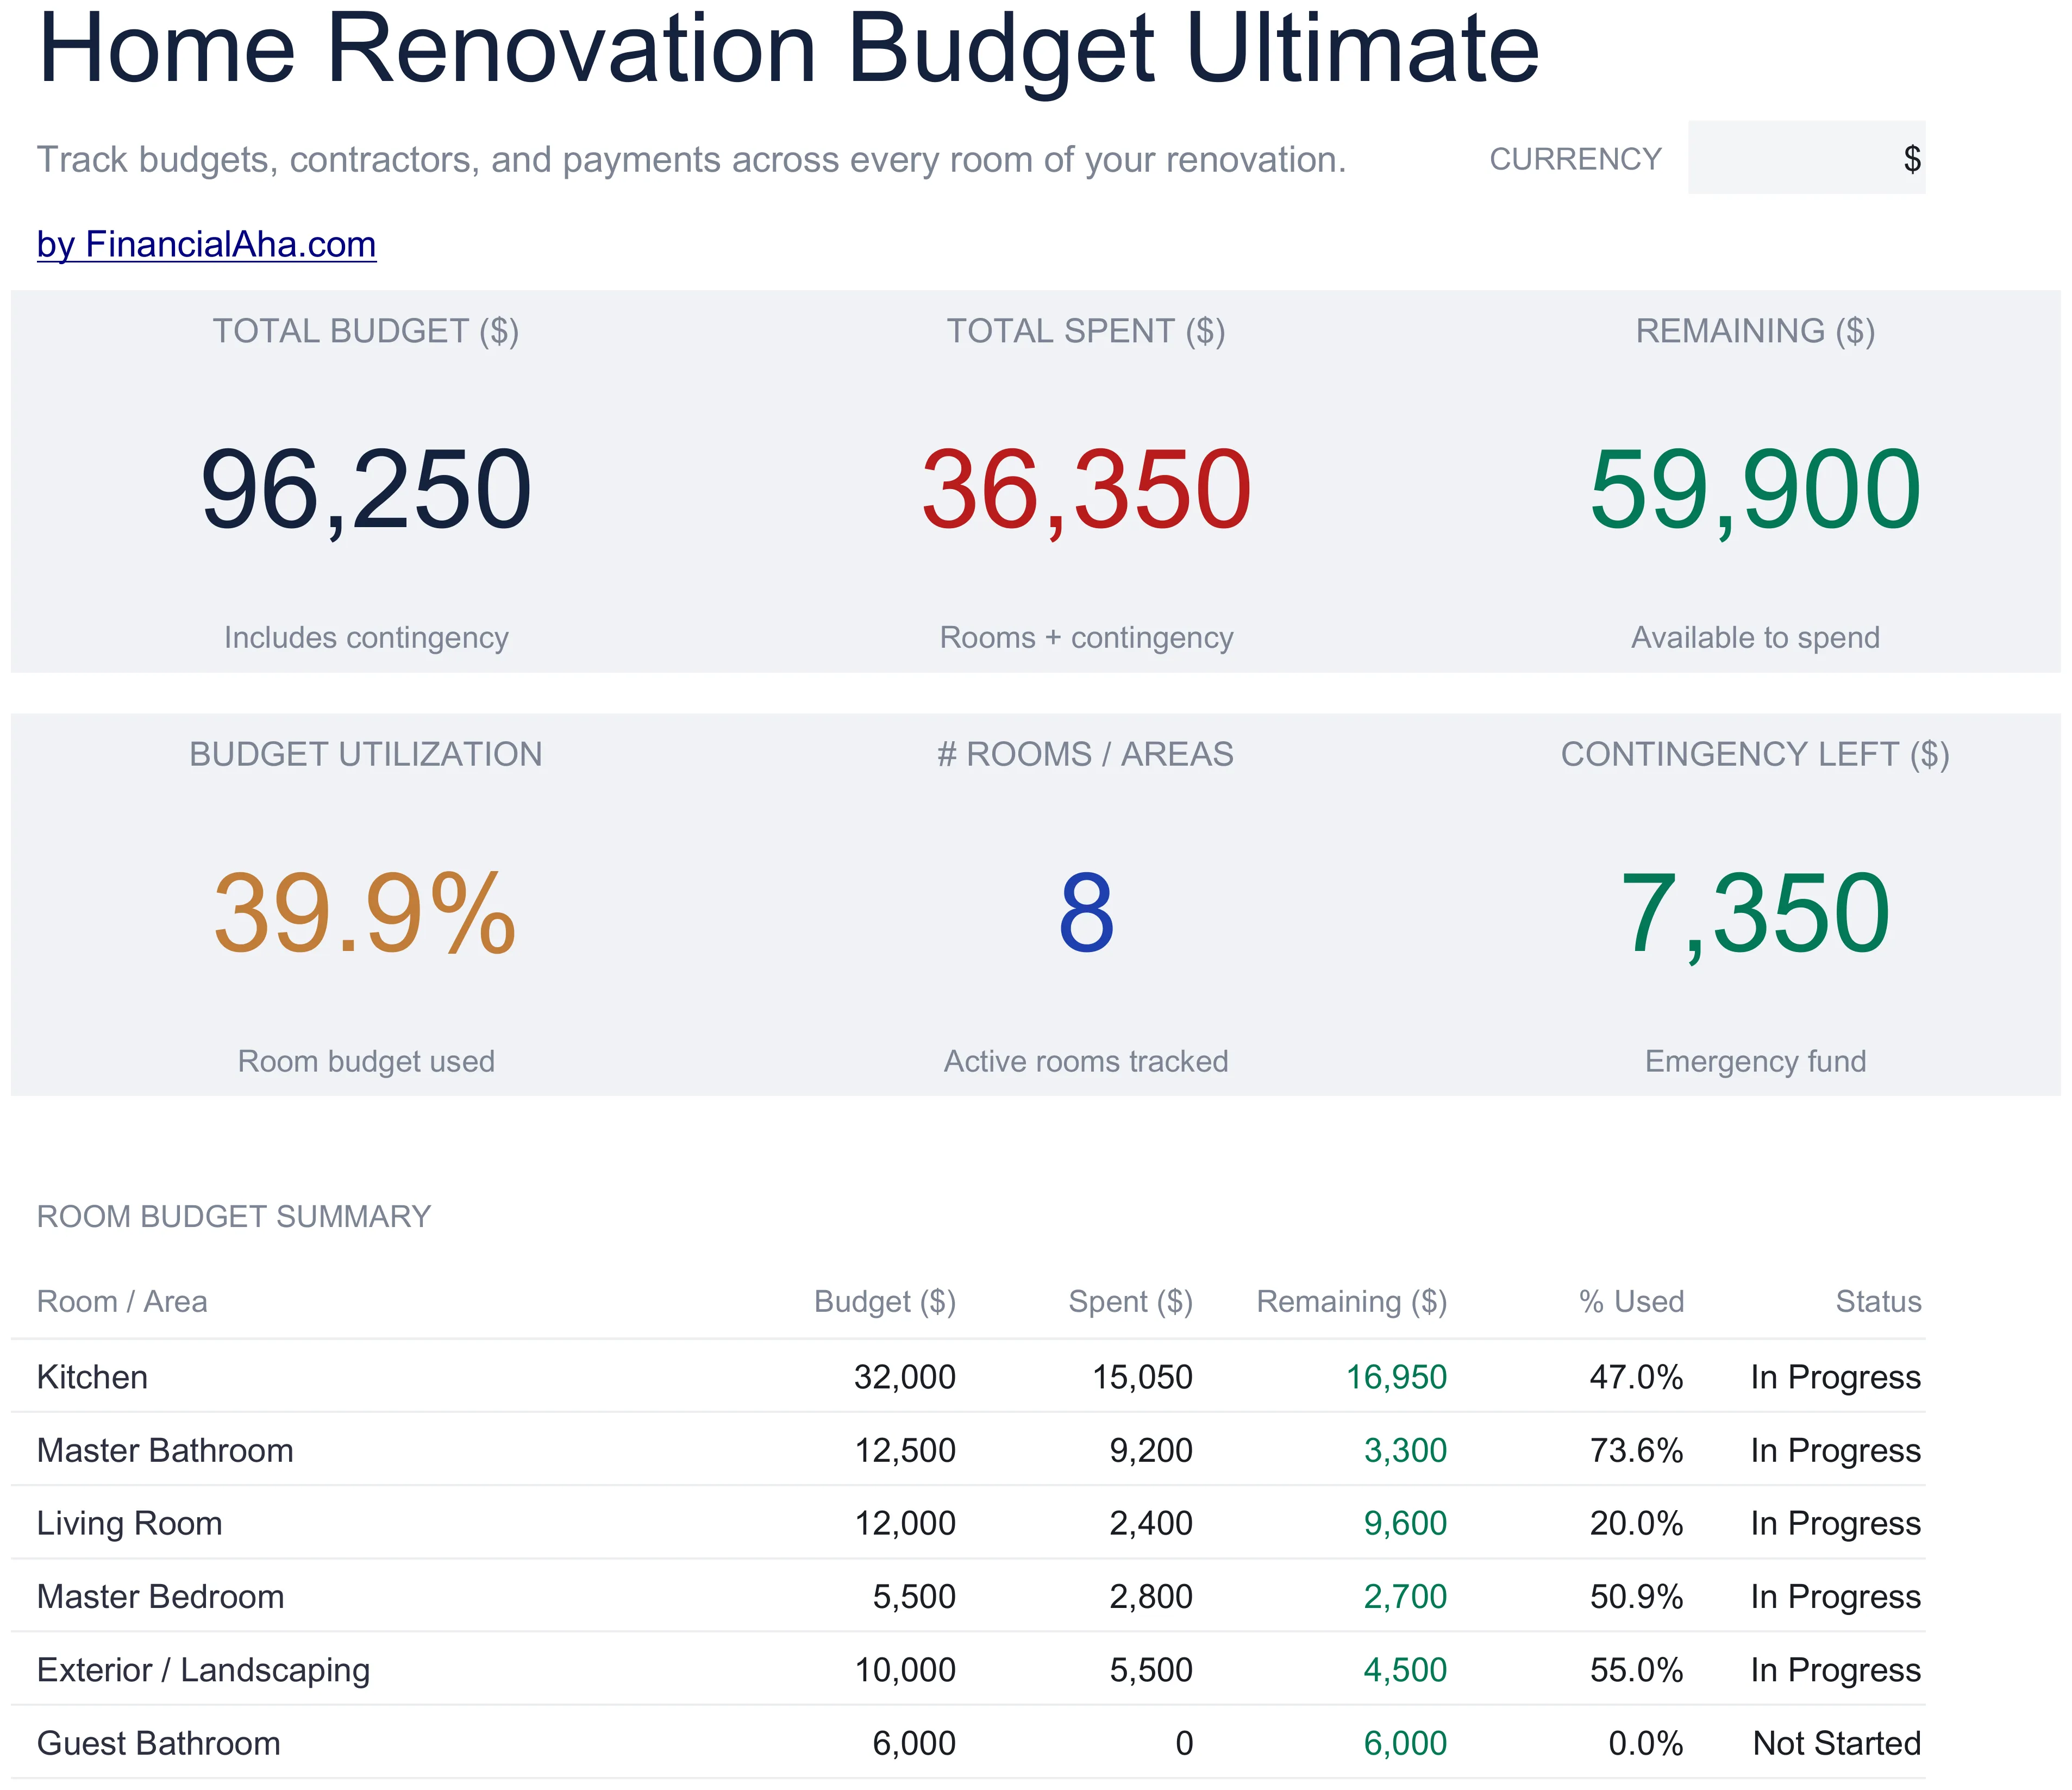
The Home Renovation Budget Ultimate (Ultimate tier) surfaces contingency left as its own KPI, alongside a room-by-room budget-vs-spend summary.
Vendor quote comparison
Most renovations involve three to six vendor relationships. A separate Vendor Quotes tab makes apples-to-apples comparison possible.
Structure:
| Line item | Vendor A | Vendor B | Vendor C | Chosen |
|---|---|---|---|---|
| Demo (kitchen) | 2,800 | 3,200 | 2,400 | A |
| Cabinet install | 4,500 | 4,100 | 5,200 | B |
| Tile (bath floor and walls) | 3,600 | 4,200 | 3,800 | A |
| Electrical (full kitchen rewire) | 5,800 | 5,200 | 5,600 | B |
| Total bid | 16,700 | 16,700 | 17,000 | - |
A few things surface fast. Totals can land within $300 even when individual line items diverge by 30 percent; the cheapest total is rarely the cheapest job. Mixing vendors (Vendor A for demo and tile, Vendor B for cabinets and electrical) often beats picking one for everything, though it adds scheduling complexity.
A note column for each vendor (responsiveness, references, license status, lead time) carries the non-price comparison. Cheapest quote with a six-week lead time when the kitchen has to be done in four does not work.
What gets forgotten
The categories that surface late and blow contingencies. Worth listing in the spreadsheet at planning time even if the cost is $0 initially.
- Permits and inspections. Mechanical, electrical, plumbing, and final building inspections each carry fees. Typical range $500 to $3,000 depending on jurisdiction and scope.
- Dumpster and disposal. $400 to $800 per dumpster, often multiple needed.
- Temporary living costs. If the kitchen is out for six weeks, restaurant meals or temporary kitchenette add real money.
- Storage. Pods or off-site storage if rooms have to be emptied. $200 to $400 per month.
- Material delivery fees and lift charges. Cabinets, appliances, and heavy items often have delivery fees not in the quote.
- Asbestos or lead testing. Required in many jurisdictions for pre-1980 homes before demo.
- Repaint and patch beyond the renovated rooms. Dust and damage extend further than expected. Touch-up paint and patching add labor.
- Tool and equipment rentals. If you are DIY-ing parts of the project.
- Sales tax on materials. Often not included in line-item quotes.
A pre-populated “easy to forget” section at the bottom of the Line Items tab prevents these from arriving as surprises. Many of them are the same lumpy, unevenly-timed costs that make budgeting for irregular expenses hard in the first place, so naming them up front is half the battle.
Tracking change orders honestly
Every project gets change orders. The spreadsheet treats them as a first-class item, not a footnote. Each row: date, description, who requested it (homeowner, contractor, inspector), vendor, cost or credit, contingency impact, paid status.
A worked example. Mid-renovation, the electrician finds the existing service panel cannot handle the new kitchen load. The fix is a panel upgrade at $2,400.
| Date | Description | Requested by | Vendor | Amount | Contingency before | After |
|---|---|---|---|---|---|---|
| 2026-08-12 | Service panel upgrade | Electrician (required by code) | Vendor B | 2,400 | 9,000 | 6,600 |
The contingency before/after columns make the buffer visible. Three more $1,500 surprises and the buffer is gone. That is information that changes choices: maybe the high-end faucet becomes a mid-range faucet to preserve buffer.
Tracking actuals as the project progresses
A cadence many people find workable: update the spreadsheet weekly during active work, often at the end of the week when invoices have settled.
For each line item, three numbers move:
- Actual cost when an invoice lands.
- Paid to date when checks clear or transfers process.
- Status (not started, in progress, complete, awaiting invoice).
The dashboard recalculates each time. Watching percent complete against percent of budget spent is the early warning. If you are 40 percent through the schedule but 70 percent through the budget, the contingency conversation is overdue.
For homeowners running the project alongside a small business or self-employment income, the Cash Flow Forecast handles the income side; the renovation budget handles the project side.
The final reconciliation
When the work wraps, a “Final Reconciliation” section on the dashboard pulls together:
- Original budget vs final actual (in dollars and percent).
- Contingency used (in dollars and as a percent of budget).
- Largest single overrun line (useful learning).
- Items completed under estimate (rare but worth noting).
- Outstanding punch list items with rough cost.
- Lessons captured for next project.
The last row matters most. The point is not blame; it is recall. Two years from now when planning the next renovation, the lessons-learned cell (“Underestimated electrical by $4K; tile labor came in 20 percent over; should have demanded firm pricing on cabinets before signing”) is what makes the next budget more honest.
When the budget tab is not enough
A renovation budget spreadsheet handles costs, vendors, payments, and change orders. It does not handle dependencies (cabinets cannot install before flooring), crew schedules across days, or material lead-time tracking beyond a date column.
If the project is large enough to need true scheduling (whole-house, multiple trades on site simultaneously), a separate project management tool is worth the overhead. Most single-room and single-phase renovations stay better in a budget-focused spreadsheet. Mixing both into one file usually breaks both.
Templates that fit
Two renovation-focused options, scaled by project size.
- Home Renovation Budget ($19) - Eight project rows, each with its budget split into contractor, materials, and permit costs, then actual spend and variance beside it. The dashboard rolls up total budget, total actual, variance, percent used, and the largest project, with budget-vs-actual and spending-breakdown charts.
- Home Renovation Budget Ultimate ($29) - Up to 10 rooms with 10 line items each, a contractor tracker, a payment log with a running total, and a contingency fund reported apart from the room budgets. The dashboard carries 6 KPIs, and a milestone tracker sits on the Budget vs Actual sheet. For multi-room or whole-house projects.
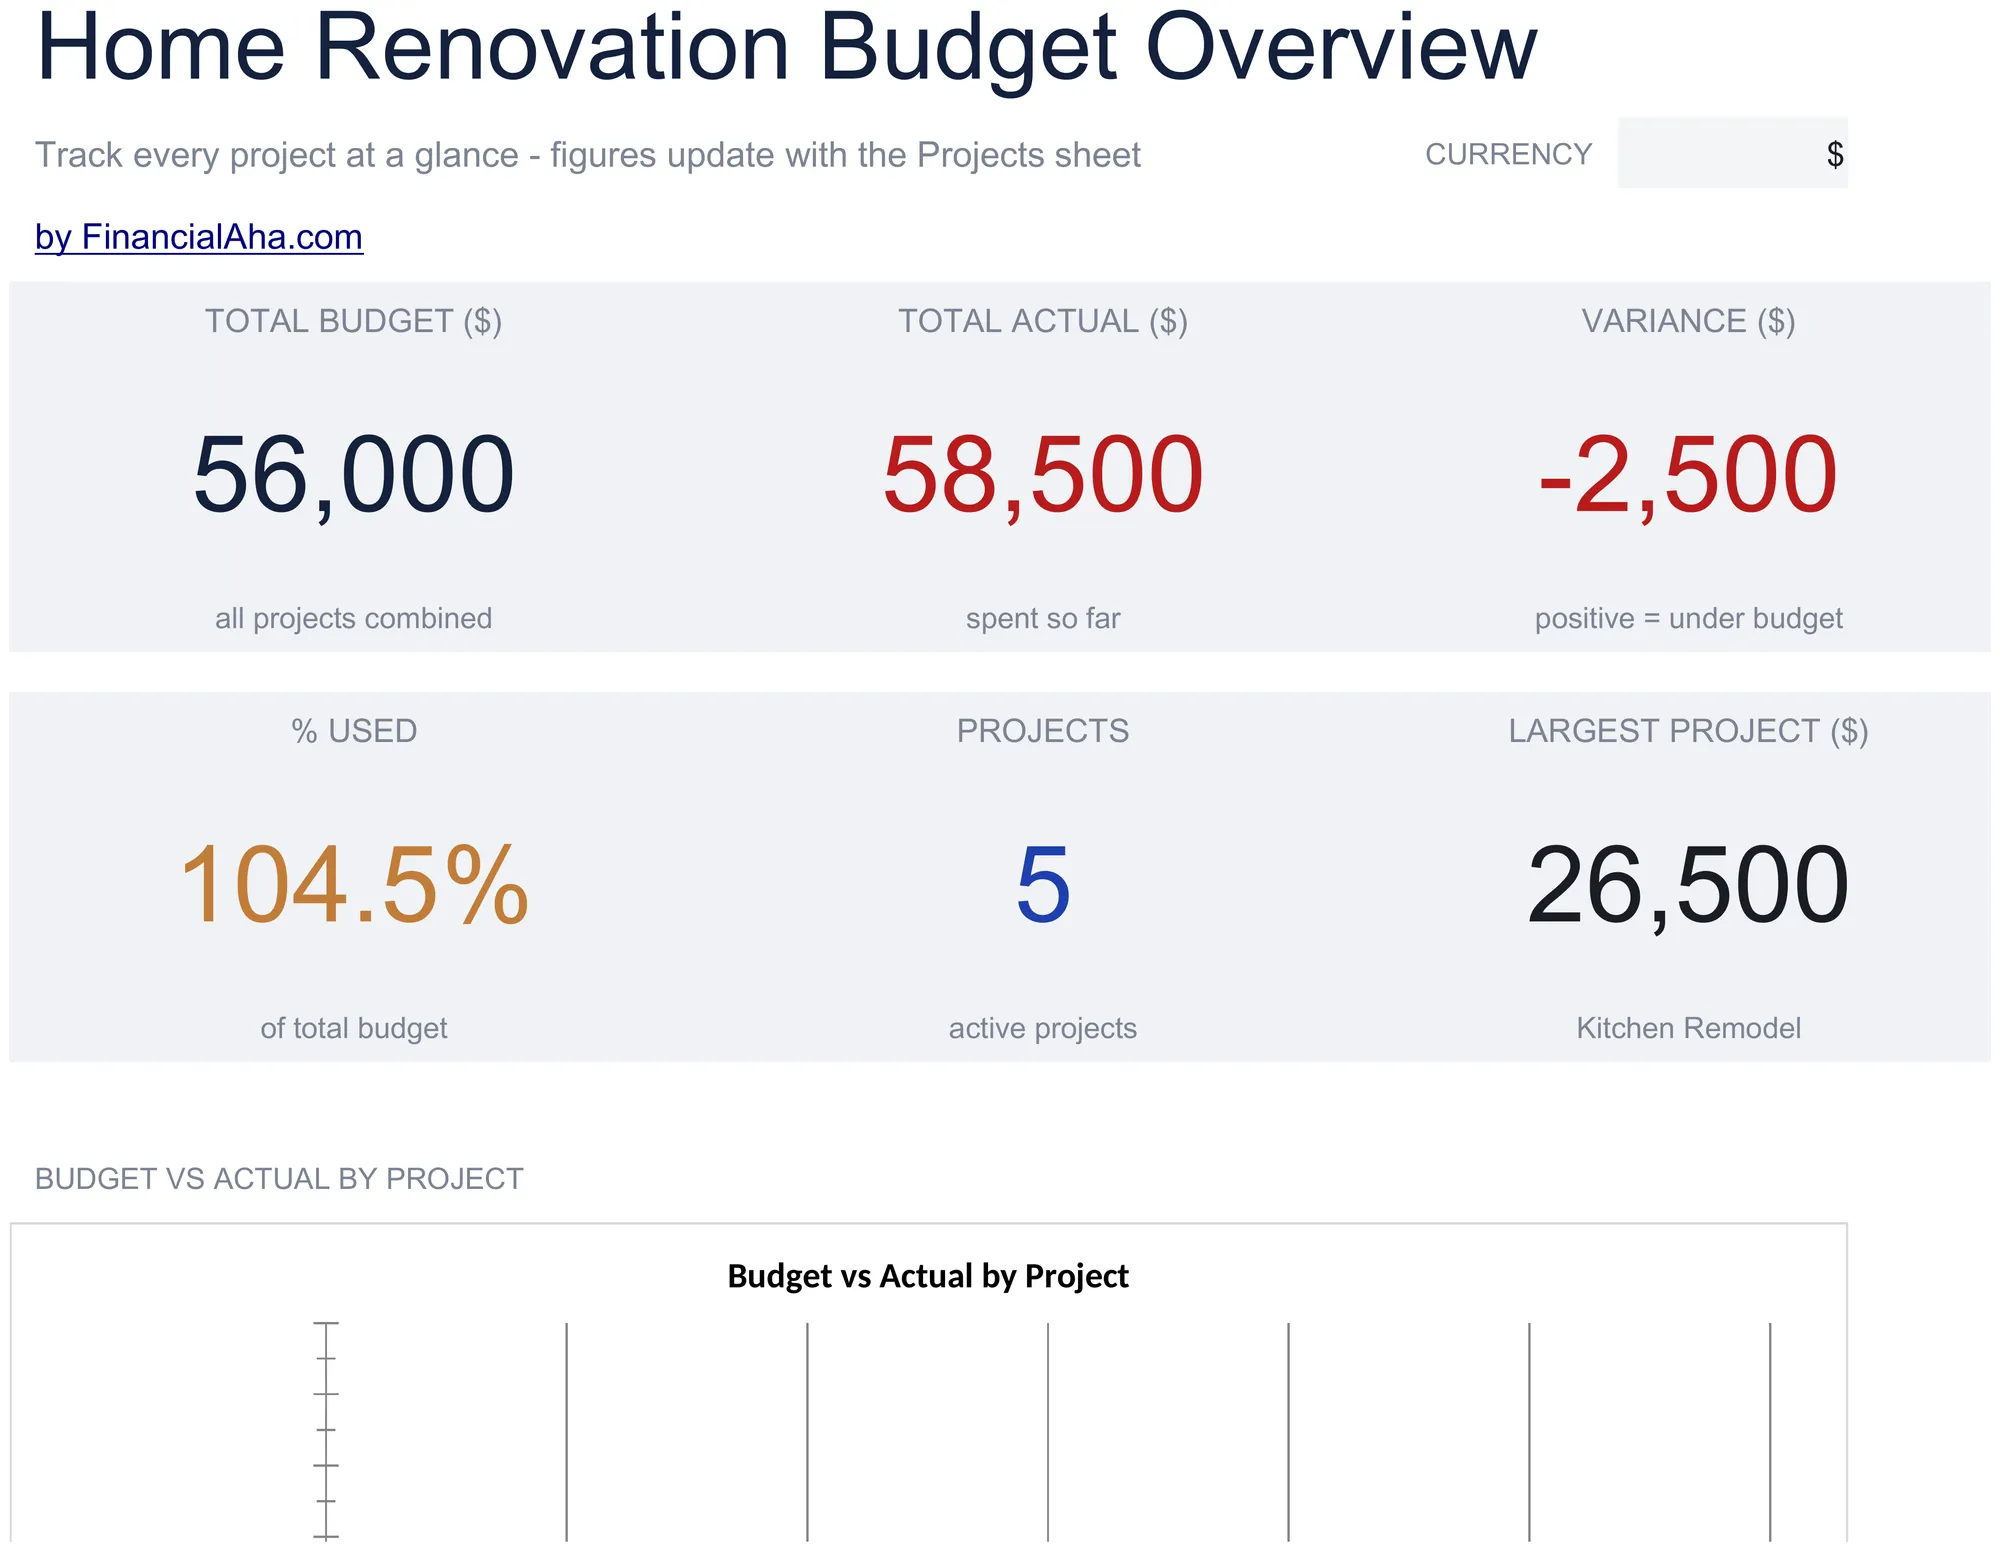
The Home Renovation Budget Essentials (Essentials tier) rolls up budget, actual, and variance across every project on one dashboard.
Related
Frequently asked questions
How big should the contingency be?
Common rules of thumb: 10 to 15 percent for new construction or recent rehab, 15 to 25 percent for older homes (pre-1980), 25 percent or more if walls are opening up. The older the house, the more the contingency.
Should the contingency sit inside the total budget or on top of it?
It works either way, so long as the buffer is its own line rather than money hidden across the estimates. Keeping it separate is what lets the dashboard show remaining budget and remaining contingency as two different numbers, which is the early-warning view.
Should I track quotes in the same spreadsheet?
Yes. A separate Vendor Quotes tab keeps comparison clean - line items by vendor, with totals at the bottom and a chosen-vendor flag. The main budget tab pulls from the chosen quote.
Do the templates work in both Excel and Google Sheets?
Both the Essentials ($19) and Ultimate ($29) versions are built to open in Excel and Google Sheets, and the calculations update automatically once you enter your figures. It is a one-time purchase, not a subscription.
About this article
Template sheets, inputs, and outputs checked on 2026-09-10 against the shipped Home Renovation Budget Essentials workbook (Dashboard, Projects, How to Use) and the Home Renovation Budget Ultimate workbook (Dashboard, Project Overview, Room Budgets, Contractor Tracker, Payment Schedule, Budget vs Actual, How to Use). Last reviewed September 2026.