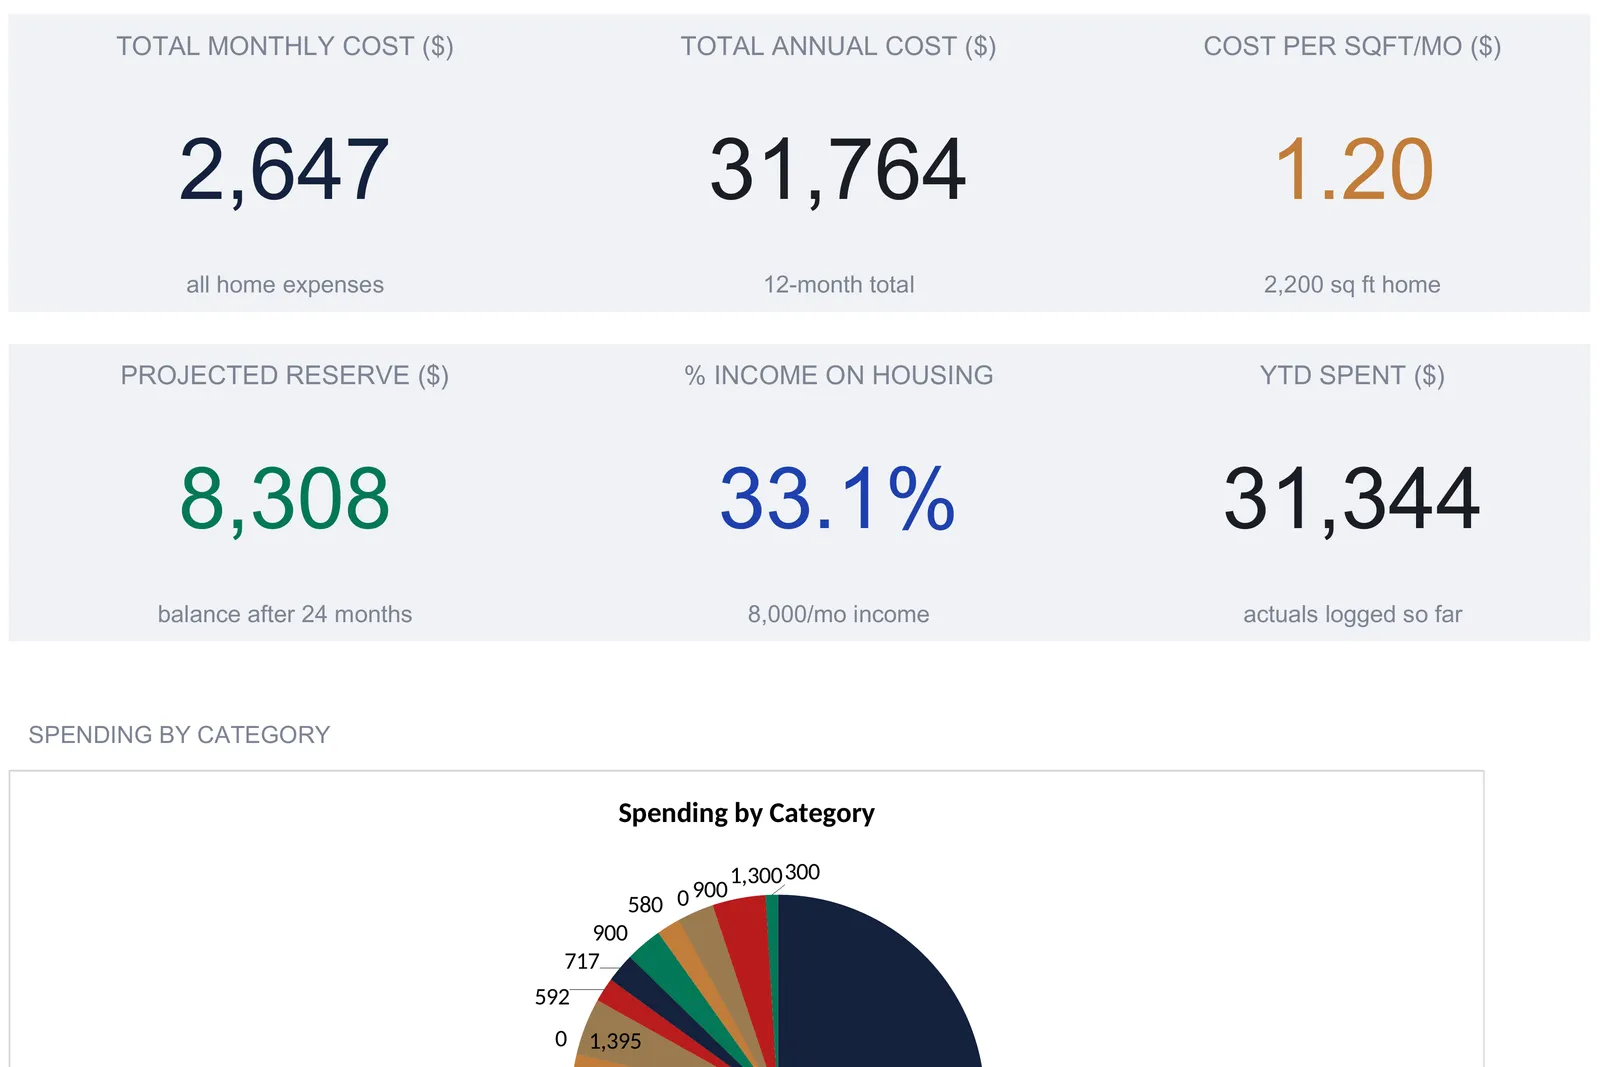
A home expense spreadsheet turns the scattered cost of owning a house into one connected view: fixed monthly costs like mortgage, property tax, and insurance, variable costs like utilities and maintenance, a month-by-month log of what you actually spend, a repair log, a budget-vs-actual comparison, and a repair reserve that projects two years ahead. This walkthrough follows the full structure with a worked example, a 2,200 square foot home carrying $2,647 a month and $31,764 a year in total cost. Our Home Expense Calculator Ultimate Spreadsheet Template ($29) ships the same structure ready-made for Excel and Google Sheets.
The mortgage is the number every homeowner can recite. The rest of what a house costs is harder to say out loud, because it arrives in pieces: a property tax bill twice a year, an insurance premium once, utilities that swing with the seasons, a water heater that fails without warning, and a slow drip of small repairs that never quite feels like a line item. Ask an owner what the mortgage is and the answer comes instantly. Ask what the house actually costs to run in a year, all in, and most people go quiet. The gap between those two numbers is where a home expense spreadsheet earns its place.
Closing that gap takes structure, not just a longer list. This walkthrough follows six sheets that hand off in order: a Home Details sheet that captures every cost once, a Monthly Tracking grid that logs what you actually spend across twelve months, a Maintenance Log for repairs, a Budget vs Actual sheet that compares the plan to the year, a Repair Reserve that projects a savings cushion two years ahead, and a Dashboard that reads the headline totals back. The examples come from our Home Expense Calculator Ultimate Spreadsheet Template ($29), which ships the whole thing ready-made for Excel and Google Sheets. Everything it does is reproducible by hand if you would rather build your own home expense spreadsheet from scratch.
What a home expense spreadsheet has to hold, and what a plain tracker leaves out
A running list of what you paid this month answers a small question well: where did the money go in October. Homeownership asks bigger ones. What does the house cost per year once the twice-a-year and once-a-year bills are folded in. Which categories are seasonal and which are steady. How far is the repair fund from a real cushion. A general homeowner’s budget built around monthly categories answers the first layer, and for many households that is enough. This workbook is built for the layers underneath, and it carries four things a plain expense list does not.
- Fixed and variable costs kept apart. The mortgage, property tax, insurance, and HOA are one group; the maintenance budget and the four utilities are another. Splitting them is what lets the file say that the $1,580 mortgage is only part of a $2,647 monthly reality.
- A month-by-month log, not a single snapshot. Thirteen categories run across all twelve months, so a heating spike in January or a summer of lawn care shows up as a shape rather than an average.
- Repairs tracked as their own record. A dedicated Maintenance Log captures each job with a date, vendor, category, and urgency, then rolls the spending up by category so a year of small fixes becomes a readable total.
- A reserve that looks forward. A Repair Reserve sheet projects a savings balance across twenty-four months and measures it against several cushion targets, turning “we should save for repairs” into a tracked number.
The walkthrough below follows the six sheets in the order the work happens, starting with the Home Details sheet that feeds the cost tiles and the reserve targets, and a How to Use sheet carries the same instructions inside the file.
Capture the costs once: the Home Details sheet
Home Details is where the house is described a single time, and four of the six dashboard tiles read back from it. The sheet is organized into four blocks, and the tinted cells are the ones you fill in, while the totals and the summary lines below them hold the formulas.
The Home Information block holds the facts about the property: a home value of $350,000, 2,200 square feet of finished space, a purchase date of June 15, 2022, and a gross monthly household income of $8,000. The square footage drives the per-square-foot cost later, the home value drives the one percent reserve target and the 1 percent rule hints, and the income figure exists only to compute the housing ratio.
The Fixed Monthly Costs block lists the four costs that stay put between months: a $1,580 mortgage or rent payment, $350 in property tax, $125 in home insurance, and $0 in HOA fees for this sample home. The tax and insurance cells carry a small hint that annualizes them on the spot, so property tax reads “Annual: $4,200” and insurance “Annual: $1,500” beside the monthly figures. Those three fixed lines plus the empty HOA add to a Total Fixed of $2,055 a month.
The Variable Monthly Estimates block holds the costs that move: a $292 maintenance budget, $110 electric, $60 gas, $55 water, and $75 internet, for a Total Variable of $592. The maintenance figure arrives pre-filled at the 1 percent rule, and the hint cell beside it computes the same thing live: one percent of the home value divided by twelve, which on $350,000 reads “1% rule: $292/mo”. It is a common starting estimate rather than a rule for any particular house, and the budget cell itself is an input you type over.
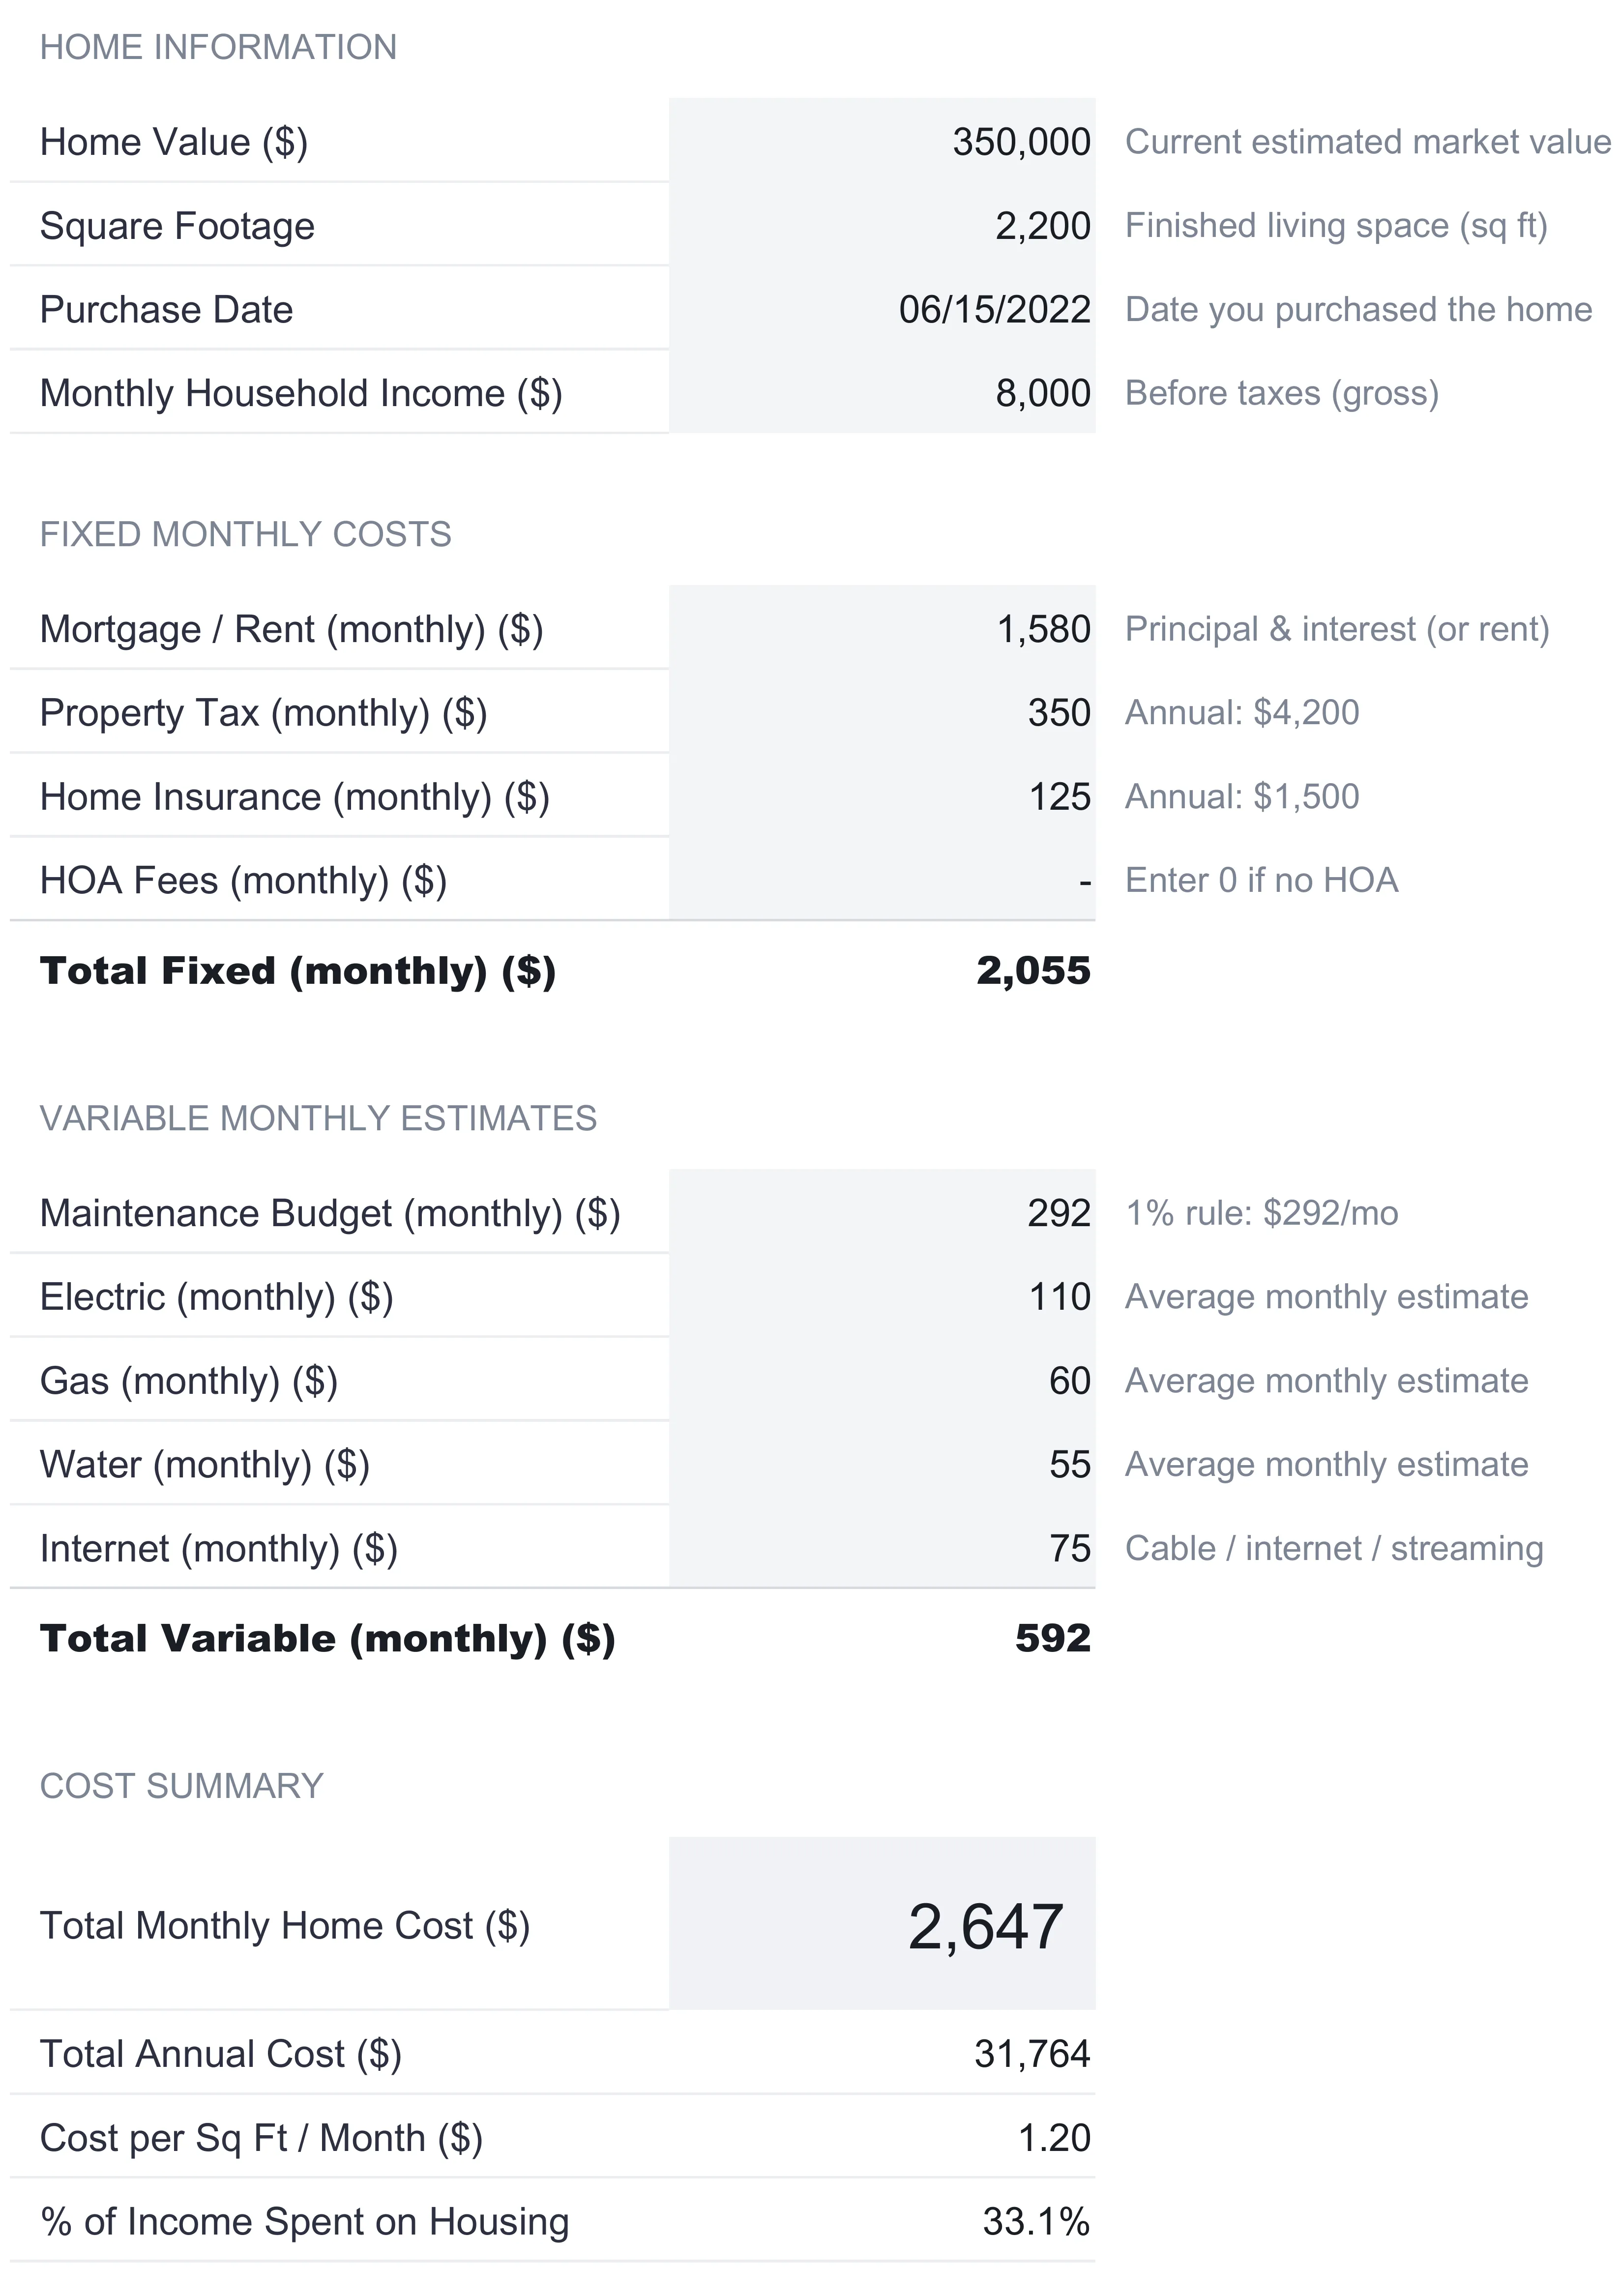
The Cost Summary block at the bottom is where the two blocks above combine. Total Monthly Home Cost adds the $2,055 fixed to the $592 variable for $2,647. Total Annual Cost multiplies that by twelve to reach $31,764. Cost per Sq Ft per Month divides the $2,647 by 2,200 square feet, which the sheet shows to two decimals as $1.20, a figure that makes two homes of different sizes comparable. And the last line divides the $2,647 monthly cost by the $8,000 income to report 33.1 percent of income spent on housing. Worth knowing about that last one: the file reports it as a plain ratio and does not measure it against any threshold. Housing-cost benchmarks exist and lenders use several of them, but they differ by method, so the sheet leaves the percentage on view and lets you read it rather than grading it.
The design point here is that the summary lines are formulas rather than numbers anyone retypes. Change a fixed or variable input and the two totals, the annual figure, the per-square-foot cost, and the housing ratio all re-figure at once, and three of the four Repair Reserve targets, which follow the total monthly cost, move with them. Editing the home value shifts the one percent reserve target and the 1 percent rule hints, while the maintenance budget cell keeps whatever number is left in it. That split between computed lines and typed inputs is the behavior worth copying into any home cost spreadsheet built by hand.
Log what actually happens: the Monthly Tracking sheet
Home Details plans the year; Monthly Tracking records it. The sheet is a grid of thirteen categories down the side and the twelve months across the top, with an Annual Total column that sums each row. The categories are Mortgage, Property Tax, Insurance, HOA, Electric, Gas, Water, Internet, Lawn/Garden, Cleaning, Repairs, Improvements, and Other, which is a wider net than the Home Details estimate casts because it names the irregular spending that plans tend to miss.
The fixed lines march straight across: $1,580 of mortgage every month sums to $18,960 for the year, $350 of property tax to $4,200, $125 of insurance to $1,500. The interesting rows are the ones that move. Gas runs from $85 in January down to $20 in July and back up to $80 in December, the clear signature of a heating bill, and totals $592 for the year. Electric moves the opposite way, peaking at $145 in August as cooling kicks in, and totals $1,395. Water climbs through summer with the lawn. Lawn and Garden appears only from March through October and totals $580. Repairs shows up in four scattered months for $900, and Improvements in just two, April and August, for $1,300.
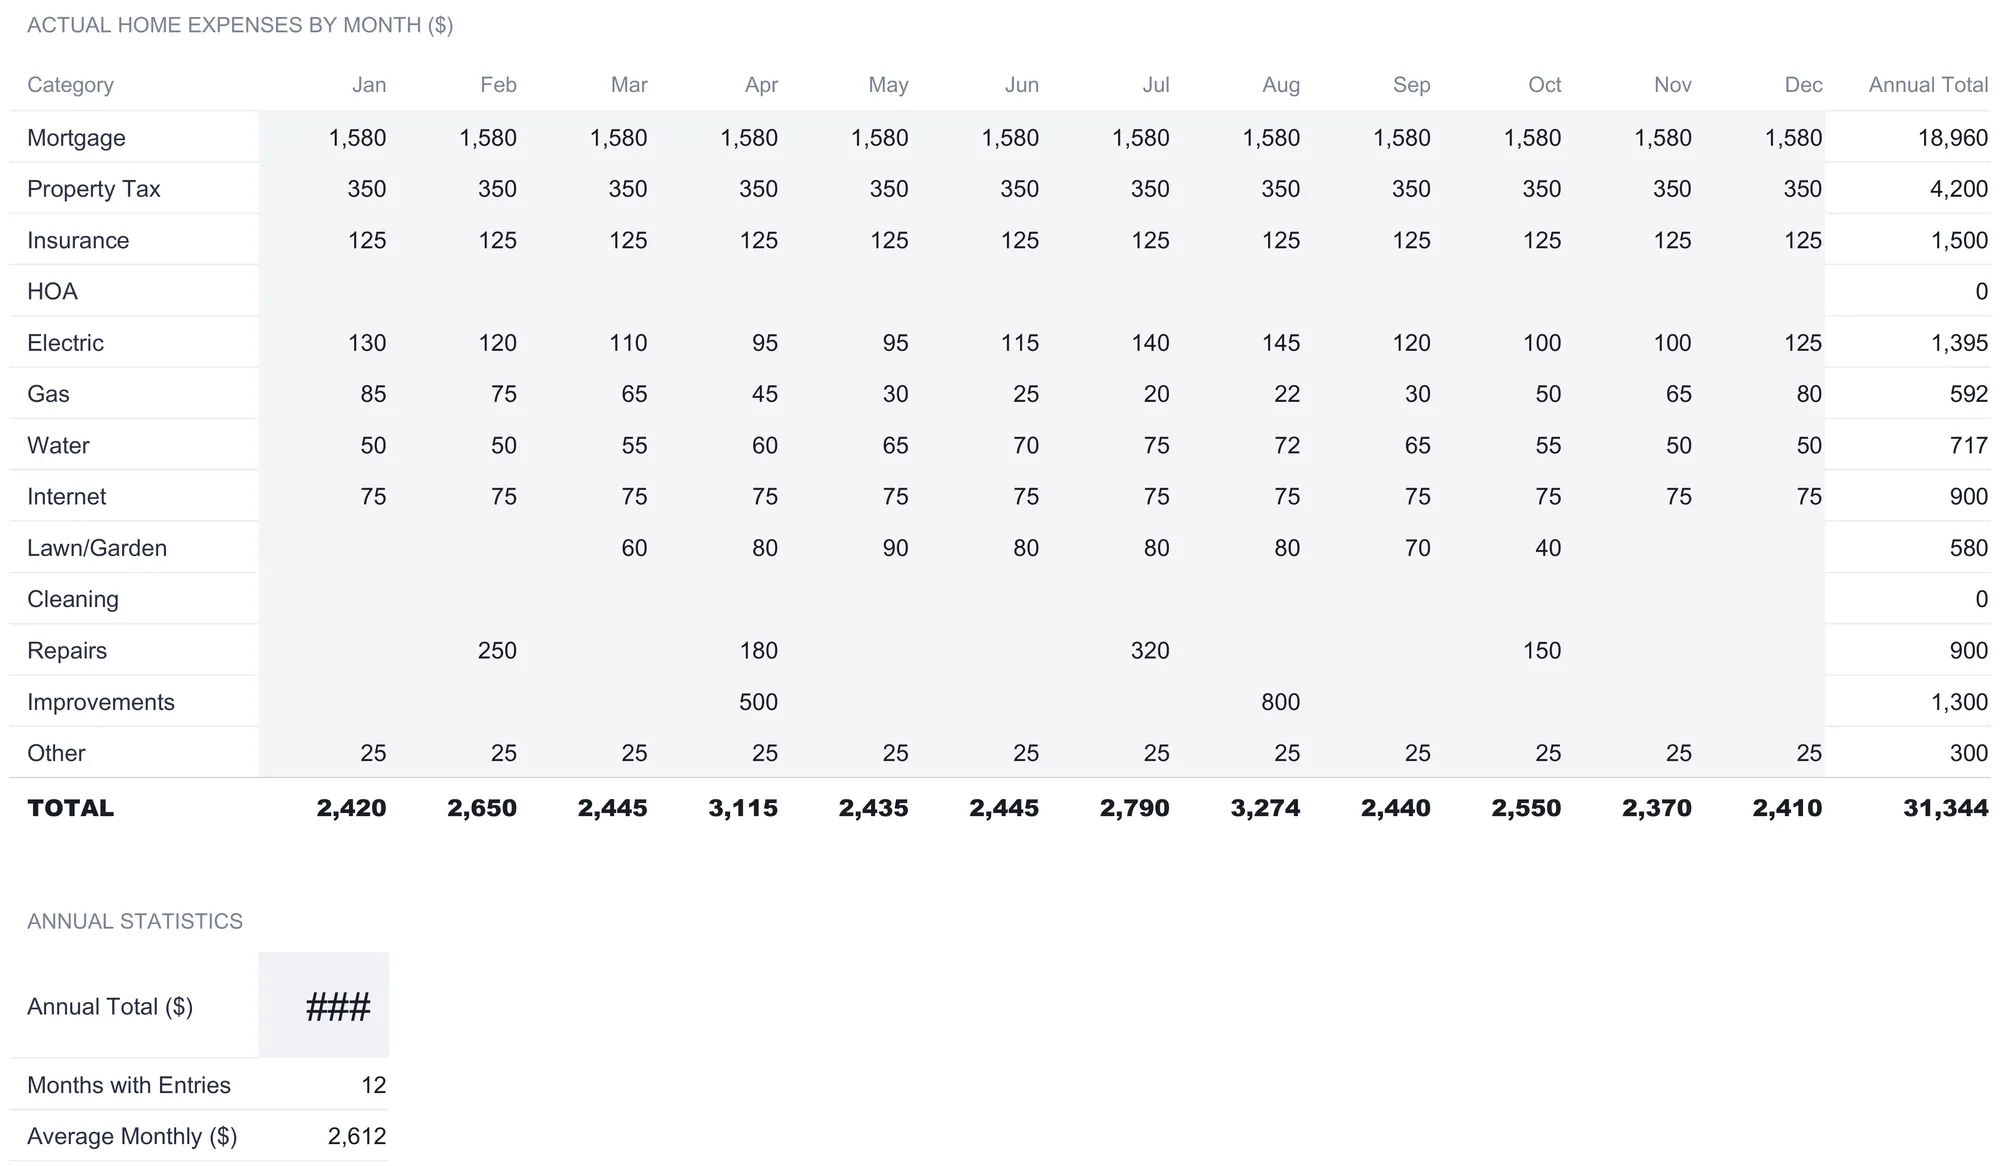
The bold TOTAL row at the bottom adds each month’s column, and reading it across tells the year’s story in twelve numbers: a quiet $2,420 in January, a spike to $3,274 in August when a $145 electric bill met an $800 improvement, and a settled $2,410 by December. The Annual Total in the corner reaches $31,344. Below the grid, an Annual Statistics block reports three figures: the annual total again, the count of months carrying an entry, which is twelve here, and an Average Monthly of $2,612. That average divides the total by the months that actually have data rather than always dividing by twelve, so a half-filled year still reports a fair monthly figure instead of one dragged down by the empty months.
This is the sheet that explains the gap between two dashboard numbers. Home Details estimated $31,764 for the year using a flat $292 maintenance budget every month. Monthly Tracking logged $31,344 in real spending, where that maintenance turned into actual repairs and improvements clustered in specific months. The plan and the record rarely match to the dollar, and the small distance between them is the whole reason to keep the log.
Keep a repair record: the Maintenance Log sheet
Utilities are predictable enough to estimate. Repairs are not, which is why they get their own sheet. The Maintenance Log holds up to fifty rows, each capturing a single job across seven columns: the date, a description, a category, the cost, the vendor, an urgency level, and free-text notes. The sample carries ten entries running from a $45 furnace filter in March 2026 to a $65 water heater flush that August.
The two dropdown columns are what turn a list into a report. Category offers Plumbing, Electrical, HVAC, Roof, Appliance, Landscape, Pest, and Other, and Urgency offers Emergency, Planned, and Preventive. Tagging each job means the sheet can answer questions a flat list cannot: how much went to plumbing this year, how many jobs were emergencies rather than planned upkeep, which vendor handled what. The $320 dishwasher pump replacement is tagged Appliance and Emergency with the note “Flooding risk - urgent”; the $120 HVAC tune-up is Preventive with “Spring prep”. One row is a genuine repair, the other is the kind of maintenance that prevents one.
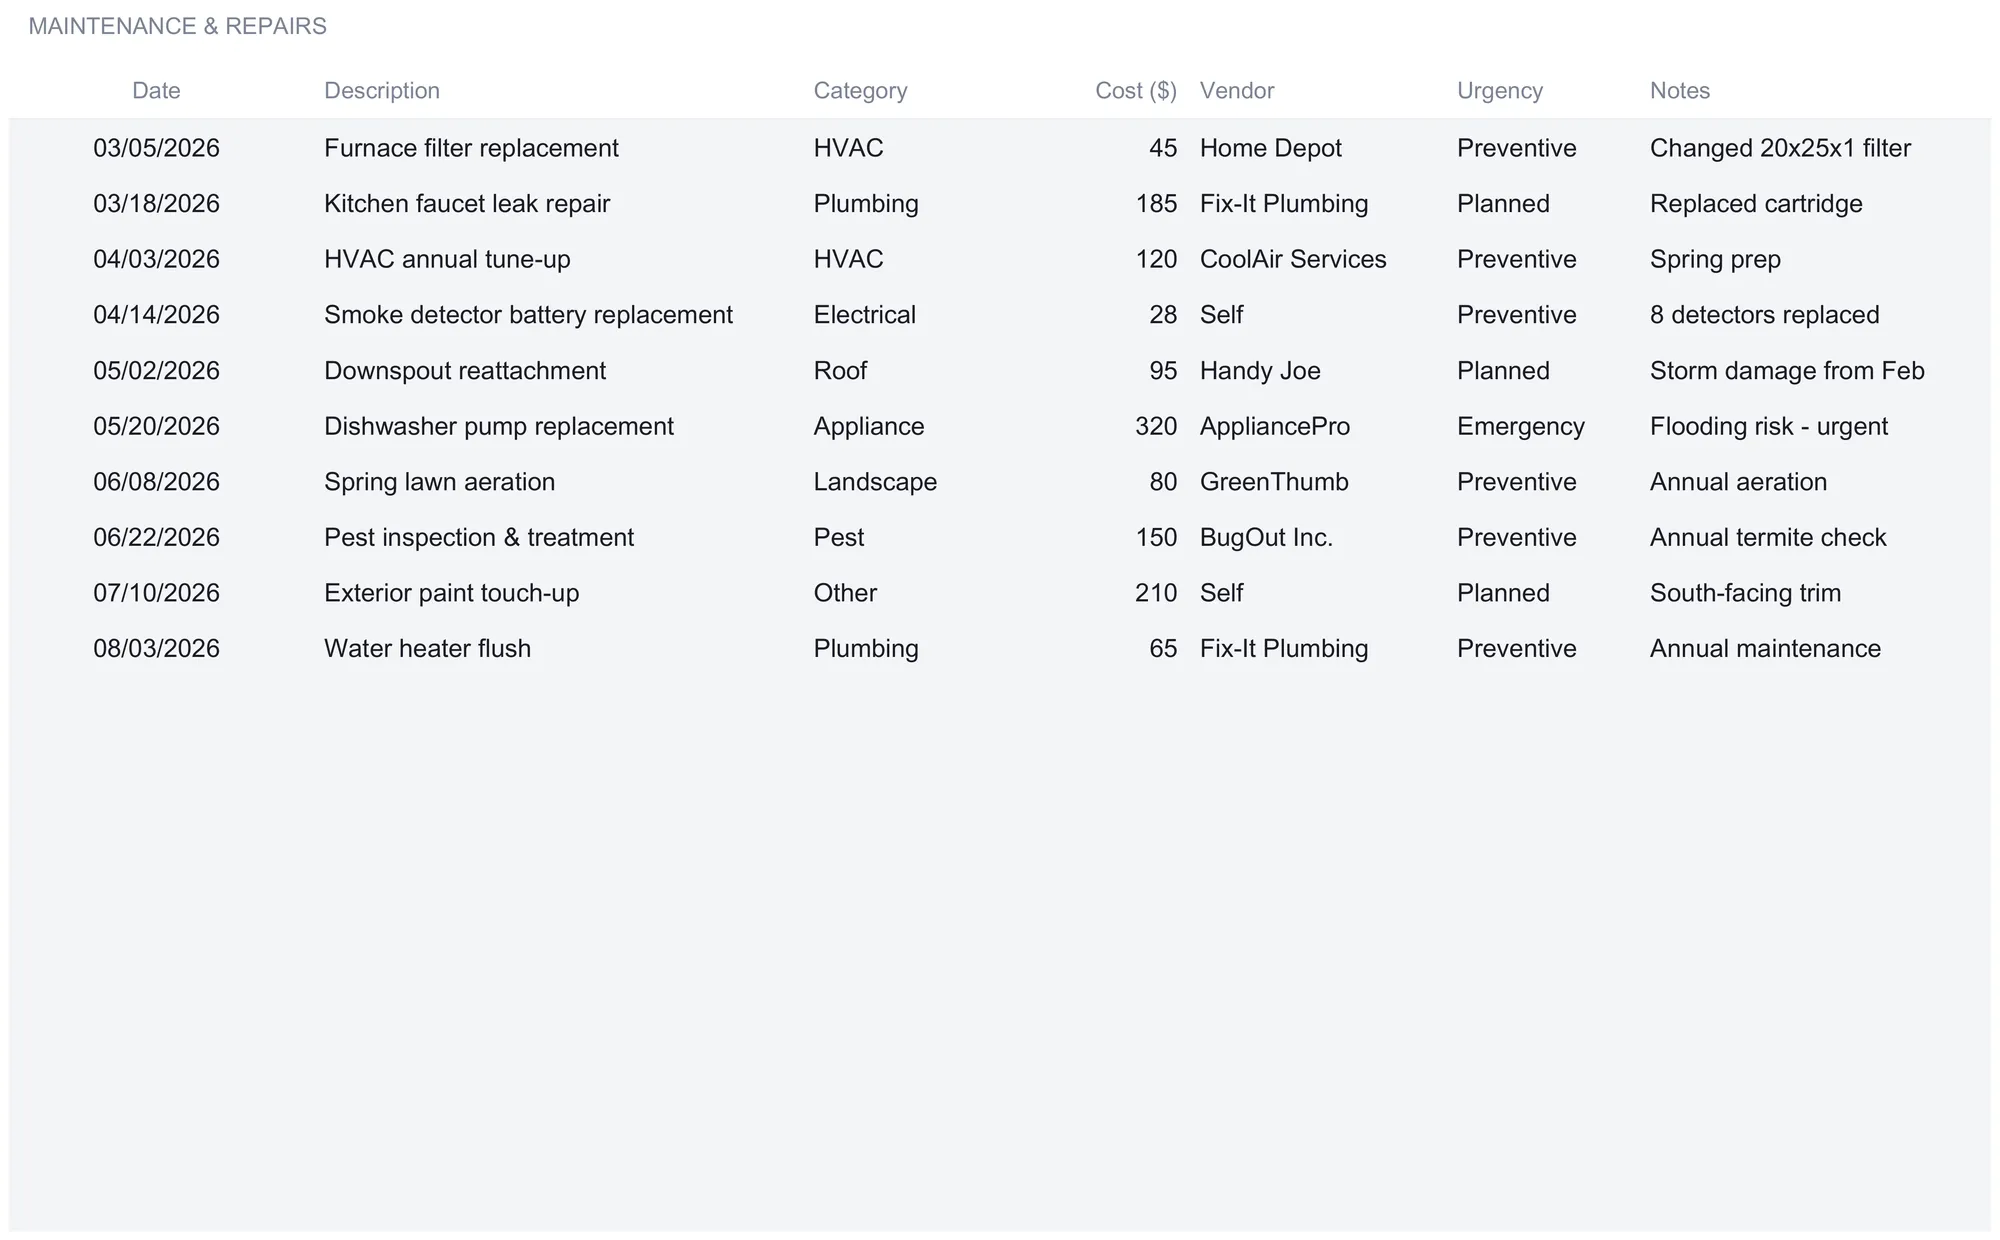
Below the entries, two rollups compute automatically. A running total counts the filled rows and sums their cost, reading ten items for $1,298 in the sample. A Cost by Category breakdown then splits that total eight ways with a dollar figure, an item count, and a percent of the whole for each: Appliance leads at $320, or 24.7 percent, on the strength of that one emergency; Plumbing follows at $250 across two jobs, 19.3 percent; Other is $210, HVAC $165 across two visits, Pest $150, Roof $95, Landscape $80, and Electrical just $28. A final “Not on the list above” row catches anything typed over the dropdown, so a category the list does not name still lands in the total and the breakdown still reconciles. Seeing that one flooded dishwasher accounts for nearly a quarter of the logged repair spend is the kind of pattern a shoebox of receipts never surfaces.
Compare the plan to the year: the Budget vs Actual sheet
With a plan in Home Details and a record in Monthly Tracking, the Budget vs Actual sheet sets them side by side. It lists the same thirteen categories with four columns: a Planned figure you type as your annual target, an Actual figure that pulls straight from the Monthly Tracking annual totals, a Variance that subtracts one from the other, and a variance percent. The Variance and Var % figures carry the color, red where the actual came in over the plan and green where it came in under, so the eye finds the misses before it reads a single number.
The sample makes the categories tell different stories. Improvements were planned at $600 and came in at $1,300, running $700 or 116.7 percent over, the year’s largest overshoot. Lawn and Garden went the other way, planned at $960 against $580 actual, $380 or 39.6 percent under. Repairs landed $300 under a $1,200 plan, and Gas came in $128 below its $720 estimate after a mild winter. Electric and Water each ran modestly over, $75 and $57. The fixed lines, mortgage, tax, and insurance, match to the dollar because they never move.
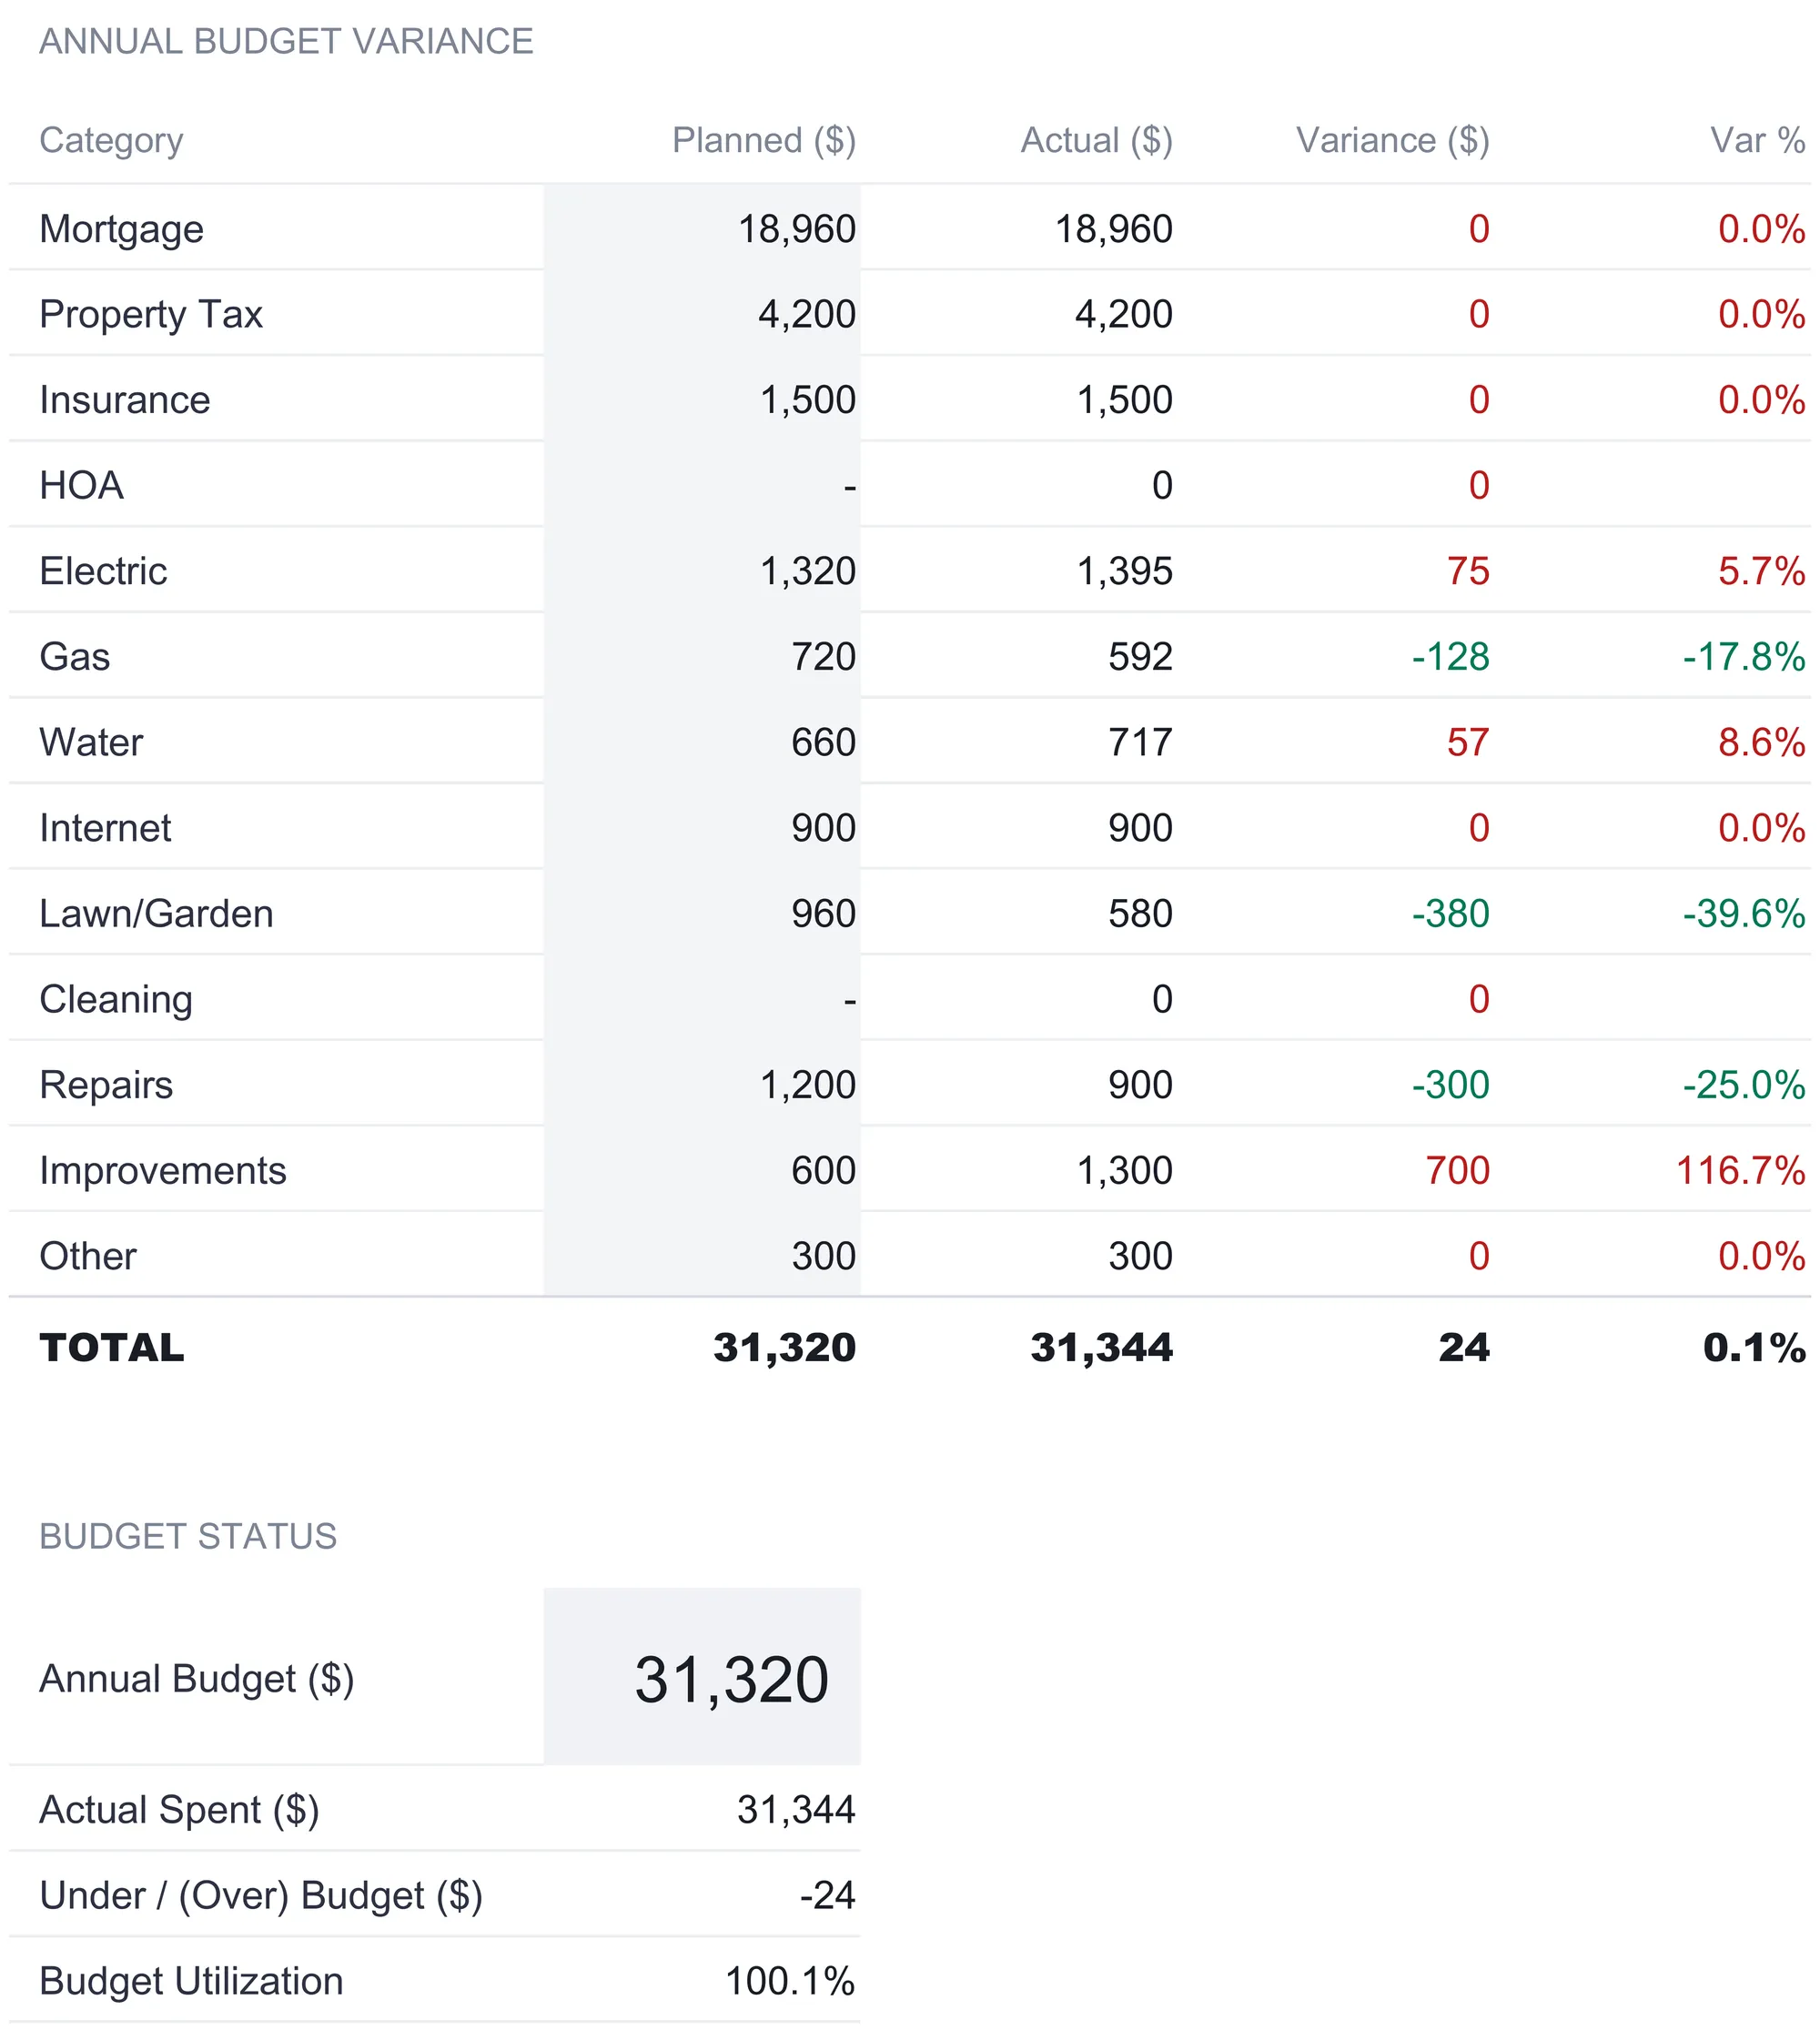
What makes the sheet honest is the total. The plan summed to $31,320 and the year came in at $31,344, a variance of just $24, or one tenth of one percent, with budget utilization at 100.1 percent. A homeowner reading only that bottom line would conclude the year went exactly to plan. The category rows say otherwise: a $700 improvement overage was nearly cancelled out by underspending on lawn care, gas, and repairs. The individual misses were hundreds of dollars in both directions; they simply netted to almost nothing. Seeing both the tidy total and the messy categories is the reason the sheet keeps them on the same page, and a Budget Status block underneath restates the annual budget, actual spent, the amount over or under, and the utilization percent for a quick read.
Build the cushion: the Repair Reserve sheet
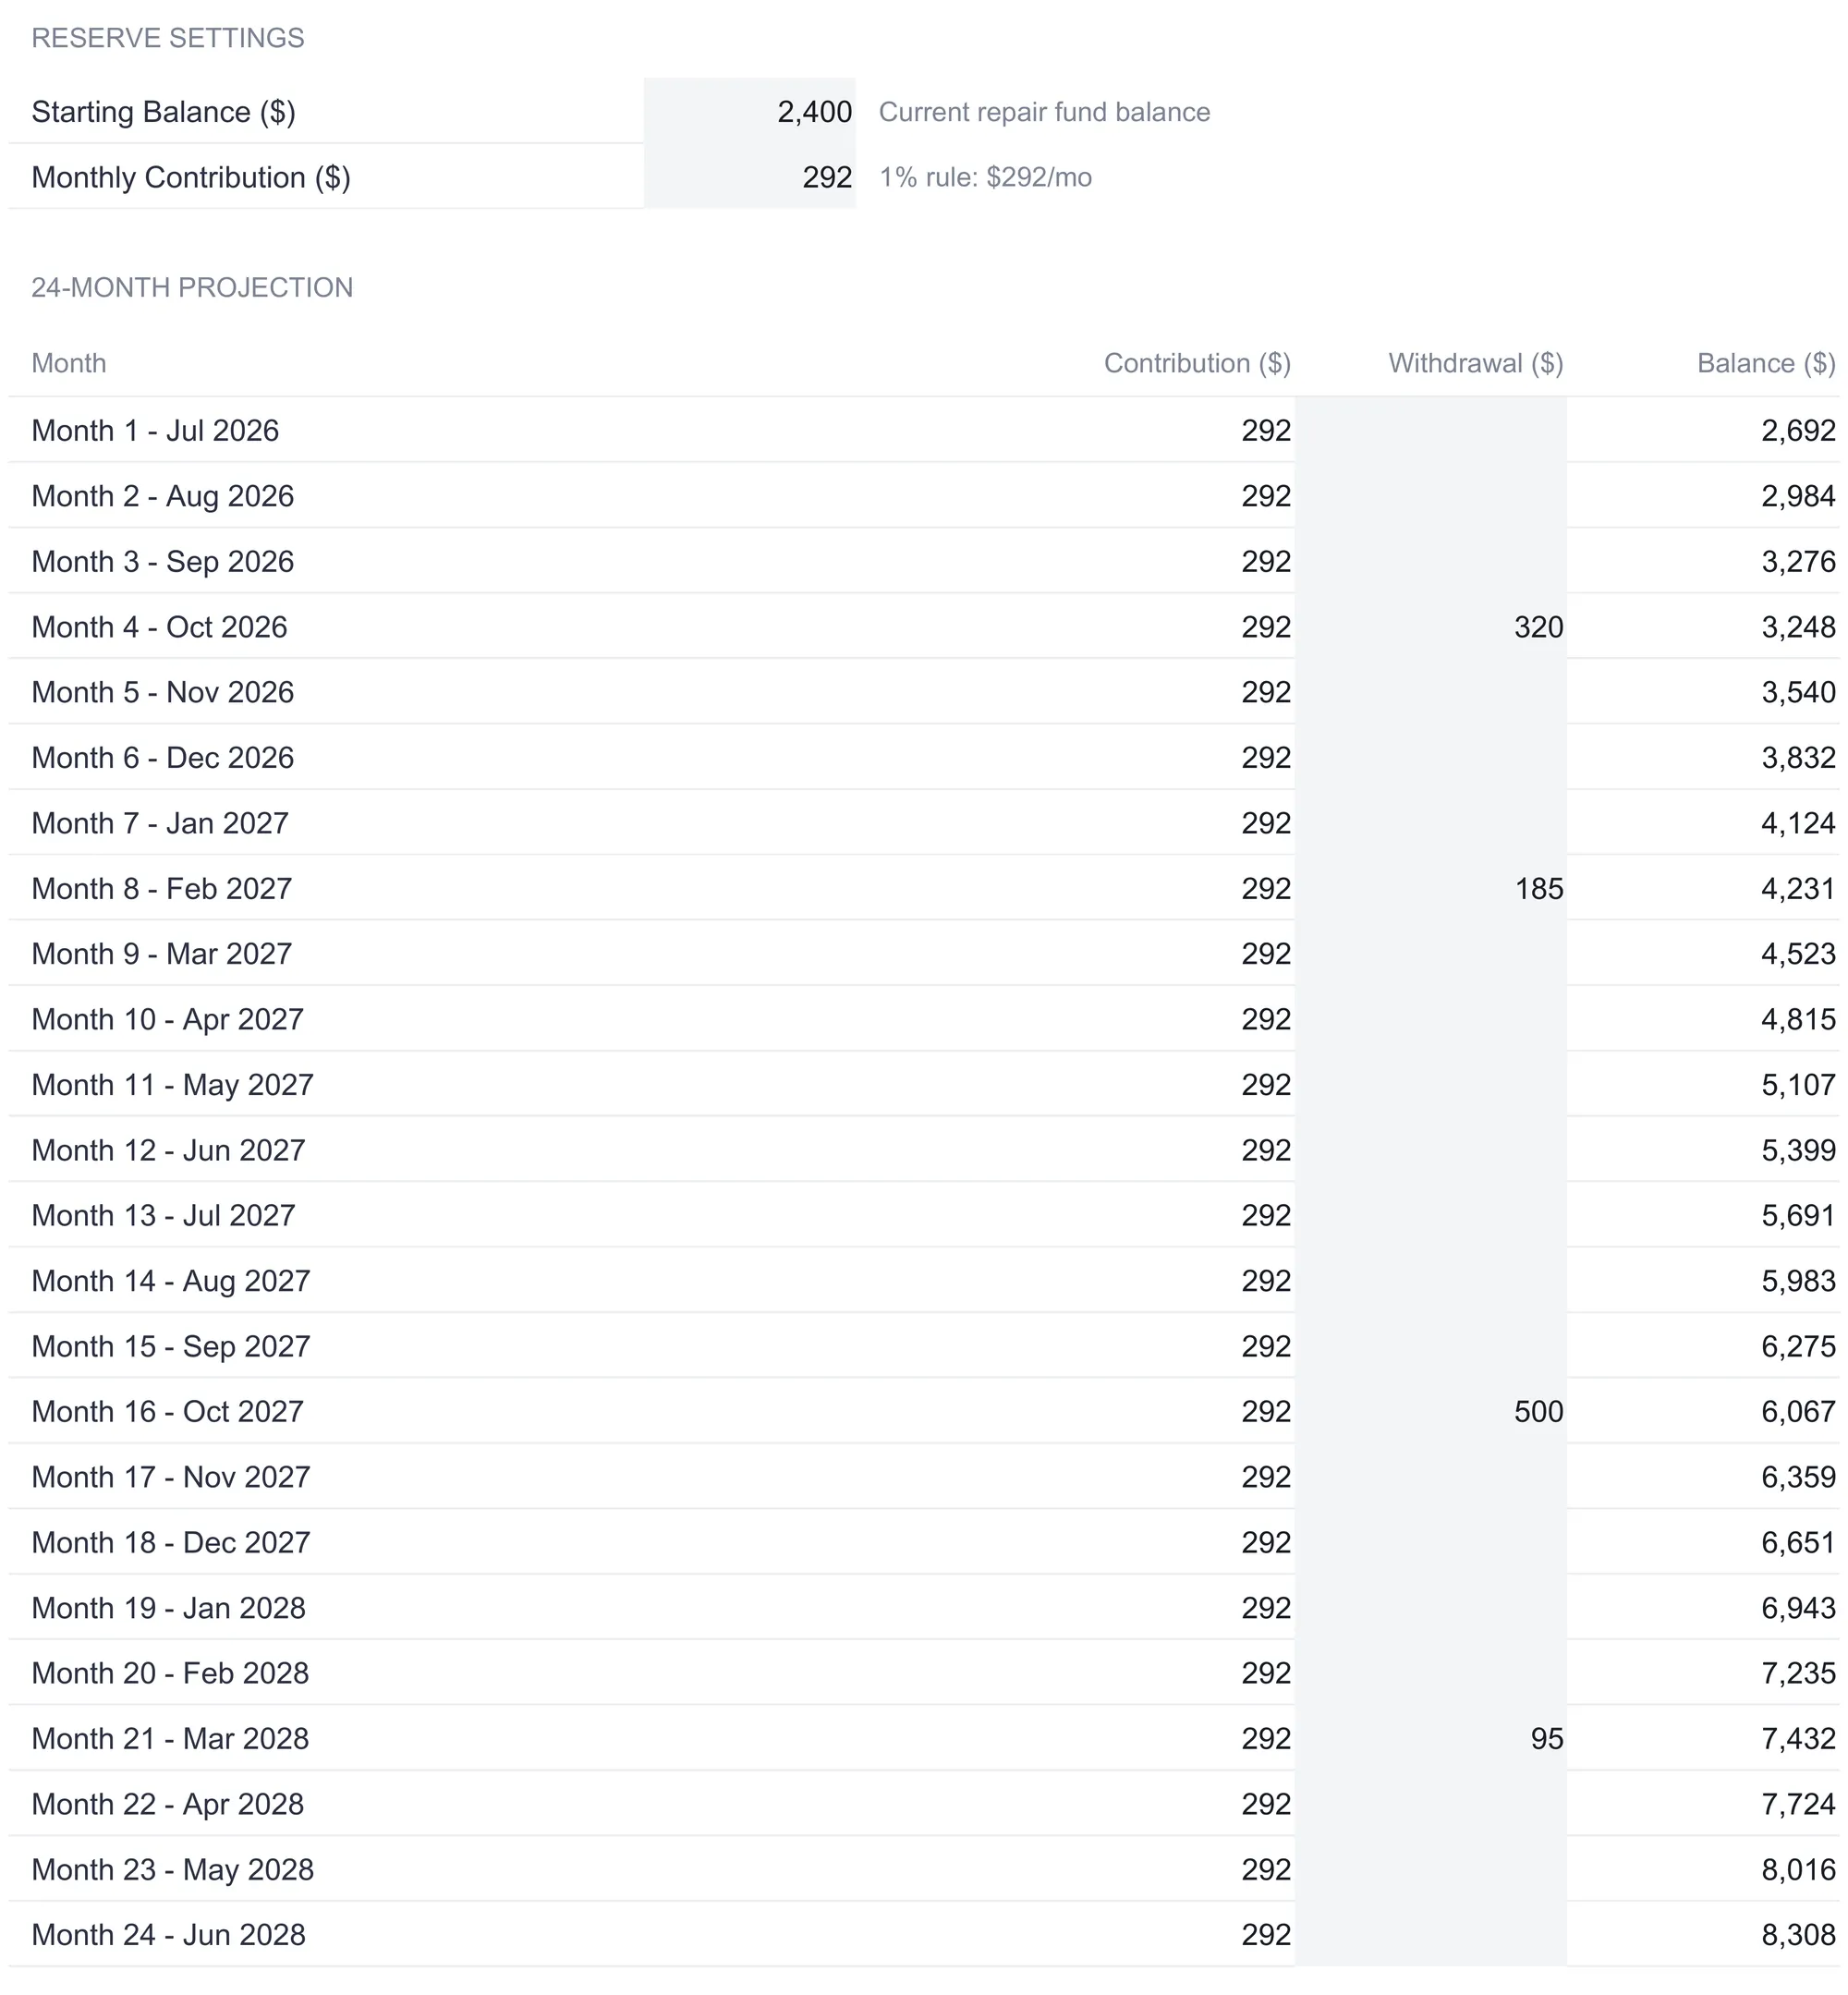
The last working sheet looks forward instead of back. Homeownership costs arrive in lumps, and the Repair Reserve sheet is where a household plans the savings that absorb them. Two settings drive it: a starting balance, $2,400 in the sample, and a monthly contribution of $292, seeded from the same 1 percent figure the maintenance budget uses.
From those two numbers the sheet projects twenty-four months, running from July 2026 through June 2028, with a row per month carrying a contribution, a withdrawal, and a running balance. Each month adds the $292 and subtracts anything in the withdrawal column, so the balance carries forward. The sample shows the reserve doing its job: four withdrawals over the two years, a $320 repair in October 2026, $185 the following February, a larger $500 in October 2027, and $95 in March 2028, each one denting the balance without emptying it. After twenty-four months of steady contributions and those four draws, the balance reaches $8,308, which is the figure the dashboard reports as the projected reserve.
Below the projection, a Reserve Targets table answers the question the projection raises: how big should the cushion be. Rather than name one figure, it computes four from your own inputs and shows how far the $2,400 starting balance reaches toward each. One percent of home value a year is $3,500, which the balance already covers 68.6 percent of. Three months of total home costs is $7,941, or 30.2 percent funded. Six months is $15,882, and a full year of home costs is $31,764, which the starting balance covers just 7.6 percent of. Laying the four side by side makes the trade visible, since a fund that looks healthy against the 1 percent target looks thin against a year of costs, and the sheet takes no position on which target is right. It reports several so the choice stays with you. A reserve like this is close cousin to an emergency fund sized in a spreadsheet, with the difference that it is measured against the house rather than against months of income.
The dashboard: six numbers and two charts
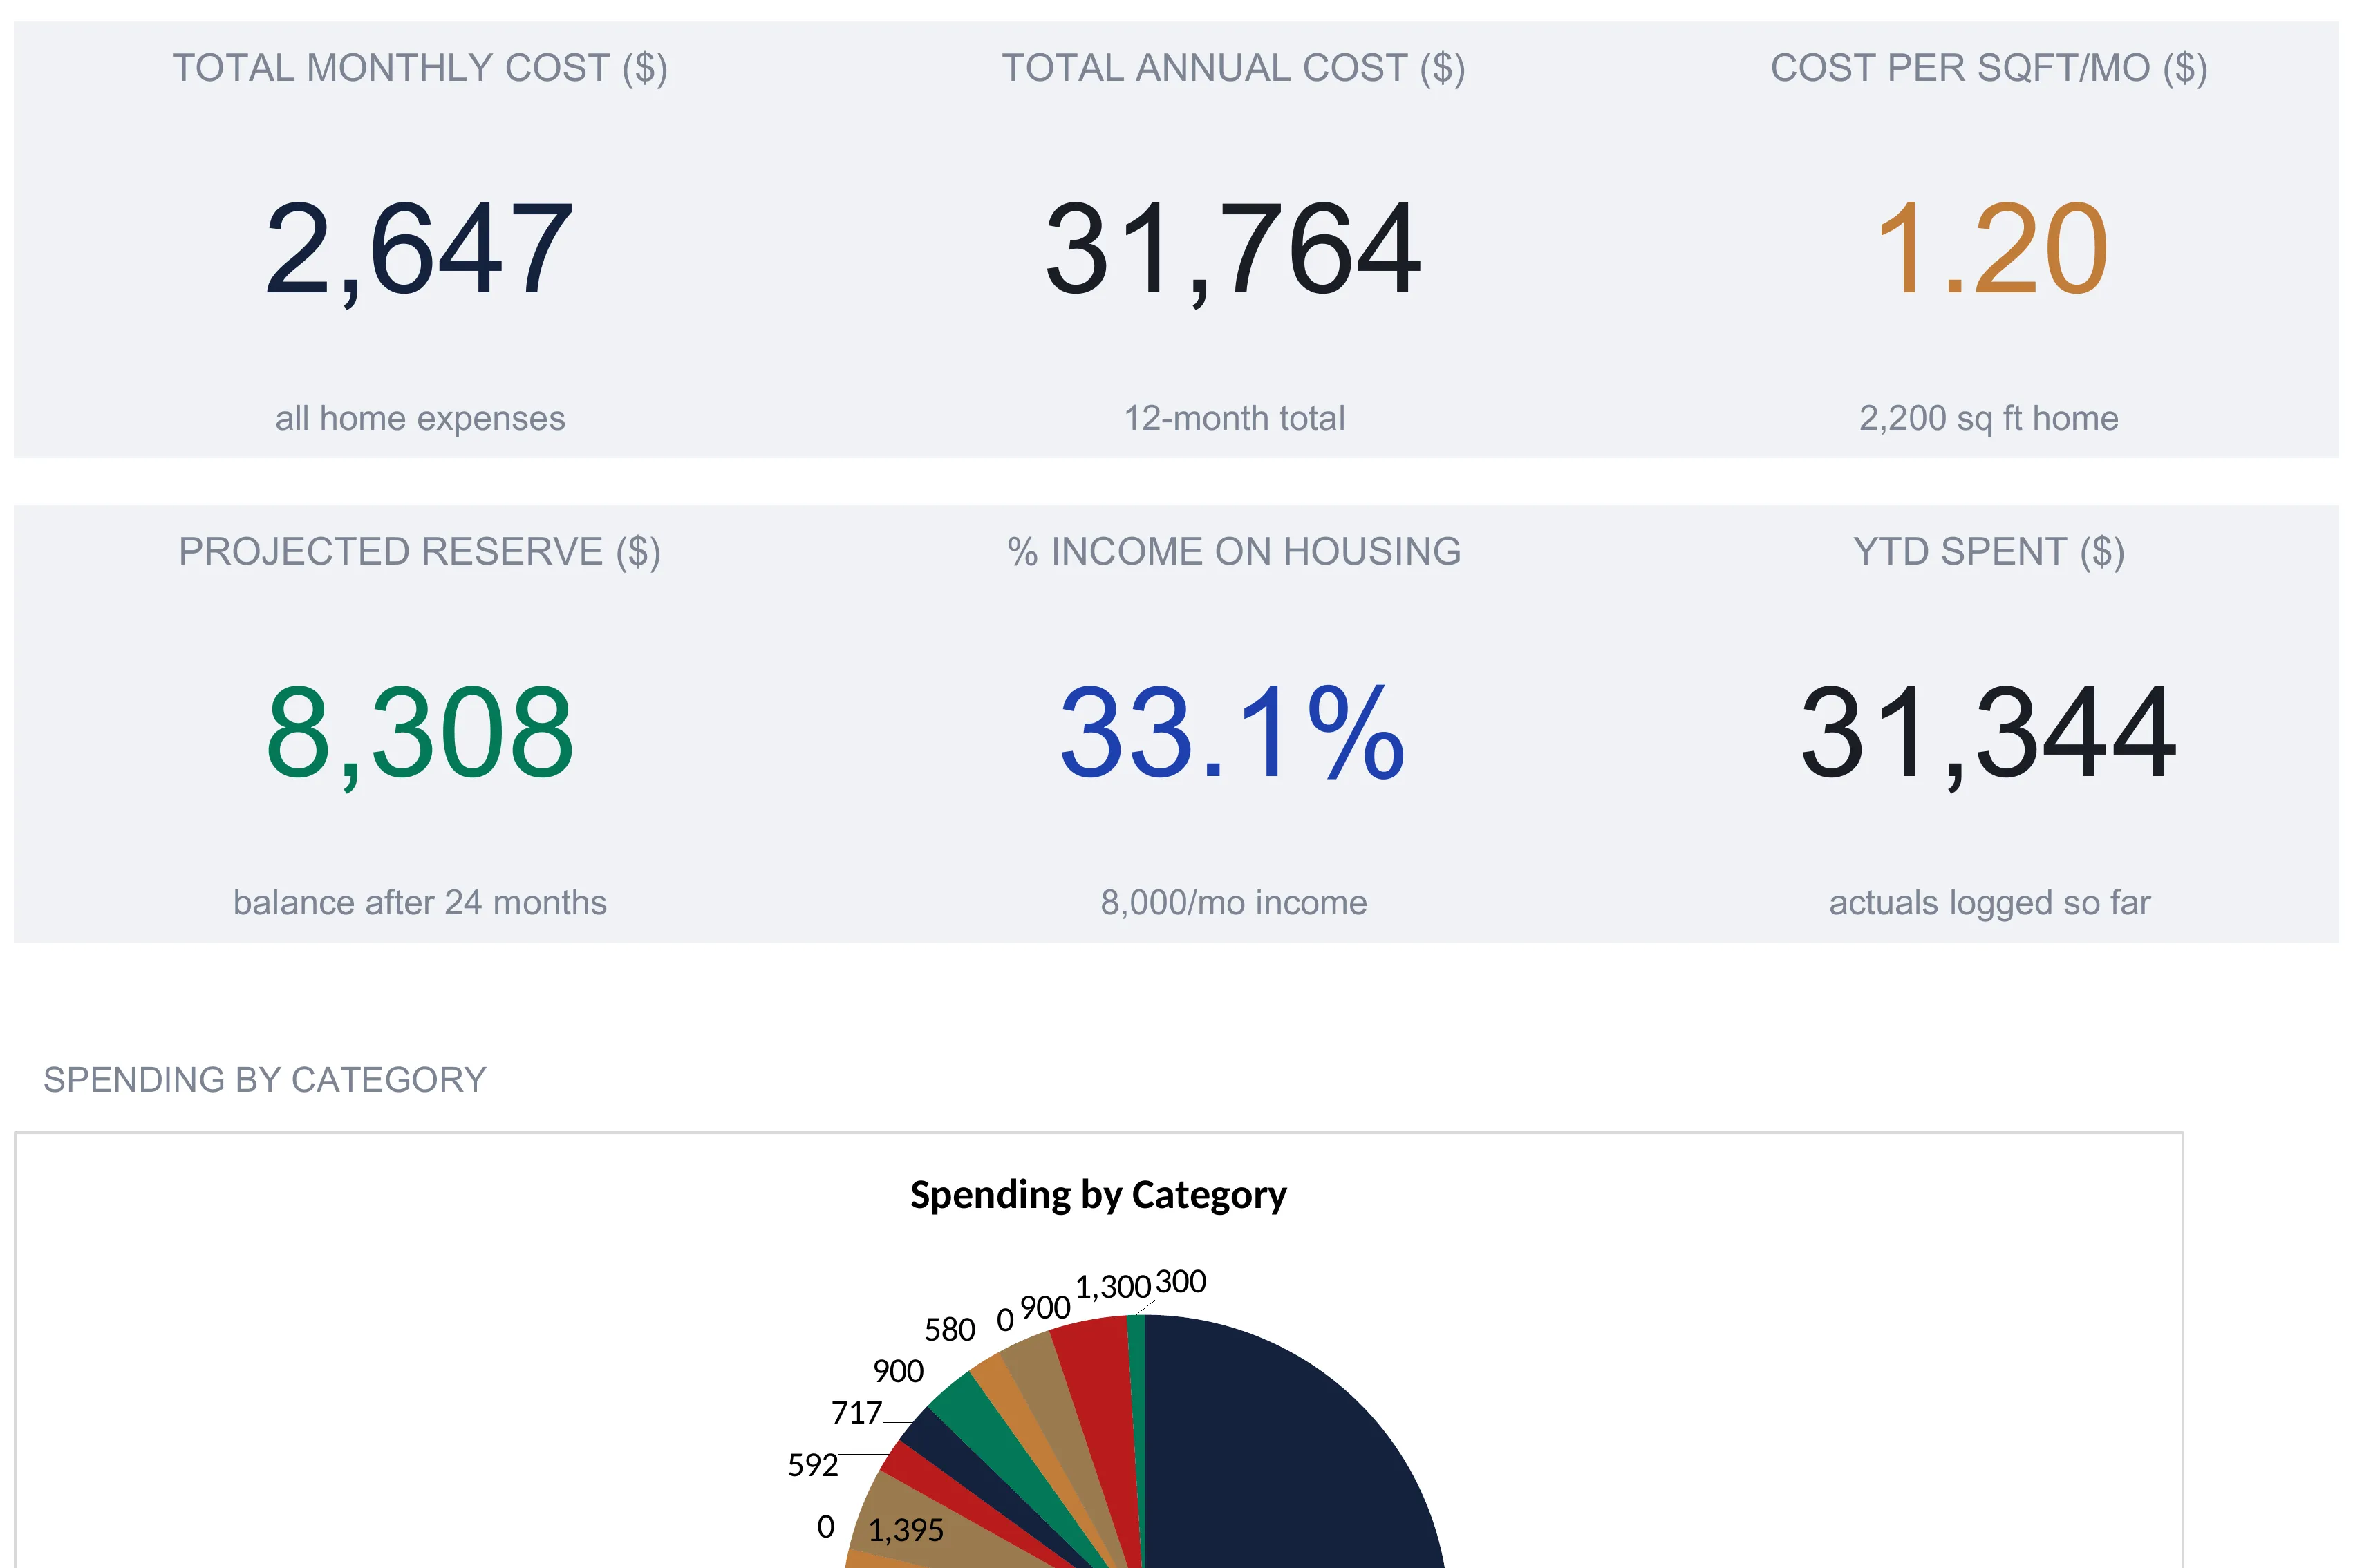
With the working sheets filled, the Dashboard reads the headline numbers back at a glance. Six KPI tiles sit across the top, and each pulls from a sheet already covered:
| Tile | Sample value | What it reads |
|---|---|---|
| Total monthly cost | $2,647 | All fixed and variable home costs per month |
| Total annual cost | $31,764 | The monthly cost projected across twelve months |
| Cost per sqft/mo | $1.20 | Monthly cost divided by 2,200 square feet |
| Projected reserve | $8,308 | The reserve balance after the 24-month projection |
| % income on housing | 33.1% | Monthly cost over gross monthly income |
| YTD spent | $31,344 | The total logged so far in Monthly Tracking |
Two of these repay a second look. Total annual cost and YTD spent describe the same year through different lenses, the first a forward estimate at $31,764 and the second the logged reality at $31,344, and reading them together is how the file shows plan against actual at the top level. Cost per square foot, meanwhile, is the number that travels, since $1.20 a month per square foot compares cleanly against a different house in a way that a raw monthly total never can.
Below the tiles, two charts turn the numbers into pictures. A Spending by Category pie chart draws from the Monthly Tracking annual totals, so the mortgage’s $18,960 dominates the circle while the smaller slices of utilities, lawn care, and repairs fan out around it. A Budget vs Actual by Category bar chart sets each category’s planned bar next to its actual bar, making the improvement overage and the lawn-care underspend visible as pairs of unequal bars. Because every tile and chart reads from the source sheets by formula, a changed insurance premium on Home Details or a fresh figure in the Monthly Tracking grid moves the dashboard the moment you type it.
Total cost, tracked cost, and the reserve in plain terms
Three phrases in this workbook sound similar and mean different things, and keeping them straight is most of understanding the file.
Total cost is the whole picture of what the house takes, fixed plus variable, before you have logged a single real bill. In the sample it is the $2,647 a month and $31,764 a year that Home Details estimates.
YTD spent is what you have actually recorded in Monthly Tracking, category by category and month by month. At $31,344 it sits just under the estimate, and the small distance between the two is the difference between planning a year and living it.
Projected reserve points at the future rather than the present. It is the balance the Repair Reserve sheet expects after twenty-four months of contributions and withdrawals, $8,308 here, and it answers a different question than the cost figures do: not what the house costs, but whether there is money set aside for the day a cost arrives all at once. Costs look backward and sideways; the reserve looks forward, and a complete home-cost picture needs all three.
Where a home expense spreadsheet fits alongside your mortgage and budget
This workbook specializes in the running cost of a house, which means it deliberately leaves some neighboring jobs to other tools. It does not amortize the loan itself: the $1,580 mortgage line is a single input, not a schedule that splits principal from interest or projects a payoff. That is a separate calculation, and working a mortgage payment out in a spreadsheet is its own exercise. The file also does not track a whole household budget, since it names one income figure only to compute the housing ratio and otherwise stays focused on the house.
How property tax and insurance actually reach the bills changes how you fill in the fixed block. Many mortgages fold those two costs into the monthly payment through an escrow account, which the Consumer Financial Protection Bureau describes as an account a lender sets up to pay property-related expenses on your behalf. If your loan escrows, the $350 tax and $125 insurance lines may already sit inside your mortgage payment rather than beside it, so the template lets you enter them either way, as separate lines or folded into the mortgage figure, depending on how your servicer handles them.
Excel or Google Sheets for tracking home expenses
The template is an .xlsx file built on standard formulas, with no macros and no add-ons, so it behaves the same in Microsoft Excel and in Google Sheets after upload, and the How to Use sheet notes it works in LibreOffice Calc as well. Google Sheets suits a household where two people want to open the same live home-cost file from different devices; Excel suits one that prefers a local file it controls. The structure described here, a Home Details sheet feeding a monthly log, a repair record, a budget comparison, and a reserve projection, is equally buildable in either, and nothing in this walkthrough depends on a feature only one of them has. A currency selector on the Dashboard rewrites the money labels and KPI titles across the sheets, changing the symbol shown without converting the underlying numbers.
Which template fits the job
- Home Expense Calculator Ultimate Spreadsheet Template ($29) is the workbook this walkthrough follows: the Home Details cost capture, the twelve-month tracking grid, the fifty-row maintenance log, the budget-vs-actual comparison, the twenty-four-month repair reserve, and the six-KPI dashboard, ready to use for a single home. The tier family starts smaller, with a free Home Expense Calculator template for a single-sheet cost estimate and a Home Expense Calculator Essentials ($19) that wraps a dashboard around the core cost sheet. The Ultimate version is the one that carries the monthly log, the maintenance record, the budget comparison, and the forward-looking reserve.
- Home Mortgage Calculator Ultimate Spreadsheet Template ($29) sits one step upstream. Where the expense calculator treats the mortgage as a single monthly input, the mortgage workbook builds the loan itself, with a full amortization schedule, extra-payment and refinance analysis, and scenario comparison, so it works out the payment figure that the expense calculator’s fixed block takes as a given.
Related
- Homeowner’s Budget Template: Utilities, Taxes, and Maintenance - the general year-long budget for the bills renters never see, a good companion to this cost-focused workbook
- How to Calculate a Mortgage Payment in a Spreadsheet - the amortization math behind the single mortgage line in the fixed-costs block
- How to Size an Emergency Fund in a Spreadsheet - the income-based cousin of the repair reserve, sized against months of expenses rather than against the house
Frequently asked questions
What counts as a home expense beyond the mortgage?
The mortgage payment is only the fixed core. This workbook separates fixed costs (mortgage or rent, property tax, home insurance, and HOA fees) from variable ones (a maintenance budget plus electric, gas, water, and internet), then logs the irregular categories most owners forget: lawn and garden, cleaning, repairs, and improvements. In the sample the fixed side is $2,055 a month and the variable side $592, so the true monthly cost is $2,647, well above the $1,580 mortgage line alone.
How much should I set aside for home maintenance?
The template seeds the maintenance figure with the 1 percent rule, one percent of home value a year divided by twelve, which on a $350,000 home is $292 a month. That is a starting estimate, not a ruling. Actual upkeep depends on the age of the house, the systems in it, and where it is, and every maintenance and reserve cell in the file is yours to change. The Repair Reserve sheet also shows the 1 percent figure alongside three, six, and twelve months of total home costs so you can compare cushion sizes rather than commit to one.
What does percent of income on housing mean here?
It divides the total monthly home cost by gross monthly income, so the sample's $2,647 against $8,000 reads 33.1 percent. The workbook reports it as a plain ratio and deliberately does not measure it against any threshold or pass-fail line. Lenders and budgeting guides cite various housing-cost ratios, but they differ by method and situation, so the file leaves the number on the dashboard for you to read rather than judging it.
Why does the annual cost on the dashboard differ from the tracked total?
They measure two things. Total Annual Cost, $31,764, is the Home Details estimate: this month's projected cost multiplied by twelve, using a flat monthly maintenance budget. YTD Spent, $31,344, is the sum of what you actually logged in Monthly Tracking, where maintenance shows up as real repairs and improvements in the months they happened. The estimate plans the year; the log records it, and the small gap between them is exactly the point of tracking.
Does this replace budgeting or accounting software?
It is a focused home-cost workbook, not a general budget or a ledger. It does not connect to your bank, categorize transactions automatically, or track income beyond the single figure used for the housing ratio. What it does is lay every home cost, repair, and reserve figure out as editable cells you can see and change. For a whole-household budget a budgeting template fits better; this one specializes in the cost of the house itself.
Sources
- Buying a house: Tools and resources for homebuyers - Consumer Financial Protection Bureau
- What is an escrow or impound account? - Consumer Financial Protection Bureau
About this article
Every figure, sheet name, column, formula, dropdown, chart type and conditional format checked on 2026-09-10 against the shipped Home Expense Calculator Ultimate workbook (Dashboard, Home Details, Monthly Tracking, Maintenance Log, Budget vs Actual, Repair Reserve, How to Use), with the free and Essentials workbooks checked for the tier comparison. Consumer Financial Protection Bureau references on buying a home and escrow accounts rechecked against the live CFPB pages on 2026-09-10. Last reviewed September 2026.