
A common guideline keeps total transportation costs, meaning the payment plus insurance, fuel, and maintenance, under 10-15% of gross monthly income. On an $80,000 salary that leaves roughly $430 a month for a payment, which finances a car around $22,000 with money down. The stricter 20/4/10 rule (20% down, a 4-year term, 10% of income for all car costs) usually points to a used car.
There is a moment in car shopping when the salesperson says, “What monthly payment are you comfortable with?” It sounds helpful. It is not. Any car can look affordable when you stretch the loan to 72 months. The question obscures the one that matters: what is the total cost, and does it fit the rest of your financial life?
Working through the math before setting foot on a lot changes the entire experience. The Car Affordability Calculator helps figure out what fits based on your income and budget. No signup required.
Start With the Budget, Not the Car
The conventional approach is to find a car you like and then figure out if you can afford it. The smarter approach is the reverse: determine what you can spend, then shop within that range.
Here is the process. Take gross monthly income. Set aside 10-15% for total transportation, not just the payment but insurance, fuel, maintenance, everything. Subtract the non-payment costs, and what remains is the maximum car payment.
For context, transportation already averages about 17% of household spending, the second-largest category after housing. The 10-15% target is a tighter version of that, and it treats the car as its full running cost rather than a single line on a finance contract.
Example on an $80,000 salary ($6,667/month gross):
Total transportation budget at 12%: $800/month. Insurance: $160. Fuel: $130. Maintenance: $80. Available for car payment: $430.
At $430/month with 6% interest over 48 months, the maximum loan is about $18,300. Add a $4,000 down payment: that is a car around $22,300.
That number surprises a lot of people. It feels low. But it includes room for every car-related expense, not just the financing.
The 20/4/10 Rule
A stricter framework, popular in personal finance circles:
- 20% minimum down payment
- 4 year maximum loan term
- 10% of gross income maximum for all transportation costs
On a $75,000 salary ($6,250/month gross), 10% means $625/month total. After insurance ($150), gas ($120), and maintenance ($80), that leaves $275 for a payment. A $275/month payment at 6% for 4 years finances roughly $11,700. With 20% down: a $14,600 car.
The 20/4/10 rule is conservative by design. Following it to the letter probably means buying used. And that is partly the point: it accounts for the full cost of ownership, not just the sticker price.
The Invisible Cost: Depreciation
The monthly payment is visible. Depreciation is not. But it is often the largest cost of owning a newer car.
A $35,000 new car depreciates roughly like this:
| Year | Value | Lost That Year | |------|-------|----------------| | 0 | $35,000 | - | | 1 | $28,000 | $7,000 | | 2 | $24,500 | $3,500 | | 3 | $21,500 | $3,000 | | 5 | $17,500 | ~$2,000/year |
That first-year loss of $7,000 is $583/month in vanished value. Nobody sends you a bill for it, but the money is gone. By year three, the car has lost $13,500, and someone buying it at that point skips the steepest depreciation entirely.
This is the core financial argument for buying a two-to-three-year-old car. The first owner absorbed the largest value drop. From that point forward, depreciation is gentler.
New cars do offer advantages: full warranties, lower initial maintenance, sometimes better financing rates. But the depreciation math is hard to ignore.
What a Car Really Costs Per Year
Here is the total ownership picture across different vehicle categories:
| Annual Cost | Economy Car | Mid-Range Sedan | SUV/Luxury | |------------|------------|----------------|------------| | Depreciation | $2,500 | $4,500 | $7,000+ | | Insurance | $1,500 | $2,000 | $2,800+ | | Fuel | $1,500 | $2,000 | $2,800+ | | Maintenance | $800 | $1,200 | $1,800+ | | Registration/taxes | $300 | $400 | $600+ | | Total | $6,600 | $10,100 | $15,000+ | | Monthly | $550 | $842 | $1,250+ |
A mid-range sedan costs roughly $10,000 a year to own. That includes costs the monthly payment does not cover: depreciation, fuel, and maintenance add up regardless of how the purchase was financed.
The Loan Term Trap
Longer terms lower payments but increase total cost and create risk:
$25,000 loan at 6%:
| Term | Monthly Payment | Total Interest | |------|----------------|---------------| | 36 months | $760 | $2,380 | | 48 months | $587 | $3,182 | | 60 months | $483 | $3,999 | | 72 months | $414 | $4,831 |
The 72-month loan saves $346/month compared to 36 months but costs about $2,450 more in interest over the life of the loan. Worse, longer loans frequently leave buyers owing more than the car is worth for the first several years. The CFPB found that borrowers who financed negative equity were more than twice as likely to have the account assigned to repossession within two years as borrowers with a positive-equity trade-in. If the car is totaled or needs to be sold, the owner covers the difference between the loan balance and the car’s value out of pocket.
A useful rule of thumb: if a 48-month loan produces an unaffordable payment, the car probably costs more than fits comfortably in the budget.
Before You Shop
Get pre-approved. Knowing the rate and maximum loan amount before visiting a dealer prevents the conversation from starting with “What payment works for you?” It also provides leverage, since the dealer knows you can walk away.
Budget the total price, not the payment. Dealers can make any car look affordable by extending the term. The CFPB makes the same point in its guidance on car affordability: look at the full cost, not the monthly figure. Focus on the out-the-door number including sales tax and fees (typically 7-12% above sticker, depending on location).
Account for the transition. If there is a current car to sell or trade, its value offsets the new purchase. If there is an existing loan to pay off, that balance carries forward.
The Monthly Budget Template helps see how a car payment fits alongside every other expense. Viewing transportation costs in isolation is how car budgets go sideways, since the full monthly picture is where reality shows up.
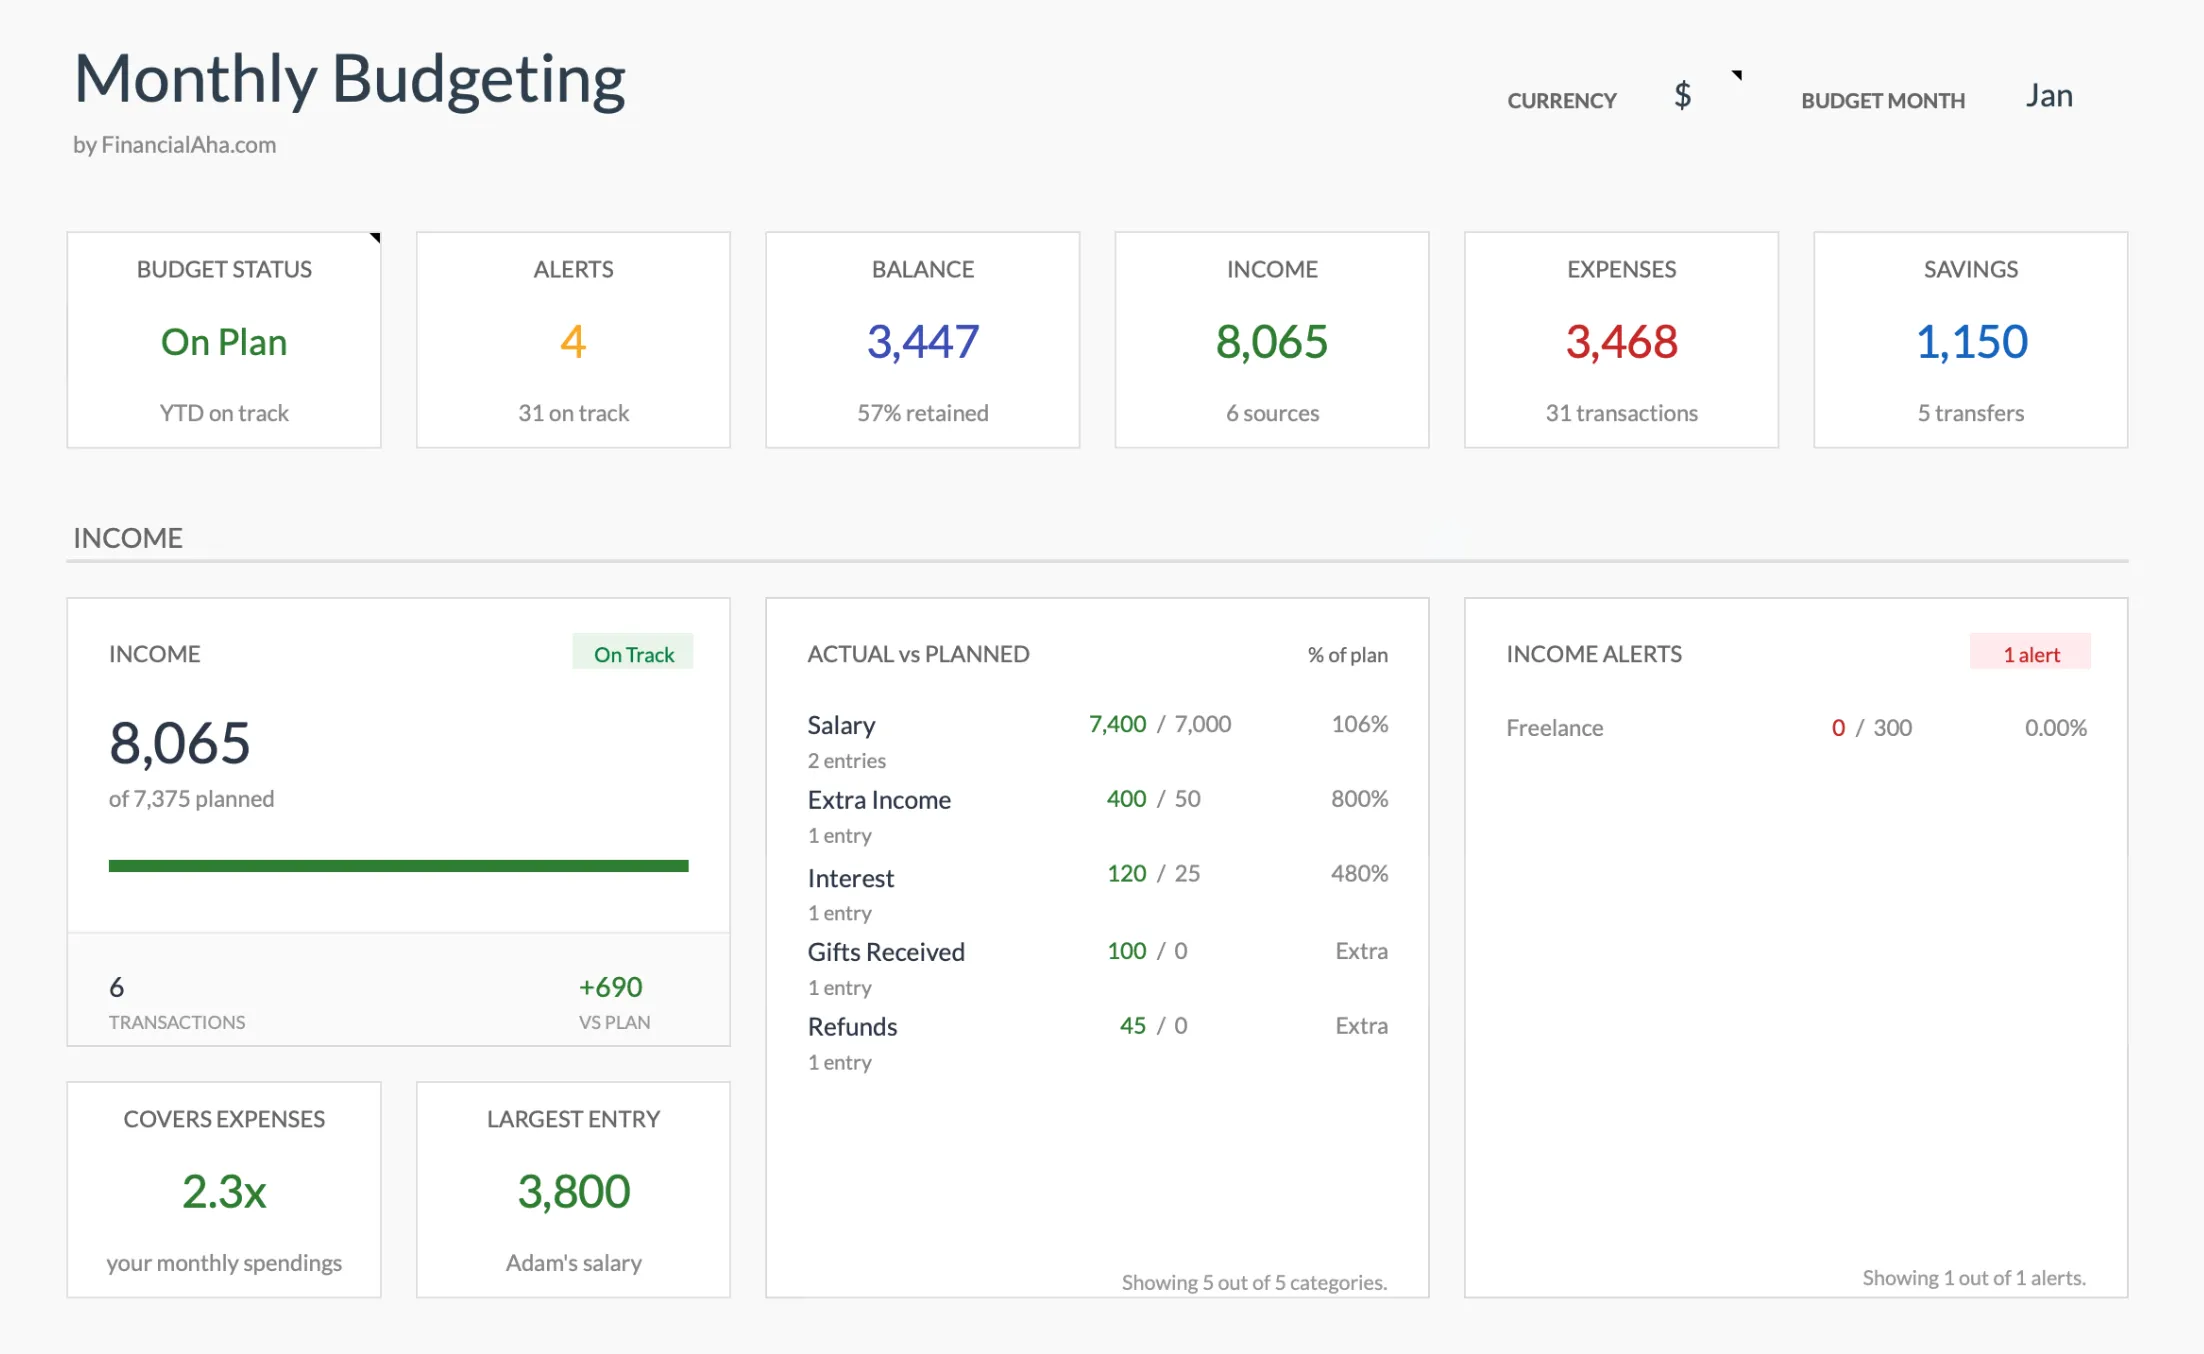
The Monthly Budgeting template (Premium) rolls income, expenses, and savings into one view, so a new car payment lands next to everything else it competes with.
More on Car Costs
- Lease vs. Buy Car Calculator - Compare the total cost of leasing versus buying for your situation
- Auto Loan Payoff Calculator - See how extra payments can shorten your auto loan and save on interest
Related
Frequently asked questions
What's the 20/4/10 rule for cars?
Put 20% down, finance for no more than 4 years, and keep total transportation costs (payment, insurance, gas, maintenance) under 10% of gross income.
Does car affordability mean more than the loan payment?
Yes. A workable number covers everything transportation costs you: the payment, insurance, fuel, and maintenance. The BLS puts transportation at about 17% of the average household budget, the second-largest category after housing, so the payment alone understates what a car takes from the rest of your money.
Should I buy new or used?
Used cars avoid the steepest depreciation, which lands mostly in the first year or two. A 2-3 year old vehicle skips that first drop, though a new car carries a full warranty and lower early maintenance. The trade-off is worth weighing for your own situation.
Is leasing cheaper than buying?
Monthly lease payments are typically lower, but you own nothing at the end. Buying costs more monthly but builds equity. The Lease vs. Buy Calculator can compare your specific options.
What if I owe more on my trade-in than it's worth?
That gap is negative equity, and rolling it into the next loan starts you further underwater. The CFPB found borrowers who financed negative equity were more than twice as likely to have the loan assigned to repossession within two years as borrowers with a positive-equity trade-in, so it is worth knowing the payoff balance and the trade-in value before signing.
Sources
- Consumer Expenditures in 2024 - U.S. Bureau of Labor Statistics
- How much can I afford to borrow for a car or auto loan? - Consumer Financial Protection Bureau
- Negative Equity Findings from the Auto Finance Data Pilot - Consumer Financial Protection Bureau
About this article
Transportation's share of household spending is checked against the Bureau of Labor Statistics Consumer Expenditure Survey. Loan payment and interest figures are recalculated from standard amortization at the rates and terms shown; negative-equity risk is drawn from the Consumer Financial Protection Bureau. Calculator and template claims checked on 2026-09-10 against the Car Affordability Calculator component on this site and the shipped Monthly Budgeting Google Sheet (Summary and Budget Plan tabs). Last reviewed September 2026.