
The NRF's 2025 survey puts K-12 back-to-school spending at $858 per family and college at $1,326, with electronics the largest category in both. A back-to-school budget template separates K-12 from college, splits each into supplies, clothing, tech, fees, and dorm setup, and tracks planned vs actual per child. That per-child column is what surfaces where the year-over-year increase really comes from, usually a tech-replacement year or a first-month dorm run.
Late July is when the bulk of the buying happens. Lists arrive from the school. Backpacks get tried on. Tax-holiday weekends start landing. For families with more than one kid, or a college freshman in the mix, the spend stacks fast and the line items blur together. A spreadsheet that names the categories before the first cart goes in is how families spot the year-over-year drift while they still have time to react.
Why back-to-school deserves its own template
Back-to-school is not one purchase. It is supplies, clothing, shoes, electronics, fees, and (for college) a full dorm setup, compressed into about six weeks. The NRF 2025 survey breaks K-12 family spending down like this:
| K-12 category | Average per family (2025) |
|---|---|
| Electronics | $295.81 |
| Clothing and accessories | $249.36 |
| Shoes | $169.13 |
| School supplies | $143.77 |
| Total | $858.07 |
College families ran higher at $1,325.85 on average, with electronics at $309.50, dorm or apartment furnishings at $191.39, clothing at $166.07, food at $140.24, and personal care at $117.95.
Two things in those numbers explain why a template helps. First, supplies is the smallest dollar category in both K-12 and college - but supplies is the one parents see in writing from the school. Electronics and clothing each cost roughly 2x supplies; they show up without a printed list. Second, the per-family average masks wide swings: a tech replacement year for one child can easily double the K-12 total, and a no-replacement year cuts it in half.
The article on budget categories most people forget covered why lumpy, predictable expenses get under-budgeted. Back-to-school sits squarely in that group.
K-12 and college: structured differently
K-12 and college have overlapping categories but different shapes. A template that combines them into one list ends up wrong on both sides.
| Category | K-12 typical | College typical |
|---|---|---|
| Supplies (paper, folders, pencils) | $80 to $200 per child | $50 to $150 |
| Books and curriculum | $0 to $80 (school-provided in many districts) | $300 to $1,200 (textbooks vary widely by major) |
| Clothing and shoes | $250 to $500 per child | $150 to $300 |
| Electronics | $0 to $1,200 (replacement years only) | $300 to $1,400 (laptop, phone, accessories) |
| Fees (lab, activity, sports, club) | $50 to $400 per child | $100 to $800 |
| Transport (bus pass, parking, gas) | Often free / district | $100 to $600 per semester |
| Dorm or apartment setup | n/a | $200 to $800 first year |
| Personal care, food, discretionary | n/a (folded into household) | $200 to $500 first month |
A K-12 sheet has rows per child. A college sheet has rows per student with a heavier dorm and books section. The two work as separate tabs in the same workbook, with a summary pulling totals through.
K-12 budget categories in detail
Five rows do the work for most K-12 families.
- Supplies. Paper, folders, pens, pencils, a backpack if last year’s is worn out, lunch boxes, a planner. The per-child supply list from the school is the starting point, and the school supplies spreadsheet breaks that list into per-child rows with a have-on-hand and to-buy column. Costs scale with grade: kindergarten ($40 to $80) is lighter than middle school ($100 to $200), which carries lab notebooks, scientific calculator, and similar.
- Clothing and shoes. The category with the widest spread. Some families do a uniform-only refresh ($100 to $200); others do a full wardrobe ($400 to $700 per child). Shoe replacements alone average $169 per K-12 family in the NRF data.
- Electronics. The largest single category, even though it is irregular. A Chromebook, tablet, or laptop in the year it gets replaced runs $300 to $1,200. Many families have zero electronics spend in non-replacement years.
- Fees and activities. Lab fees, sports registration, instrument rental, club dues, field trip deposits. These arrive in waves from August through October. A $50 fee per kid x three kids x five activity buckets is $750 that no one budgeted for.
- Transport. Usually small for K-12 (bus is district-funded in most places), but worth a line for gas to drop-offs, parking passes for high-schoolers driving, and any non-school transportation to activities.
A simple layout: one row per child, columns for each category, plus planned, actual, and variance at the right.
| Child | Supplies | Clothing | Electronics | Fees | Transport | Planned | Actual | Variance |
|---|
A totals row at the bottom. The variance column drives the late-September conversation about which category drifted.
College budget categories in detail
College adds two categories and changes the shape of two more.
- Books and curriculum. Textbooks vary wildly by major. STEM and law-track classes can run $200 to $400 per book; humanities can run $30 to $80. Renting, used, and digital editions can cut the total 40 to 70 percent versus new. The college bookstore tends to be the most expensive option. A separate line per class is overkill; one total with a notes column for “rent vs buy vs digital” is enough.
- Dorm or apartment setup. First-year dorm is the heaviest at $200 to $800 (bedding, storage, lamp, fan, small fridge if allowed). Second year drops sharply unless moving into a first apartment, where furniture and kitchen setup spike again.
- Electronics. Heavier than K-12. The NRF average of $309 reflects ongoing costs (accessories, software); a laptop year easily adds $800 to $1,400.
- Personal care, food, and discretionary first-month. Move-in week tends to be the most expensive month of the semester. Restocking a dorm fridge, first-week meals out, basic toiletries, and dorm-room essentials forgotten on the packing list each add up.
This template is for the start-of-semester spend - supplies, books, dorm setup, electronics, clothing, and the discretionary first month. Tuition, room and board, and health insurance live in a separate education budget, typically tracked annually rather than per semester. The college savings calculator covers the long-arc planning side.
The per-child breakdown that catches the overspend
The single most useful column is “per child.” A three-child K-12 household and a one-child household with the same headline total are not the same situation.
A worked example for August 2026, two K-12 kids and one college freshman:
| Line | Kid A (3rd grade) | Kid B (8th grade) | Kid C (college, freshman) | Total |
|---|---|---|---|---|
| Supplies | $90 | $180 | $80 | $350 |
| Clothing and shoes | $280 | $320 | $200 | $800 |
| Electronics | $0 (no replacement) | $450 (new tablet) | $1,100 (laptop) | $1,550 |
| Books | $0 | $0 | $580 | $580 |
| Fees | $120 | $260 | $300 | $680 |
| Dorm setup | n/a | n/a | $620 | $620 |
| Transport | $0 | $0 | $180 | $180 |
| First-month discretionary | n/a | n/a | $380 | $380 |
| Total per child | $490 | $1,210 | $3,440 | $5,140 |
The per-child column surfaces three things the household total hides: middle school is roughly 2.5x elementary, college is roughly 3x middle school, and the tech and dorm lines drive most of the spread.
State sales-tax holidays
Many states run a sales-tax holiday on school supplies, clothing, and sometimes electronics in late July or early August. As of 2025, 17 states held one. Eligible items, dollar caps per item, and dates vary. A few patterns:
- Dates cluster late July to mid-August. Most fall on a Friday-through-Sunday weekend.
- Clothing caps are common. Many states exempt clothing under $100 per item; some go up to $125.
- Electronics rules vary the most. Some states include laptops and tablets under a cap (often $750 to $1,500); most do not.
State revenue department pages have the current rules. The Federation of Tax Administrators maintains a running list of state holidays for the year. A “tax-eligible?” column added to the budget flags which planned purchases line up with the holiday window for your state, so the question of whether to buy this weekend or next has a price tag attached.
A worked check: a $1,150 college-year-one bundle in a state with 6.5 percent sales tax and a holiday weekend skips roughly $75 in tax if every item qualifies. Cap rules decide the rest - a $900 laptop that exceeds a $750 cap pays full tax on the whole price in some states, just the overage in others.
Planned vs actual, year over year
The template’s most useful feature is the side-by-side planned and actual columns. The first year, planned numbers are guesses. By year two, they are calibrated. By year three, they tend to land within 10 percent.
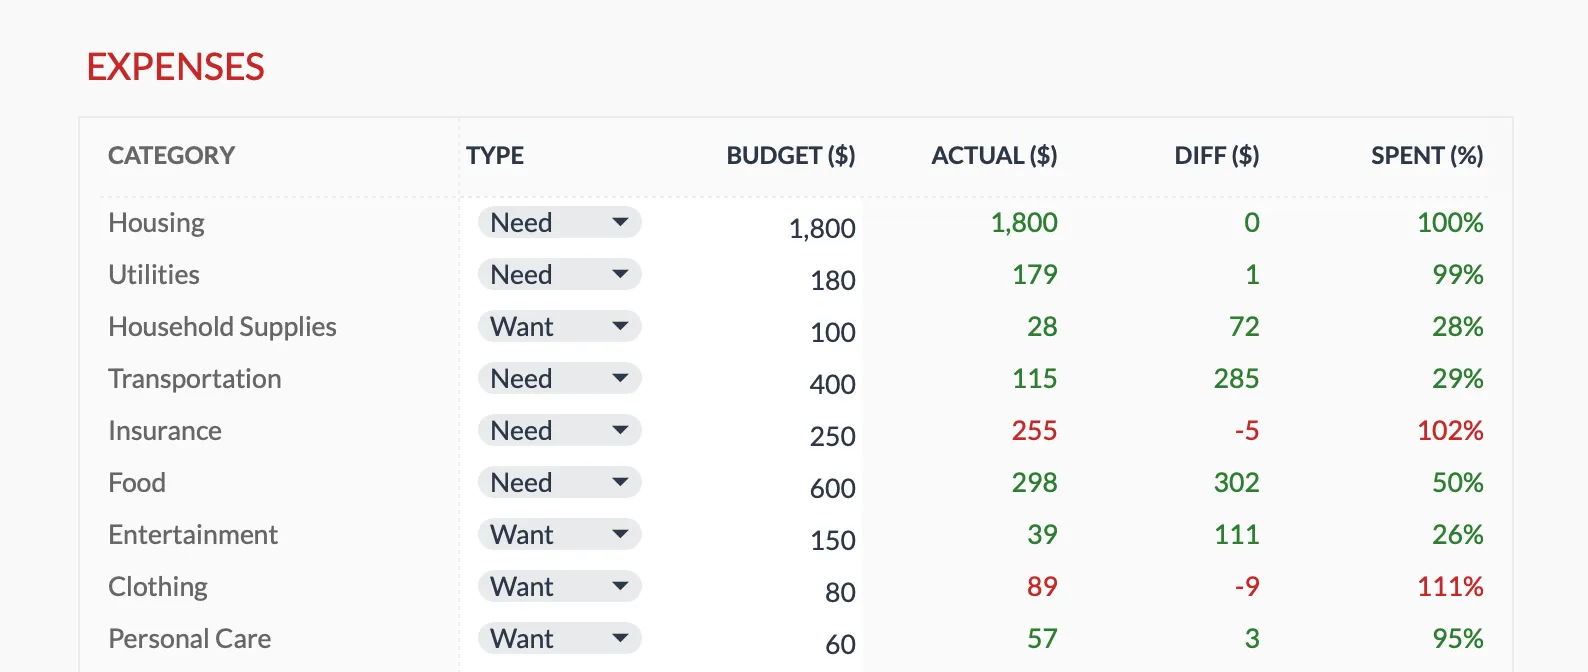
Monthly Budgeting (Premium tier) runs the same planned-vs-actual engine a back-to-school sheet needs. Its Budget Plan sheet holds a budget column you type, the actual spend totalled beside it from the Transactions sheet, and the difference and percent-spent that drive the variance review.
Three places where year-one actuals usually exceed year-one plans:
- Electronics. A “replacement year” sneaks up. The household estimates the old laptop will hold; it does not.
- Fees and activity sign-ups. The school sends the list of forms in August and September. Each one is small; together they outrun the supplies line.
- First-month college discretionary. Restocking, first-week meals, dorm essentials forgotten on the list. Often 30 to 50 percent over plan in year one.
A 3-line post-summer note (what we paid, what surprised us, what we’d change) saved with the spreadsheet surfaces again next July when planning starts. By the time a kid has gone through two or three back-to-school cycles, the per-child numbers stabilize and the variance row tells you which category drifted.
The early-July vs late-August buying split
The NRF reported two-thirds of families had begun back-to-school buying by early July 2025, up from 55 percent in 2024. Earlier shopping spreads the spend across paychecks and front-runs the tax-holiday and store sales, but it also locks in purchases before school lists are final.
Three patterns families settle into:
- Early-July anchor buying. Backpack, clothes, shoes - items that do not depend on a teacher’s specific supply list. Spreads the spend; uses summer sales.
- Tax-holiday weekend. Mid- to late-July or early-August. The most-discounted window in many states. Fits the clothing and electronics lines if they qualify under the state’s caps.
- Late-August school-list buying. Specific supplies, lab fees, activity sign-ups. Has to wait for the school’s list and the activity catalog.
A planned column with target purchase windows (“early-July,” “tax-holiday,” “late-August”) keeps the buying paced. Tax-holiday eligibility and sale timing can swing the same cart’s actual cost noticeably between an all-at-once August run and a paced one.
Common overspend traps
Three places where families consistently overspend, drawing from NRF year-over-year tracking and the same patterns covered in our summer camp cost piece:
- Tech replacement creep. A laptop is “fine” until it suddenly is not, in the second week of school. Households that mark a rough replacement cadence in the spreadsheet (some pick 4 years for a laptop, 5 for a tablet) catch this as a known year rather than a surprise.
- Brand-name clothing in early grades. Lower grades see the biggest brand premium gap (older kids reuse and self-select more). The variance column surfaces this within a year.
- Dorm-setup impulse buys. Move-in weekend is when the small purchases stack: a $40 shower caddy, $25 desk lamp, $30 of hooks, $50 of decor. The dorm setup line often runs 50 percent over plan in year one.
The fix is the same in all three: a planned number per category, written down before the cart goes in, and a quick post-purchase reconciliation. The template does the math; the household decides the threshold.
Which template to start from
Back-to-school spend lives at the intersection of monthly budgeting (the spread shows up in August’s variance) and household-level annual planning, a once-per-year category. Templates that fit:
- Monthly Budgeting - For seeing where the back-to-school surge lands inside August’s overall household spending. It covers a single month, with budget, actual, difference and percent-spent columns per category on the Budget Plan sheet.
- Household Budget (free) - Two income rows and family-friendly categories such as Childcare / School and Family Activities, budgeted and actual side by side for one month. Spare blank rows sit under the sample categories, so a back-to-school line, or one line per child, can go straight in.
- Monthly Expense Tracker - If the household has no budget at all and August is the wake-up call, this is the simplest starting point. Track first, plan next year.
The free Household Budget is a spreadsheet file that opens in Excel, Google Sheets, or LibreOffice Calc, with no macros and no sign-up. The two paid templates are Google Sheets files, and each is a one-time purchase rather than a subscription.
Related
Frequently asked questions
What does back-to-school cost on average?
The National Retail Federation's 2025 survey put K-12 spending at $858.07 per family and college spending at $1,325.85 per family. Electronics was the largest category in both. Expect wide variance by grade, location, and whether tech is a replacement year.
Where do families typically overspend?
Tech (especially laptop or tablet replacements), brand-name clothing in early grades, and dorm-setup impulse buys at the start of college. A planned-vs-actual column, which the Monthly Budgeting template runs on, flags these the second time around.
What about tax-free shopping holidays?
Many states hold a sales-tax holiday on school supplies, clothing, and sometimes electronics in late July or early August, with eligible items and dollar caps that vary by state. Adding a 'tax-eligible?' column to the budget lets you line up planned purchases with your state's holiday window.
How do I budget before the school supply list arrives?
One approach is to anchor early-July buying on items that do not depend on a teacher's list, such as backpacks, clothing, and shoes, then hold a supplies line open for the late-August list. Splitting the planned column into purchase windows keeps the two from colliding.
What if I have kids at different schools with different lists?
A row per child keeps each list, fee schedule, and grade-level cost separate, while a totals row still rolls them into one household number. That per-child split is what stops one child's tech-replacement year from hiding inside the family average.
Does this template cover college tuition?
No, tuition is its own line in the annual budget. This template covers supplies, books, clothing, tech, dorm setup, and discretionary spending at the start of the semester. Tuition and room and board are typically tracked in a separate education budget.
Sources
- Back-to-School Season Begins Early for Majority of Shoppers - National Retail Federation
- Sales Tax Holidays - Federation of Tax Administrators
About this article
Spending averages and category breakdowns checked against the National Retail Federation's 2025 back-to-school survey. State sales-tax-holiday details checked against the Federation of Tax Administrators' holiday list. Product features checked on 2026-09-10 against the shipped Monthly Budgeting Google Sheet (Budget Plan and Transactions tabs) and the free Household Budget workbook. Last reviewed September 2026.