免费 租房与买房对比计算器 电子表格模板
在指定时间段内比较租房和买房的财务结果。考虑升值、税务影响和机会成本。

包含内容
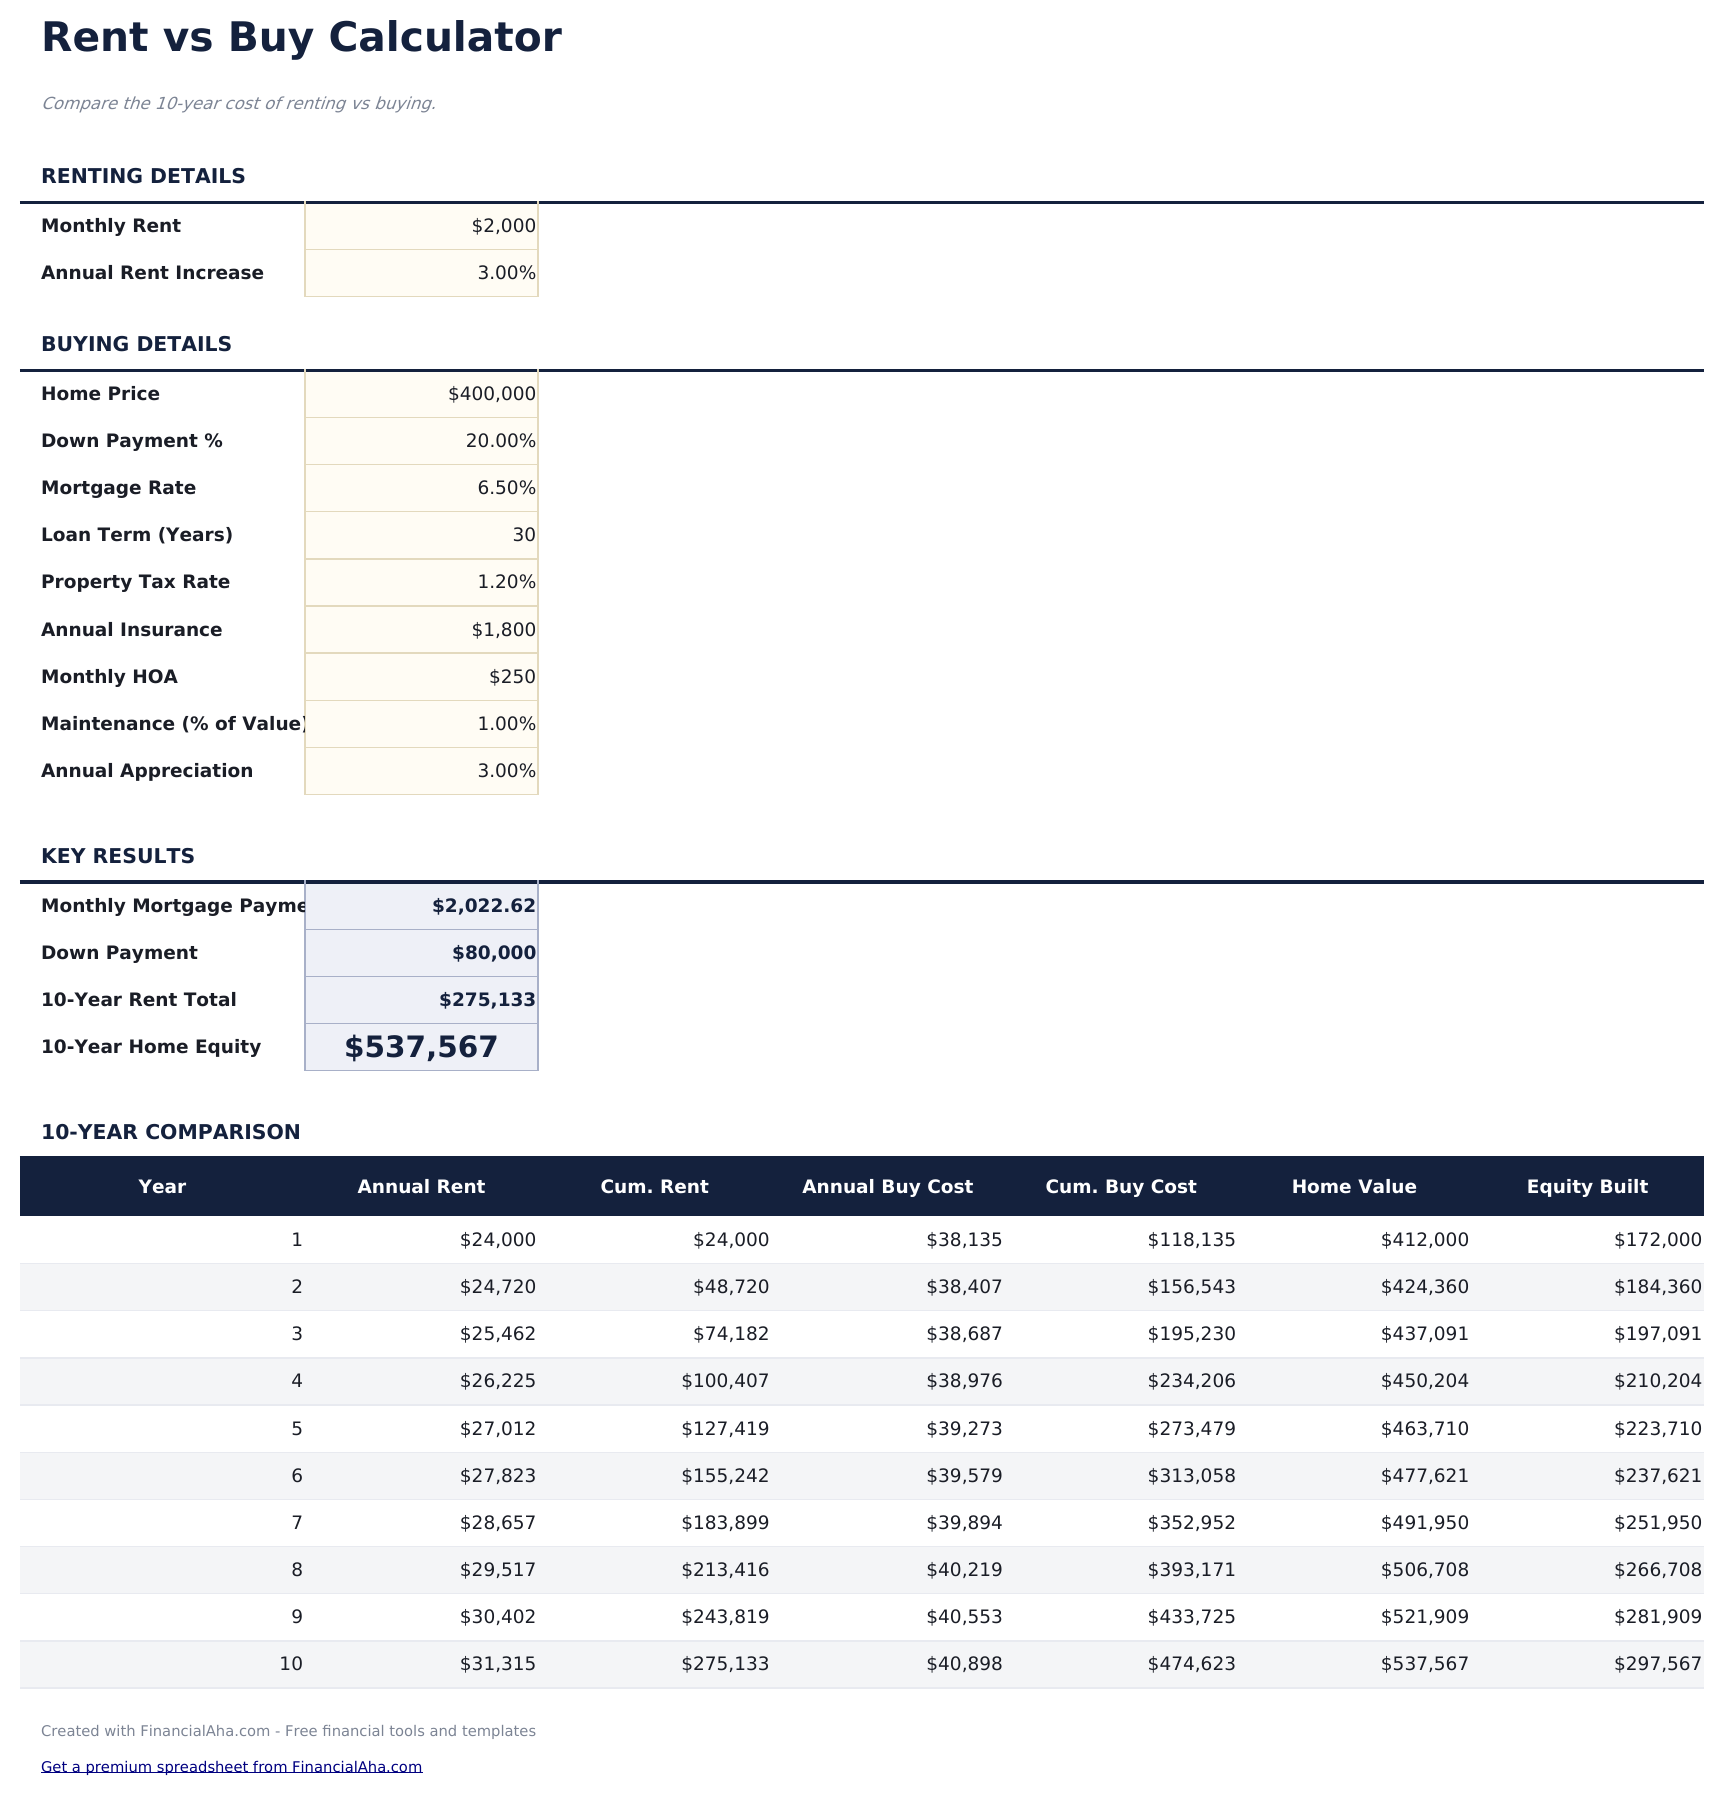
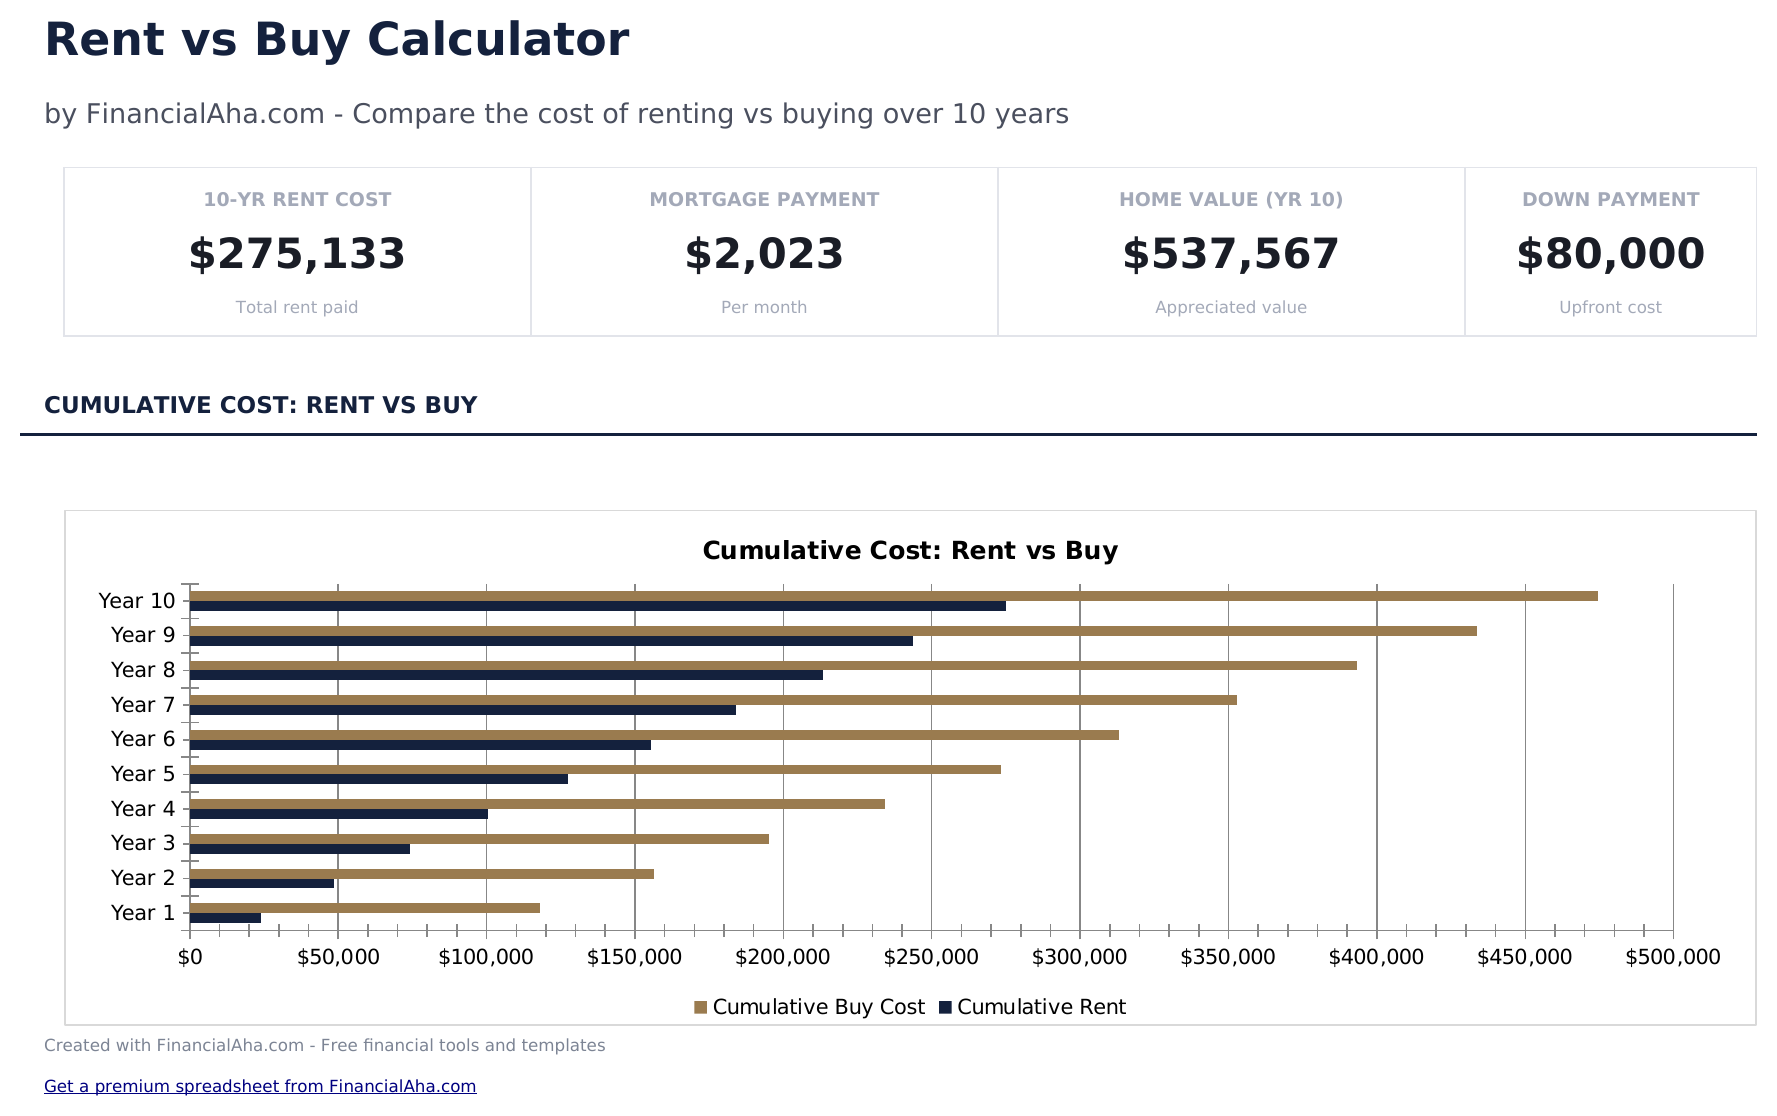
- 仪表盘显示租房与买房对比,包括租房总成本、买房总成本和净差额
- 计算器包含租房输入(月租金、年涨幅)和购房输入(价格、利率、首付款)
- 逐年成本对比表,显示累计已付租金与累计住房成本的对比
- 净值积累跟踪,显示每年通过房贷本金还款积累了多少房屋净值
- 盈亏平衡分析,带色彩编码的输入单元格,显示买房何时变得比租房更划算
- 适用于 Microsoft Excel、Google Sheets 和 LibreOffice Calc,无需任何设置
Pro 版本可用
需要此模板的更多功能?
免费版本涵盖基础功能。Pro 版本提供更多。
免费
- 包含关键假设的基础租房与购房对比
- 仪表盘显示月度成本对比和5年摘要
- 房屋净值和净成本计算
- 适用于 Excel 和 Google Sheets
Pro
- 全面的假设表,涵盖购买价格、首付、房贷利率、房产税率、物业费、维护费、房屋增值率、租金、租金涨幅和投资回报率
- 仪表盘包含6个KPI卡片:盈亏平衡年份、10年购房成本、10年租房成本、购房净优势、月供与租金对比和所需首付
- 逐年对比表,显示10年内购房与租房的累计成本及每年净差额
- 盈亏平衡分析,确定购房在累计基础上变得比租房更便宜的确切年份
- 敏感性分析网格,显示5种房屋增值率与5种房贷利率交叉下的盈亏平衡年份(25种组合)
查看 Pro 版本包含的内容› 一次性购买。无需订阅。
预览
查看此模板的内容
如何使用这个租房与买房对比计算器模板
1
输入租房详情
输入当前月租金和对比期间内的预期年租金涨幅百分比。
2
输入购房详情
添加房价、首付款、房贷利率、房产税、保险和预估维护费用。
3
设定时间跨度
输入对比的年数。不同持有期限的结果差异很大。
4
比较结果
仪表盘显示租房总成本与买房总成本、积累的净值和盈亏平衡年份。
由 Claude AI 构建,经我们精心打磨。
我们使用 Claude AI 在深入研究后起草每个模板。然后由团队接手,优化布局、全面测试每个公式、修复边界情况,并打磨设计,直到达到我们自己愿意使用的标准。AI 完成了 80% 的工作,最后 20% 靠的是人工判断。
常见问题
买房方包含哪些费用?
房贷还款、房产税、保险、维护、HOA费用和首付款的机会成本。净值积累作为抵扣项。
是否考虑了房屋升值?
是的。输入预期年升值率。计算器在计算买房净成本时会考虑房产价值增长。
首付款的机会成本是什么?
如果首付款用于投资而非购房,它将产生收益。计算器考虑了这部分放弃的投资增长。
买房通常何时达到盈亏平衡?
因市场和输入条件而异。盈亏平衡分析显示在您的场景中,累计买房成本低于累计租房成本的具体年份。
如何在 Google Sheets 中打开?
将 .xlsx 文件上传到 Google Drive,然后使用 Google Sheets 打开。所有公式和格式都会保留。
此模板使用什么许可证?
所有免费模板均采用 CC BY 4.0(知识共享署名)许可证发布。您可以自由使用、修改和分享,包括用于商业用途,只需注明来源为 FinancialAha.com。模板按原样提供,不构成财务建议。