Retirement Planning Template
Retirement Planning Template for Retirees
One retirement planning template you set up around a portfolio you are already living on, with the withdrawal rate reported for every year and three return scenarios run side by side.
In Depth
Withdrawal Rates and the Math of Making Savings Last
The transition from accumulating wealth to spending it down represents a fundamental shift in financial thinking. During working years, the goal is growth. In retirement, the goal becomes sustainability, which means making the money last as long as it is needed. The commonly referenced 4% rule provides a starting point, but individual circumstances such as health, lifestyle, other income sources and market conditions can make the right withdrawal rate higher or lower for any given person.
Required Minimum Distributions add a forced element to retirement withdrawals that many retirees do not anticipate. Once traditional IRA and 401(k) accounts reach the required beginning date, the IRS mandates annual withdrawals based on account balance and life expectancy. These distributions are taxable income and can push retirees into higher brackets, increase Medicare premiums through IRMAA surcharges, and make more Social Security income taxable. Planning around RMDs, including potential Roth conversions in the years before they begin, is where organized tracking proves especially valuable.
Social Security timing is one of the most consequential decisions retirees face. Claiming before full retirement age permanently reduces the monthly benefit, by as much as 30% at age 62 for those with a full retirement age of 67, while each year of delay past full retirement age earns delayed retirement credits of 8% per year up to age 70. For someone whose full retirement age benefit is $2,500 per month, the gap between claiming at 62 and at 70 is roughly $1,400 per month for life. The claiming age that fits depends on health, other income, spousal benefits, and how long savings need to last, all of which are clearer when the full financial picture is organized in one place.
The Challenge
Why Active Retirement Planning Does Not Stop at Retirement
Reaching retirement is not the finish line for financial planning - it is a transition to a different kind of planning. Managing withdrawals, adapting to market conditions, and planning for decades of living requires ongoing attention.
The withdrawal rate decides how long money lasts
How much you draw each year, measured against returns and inflation, is the biggest driver of portfolio longevity. Seeing different rates projected over decades makes the trade-off concrete.
Market conditions in early retirement matter most
Sequence of returns risk means that poor market performance in the first few years of retirement has a disproportionate impact on long-term portfolio survival.
Healthcare costs are the biggest unknown
Medicare coverage gaps, supplemental insurance costs, prescription expenses, and potential long-term care create a category of spending that is difficult to predict and impossible to ignore.
Inflation erodes purchasing power over decades
A 3% annual inflation rate means your dollar buys half as much in 24 years. Retirement plans that ignore inflation paint an unrealistically optimistic picture.
Ready to take control of your retiree finances?
What You Get
Retirement Planning Features for Current Retirees
Income and spending timeline
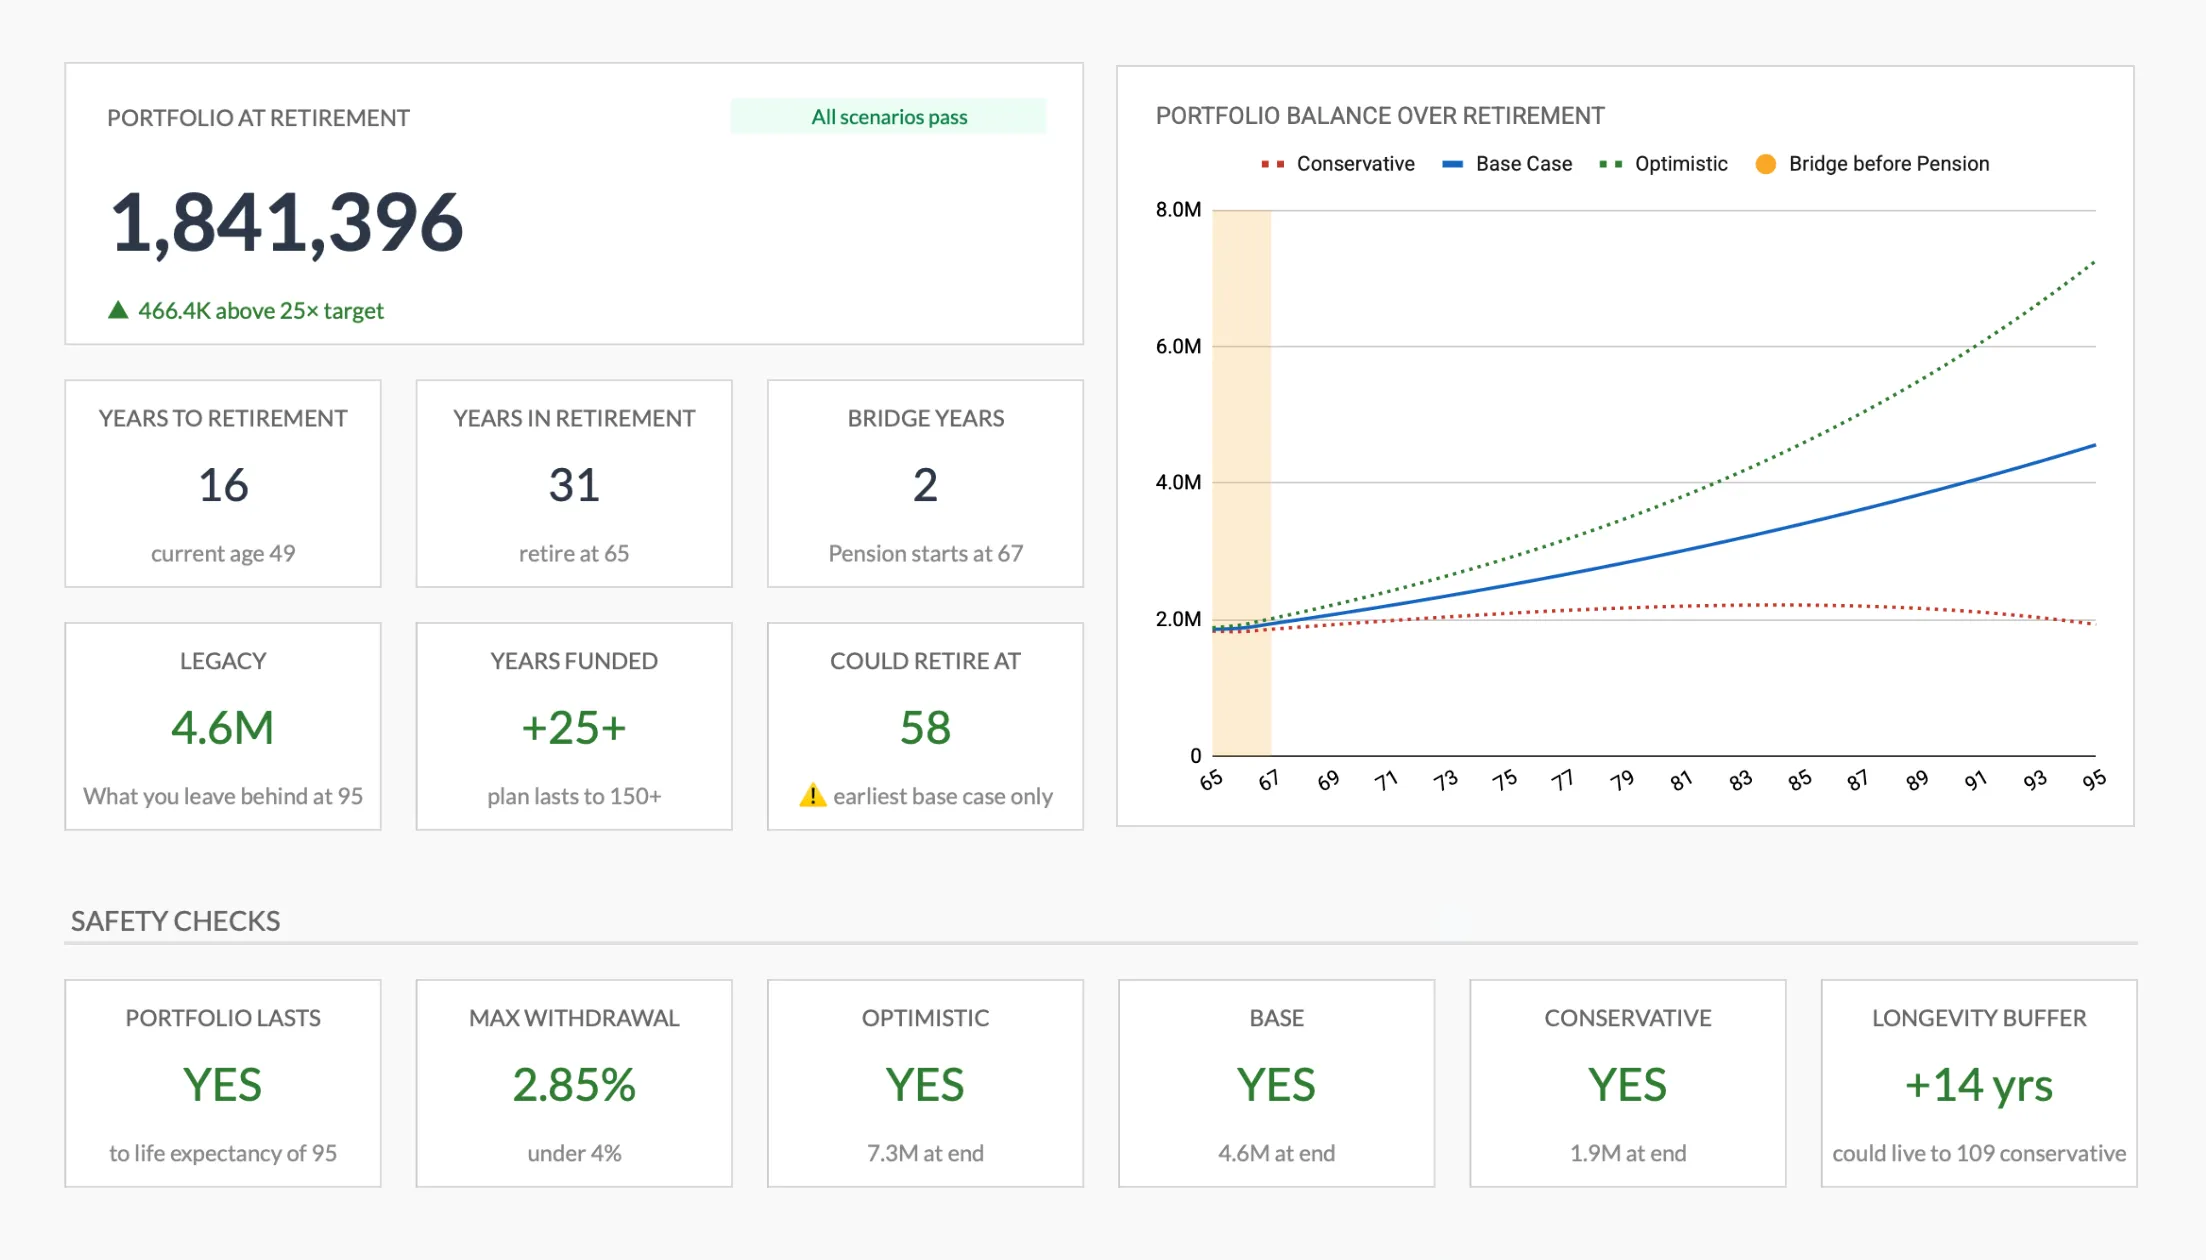
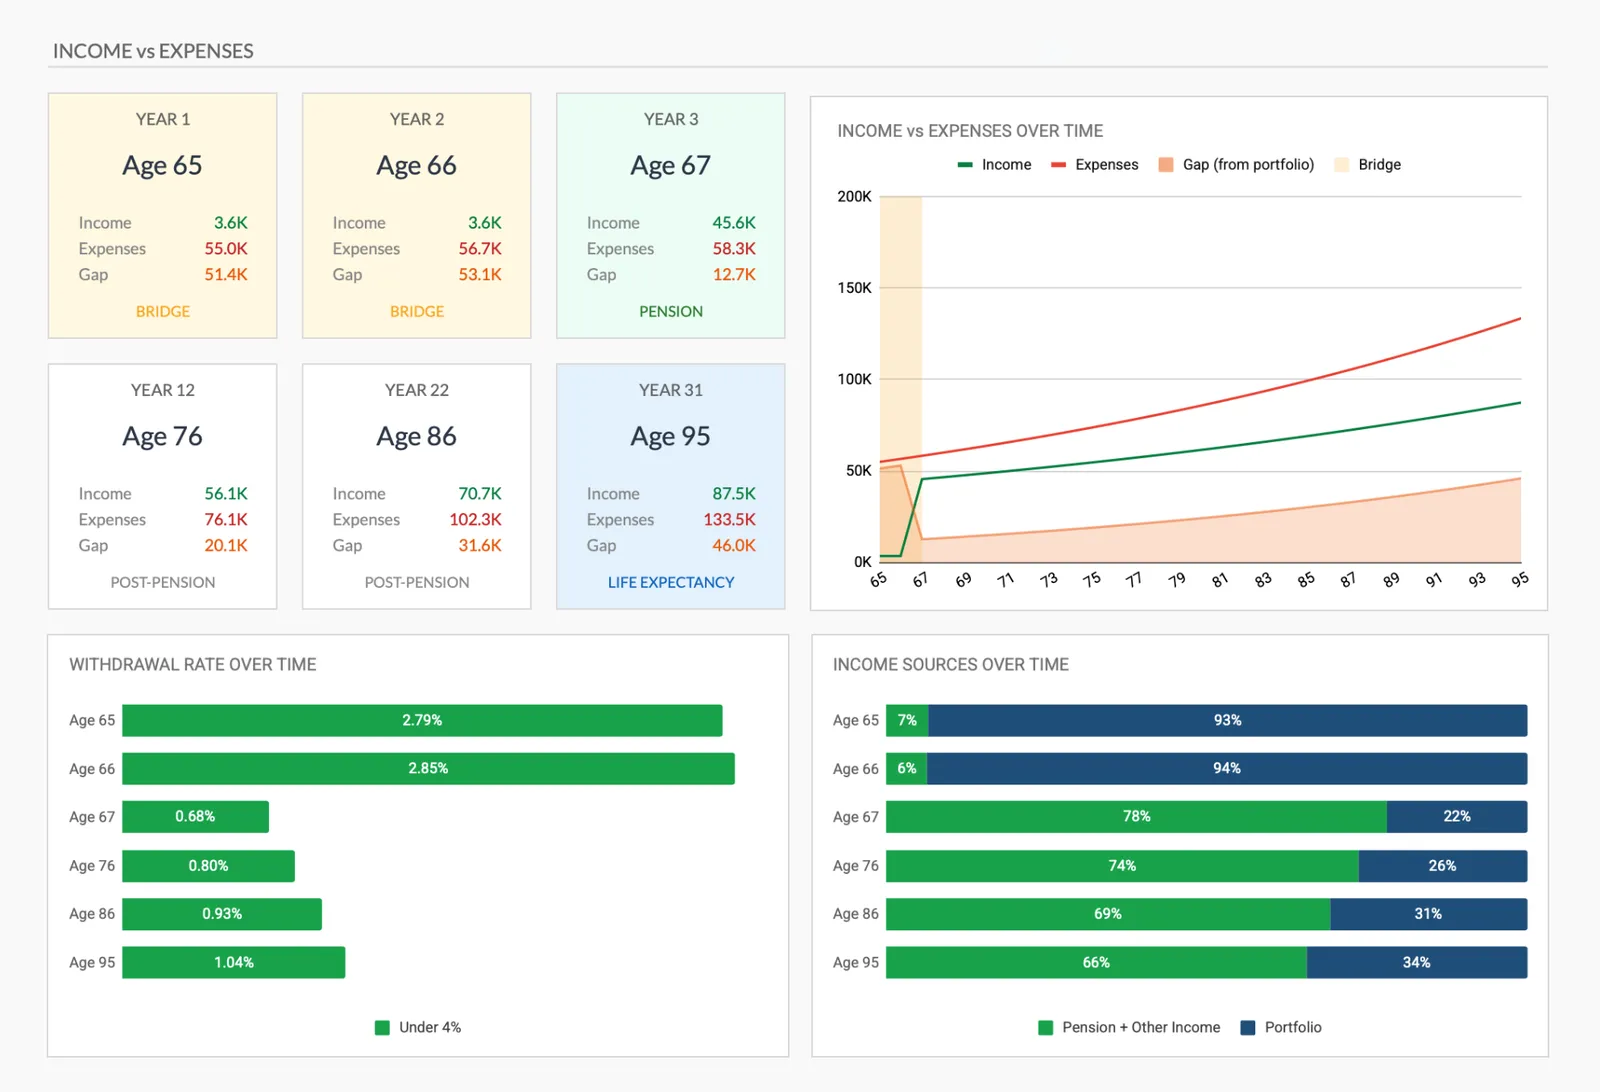
Checkpoint years across retirement each show income, expenses and the gap that has to come from the portfolio. The bridge years before pension income starts are labeled and shaded separately.
Three market scenarios side by side
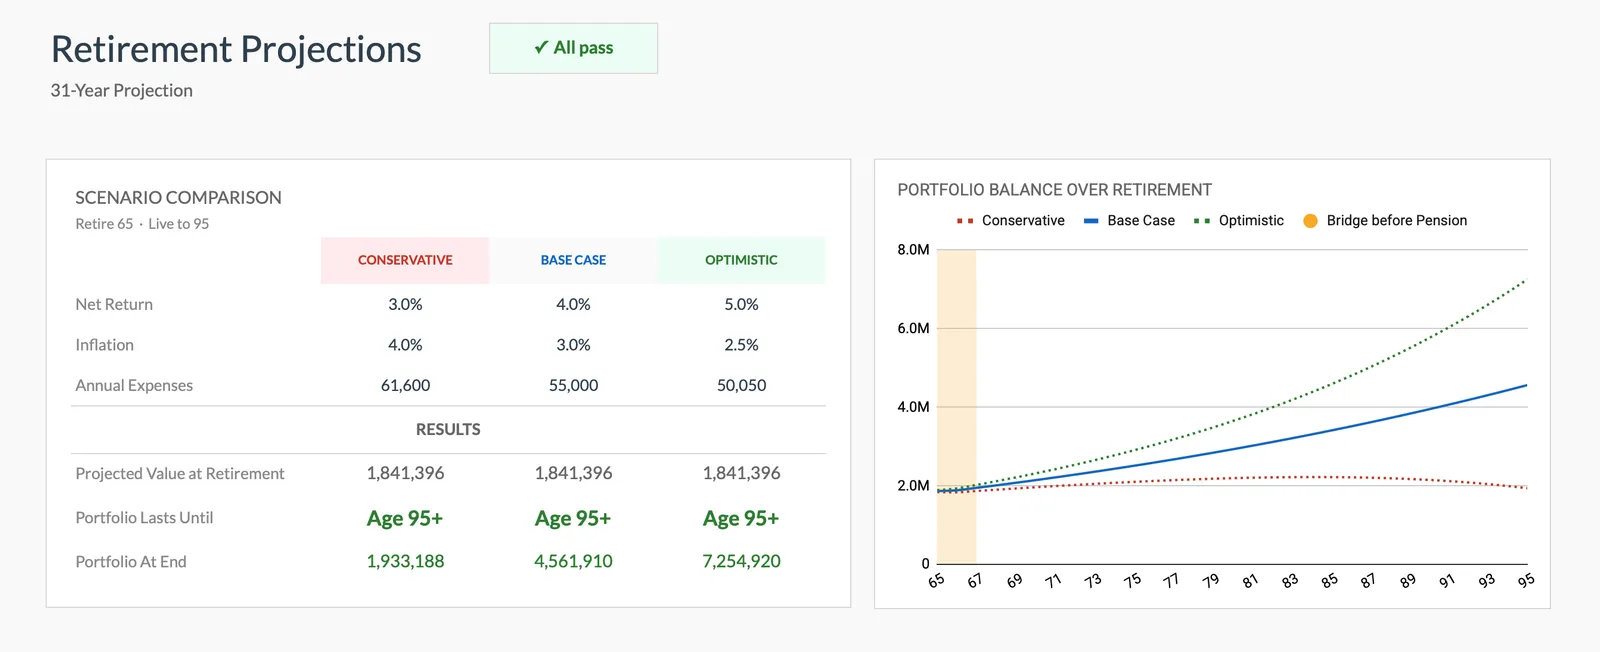
Conservative, base case and optimistic columns run different net returns and inflation rates, and each reports how long the portfolio lasts and what is left at the end.
Portfolio sustainability projection
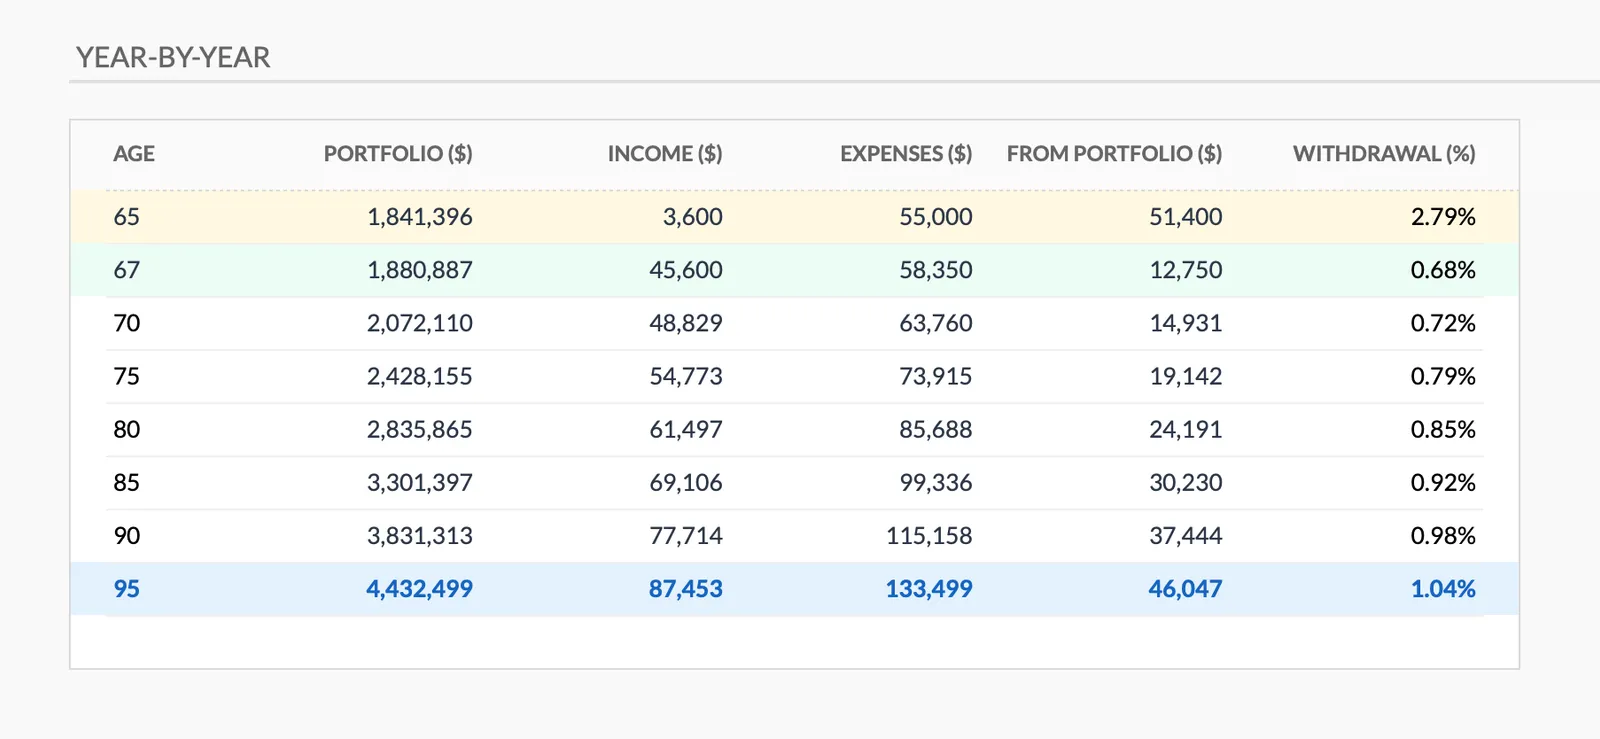
The year by year table reports the portfolio balance, the amount drawn from it and the withdrawal rate at each age it covers, from your retirement age through the life expectancy you set.
What-if scenario comparison
Twelve what-if cards recalculate from your inputs, covering a one-year delay, retiring now, stopping saving, expenses 10% higher or lower, no pension, a 50% pension cut and a 20% market drop.
Built-in safety checks
A row of checks reports whether the portfolio lasts to your life expectancy, the maximum withdrawal rate against 4%, whether each of the three scenarios holds, and the longevity buffer in years.
Inflation-adjusted projections
The inflation rate you enter is applied to expenses every year, so the spending figures in the projection grow across the horizon instead of staying flat.
See It In Action
What the template looks like
Browse through the template to see how it handles retirement projections, milestone tracking, and income planning.
- Retirement overview dashboard
- Savings growth projections
- Retirement milestone tracking
- Income vs expenses analysis
- Year-by-year projection
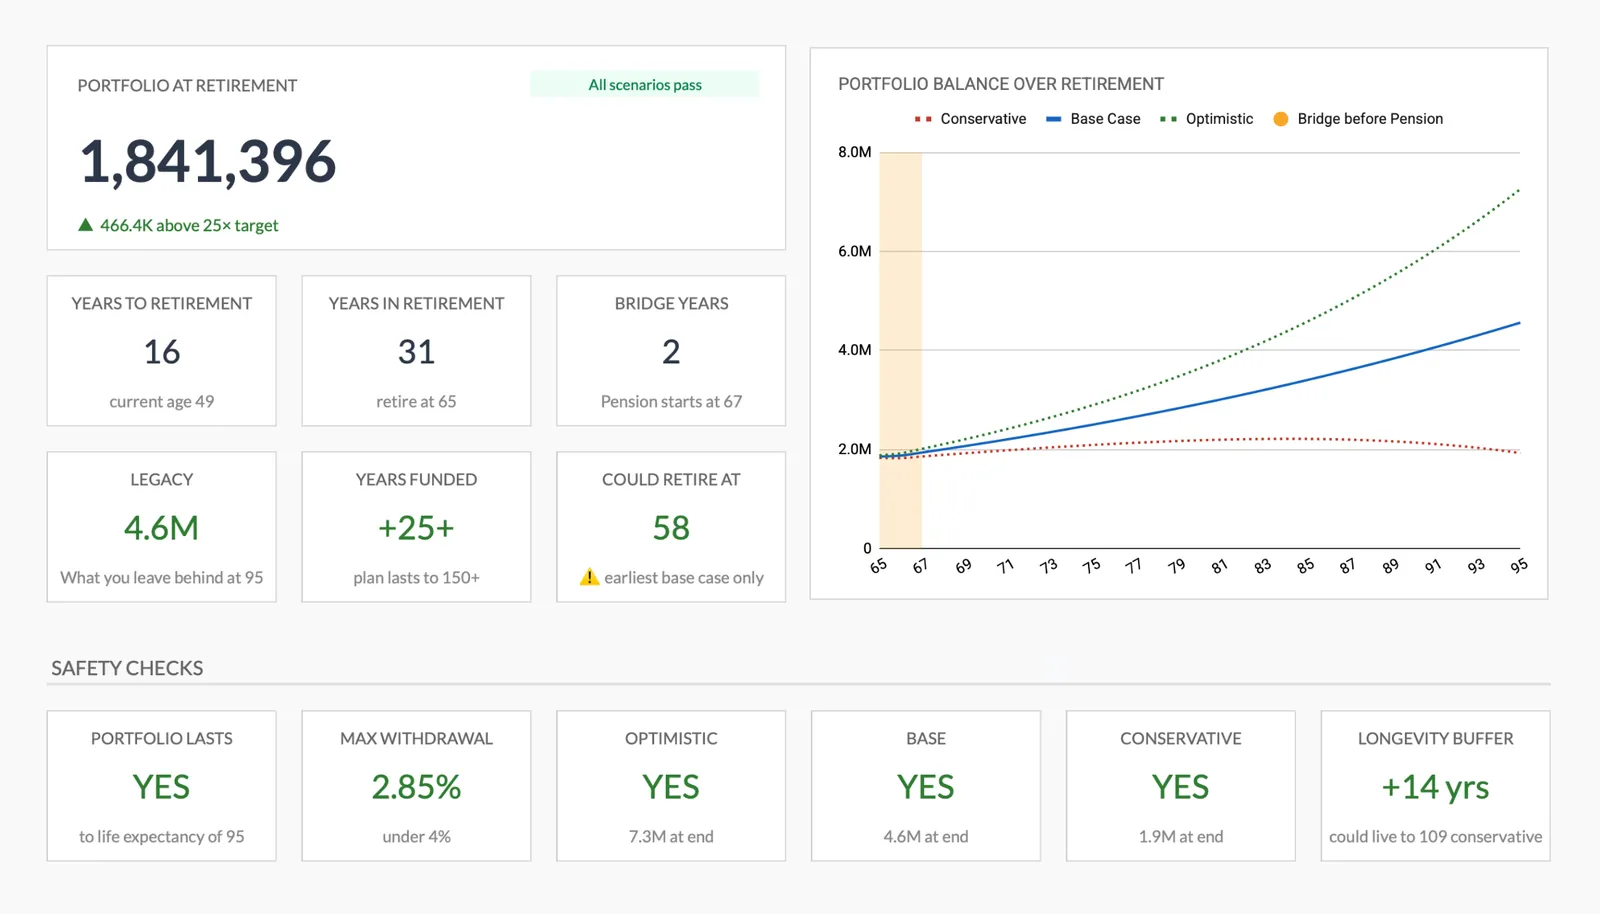
Complete retirement overview with projections
Project your retirement savings growth
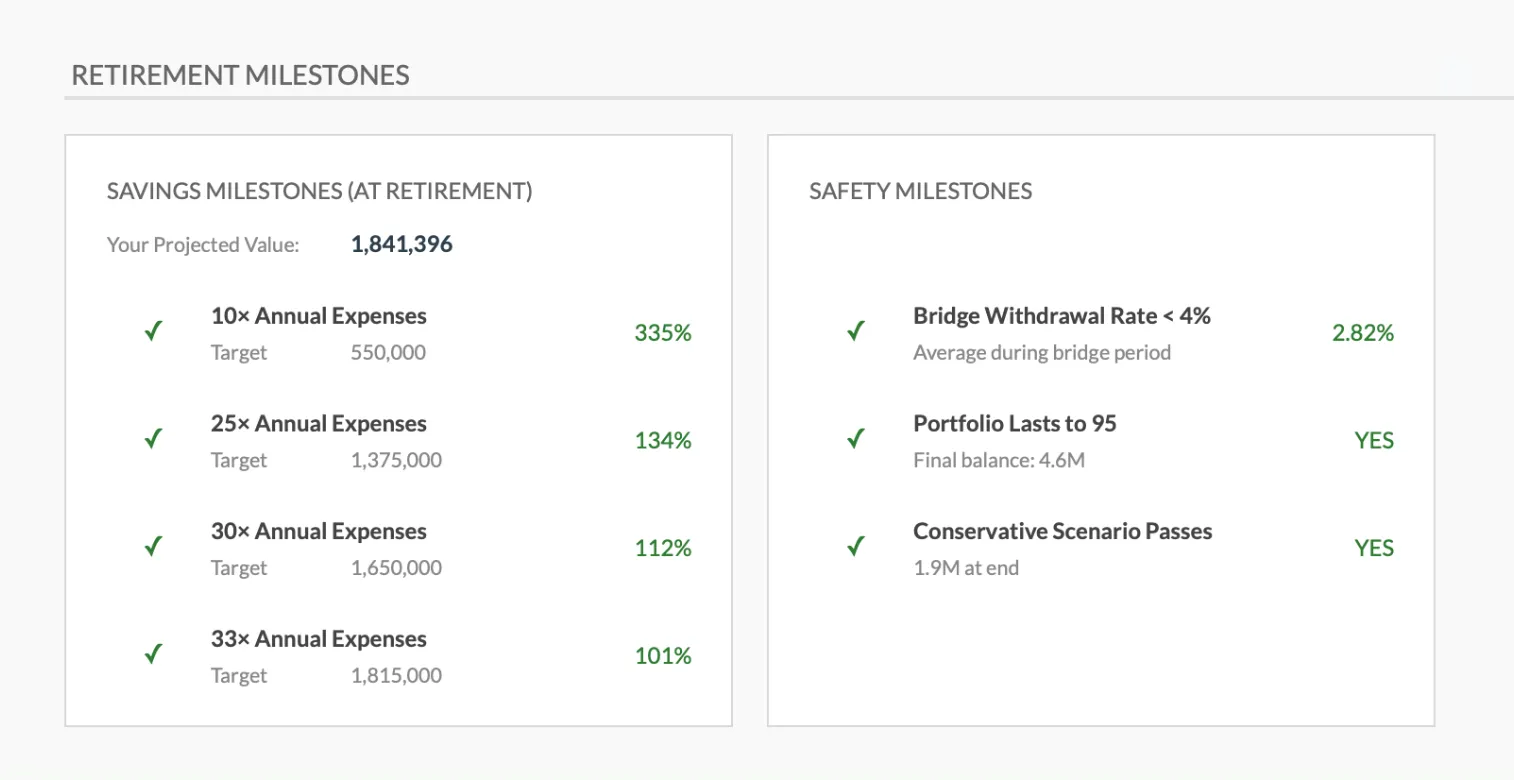
Track progress toward retirement goals
Plan your retirement income against expenses
Detailed year-by-year retirement projection
Getting Started
Start Setting Up Your Retirement Plan
Enter your income sources
Two monthly fields cover it. Total pension income starts at the pension age you set, and other income such as rental or part-time work counts from the first year.
Enter savings as one combined balance
Total current savings is a single figure covering every retirement account together. Traditional, Roth and taxable balances are added up before they go in.
Define your baseline spending
Total annual expenses is your spending level in the first year of retirement. It is the starting point for every projection, and inflation grows it from there.
Read the three scenarios
Conservative, base and optimistic recalculate on their own. Changing an input such as annual expenses or the post-retirement return moves all three at once.
Review and update annually
Refresh the savings balance, update the spending figure, and read the projections again. Market changes and life events can move the numbers a long way in a year.
Common Questions
Retirement Planning for Retirees- FAQ
What withdrawal rate should I use?
There is no withdrawal rate input. The rate is calculated each year from your expenses against the portfolio balance, reported in the year by year table, and the maximum is checked against the commonly referenced 4% figure. Changing the annual expenses figure is what moves it.
How does this handle Required Minimum Distributions?
The template projects one combined portfolio rather than separate account types, so RMDs are not modelled automatically. One approach is to raise your planned annual withdrawal from the year RMDs begin, so the projection reflects the forced income.
Can I model delaying Social Security?
There is no dedicated Social Security input, but income with a start age can stand in for it: run one projection per claiming age and compare how each affects long-term sustainability.
What if my expenses change significantly?
Update the spending level and re-run projections. Healthcare increases, downsizing, or lifestyle changes all affect the plan.
Does this account for taxes on withdrawals?
The template does not model tax brackets or separate traditional, Roth and taxable accounts. The two return fields are labeled net of tax, and one approach is to include estimated taxes in your annual spending figure so the projection reflects what you actually spend.
Can I plan for leaving money to heirs?
There is no dedicated bequest input. The summary reports a legacy figure for the balance left at your life expectancy, and the year by year table shows the portfolio at each age it covers, so you can compare what remains under each scenario you run.
Can't find the answer you're looking for? Contact our team
Start retirement planning as a retiree
One-time purchase. No subscription. Your financial data stays in your Google Drive.