Financial Planning Template
Financial Planning Template for Retirees
One financial planning template you set up around retirement, with income and spending logged month by month, every account in one place, and a projection that runs to an end year you pick.
In Depth
Financial Planning Does Not End at Retirement
The transition from accumulation to distribution is one of the most significant shifts in financial life, and it happens with surprisingly little preparation for most people. After decades of saving and investing, the rules change - income now comes from the portfolio rather than flowing into it, and every withdrawal has implications for how long the money lasts. A financial plan designed for this phase tracks different metrics than the one used during working years.
Withdrawal pace is where many retirees find the most practical value in ongoing financial planning. The difference between withdrawing 3.5% and 4.5% of a portfolio annually may seem small in percentage terms, but over 25 or 30 years of retirement it compounds into very different outcomes. Recording what comes out each month alongside what the portfolio is worth is what turns that question into something you can look at.
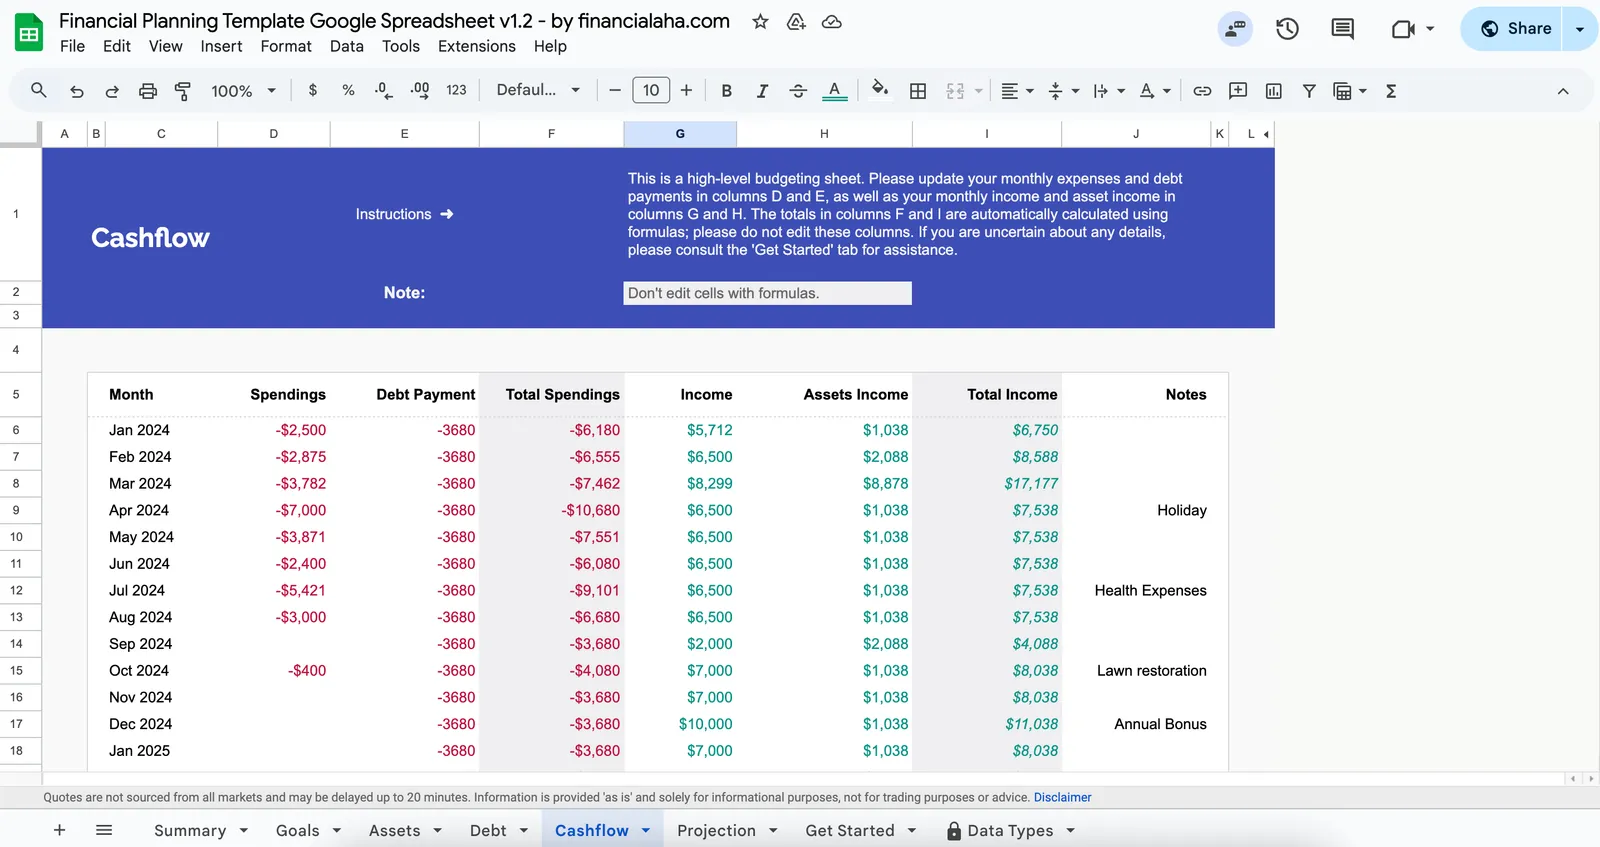
Healthcare costs introduce a variable that working-age financial plans rarely need to account for at this scale. Medicare premiums, supplemental insurance, prescription costs, and the possibility of long-term care create a spending category that can shift dramatically from year to year. The monthly cash flow row holds a single spending figure, so some retirees keep their own record of healthcare costs and use the Notes column to mark the months where those costs drove the total.
The Challenge
Why Retirees Need Ongoing Financial Planning
Retirement is not the end of financial planning - it is a shift from accumulation to distribution. Managing withdrawals, income sources, and longevity risk requires consistent monitoring.
Income now comes from multiple sources
Social Security, pension, retirement account withdrawals, investment income, maybe part-time work - retirement income is a patchwork that needs coordination.
Portfolio withdrawals need monitoring
Drawing down a portfolio quickly can deplete it sooner than expected. Recording what comes out each month next to what the portfolio is worth is what makes the pace visible.
Healthcare costs are unpredictable
Medicare premiums, supplemental insurance, prescriptions, and potential long-term care create a category of spending that can change significantly year to year.
Longevity uncertainty requires planning buffers
Planning for 20 years versus 35 years of retirement looks very different. A plan you can re-run against a later end year turns that difference into something concrete.
Ready to take control of your retiree finances?
What You Get
Financial Planning Features for Retirement
Monthly income on the Cashflow tab
Social Security, a pension, annuity payments and any part-time pay are added together into the income figure for the month, with what your assets earned computed alongside it.
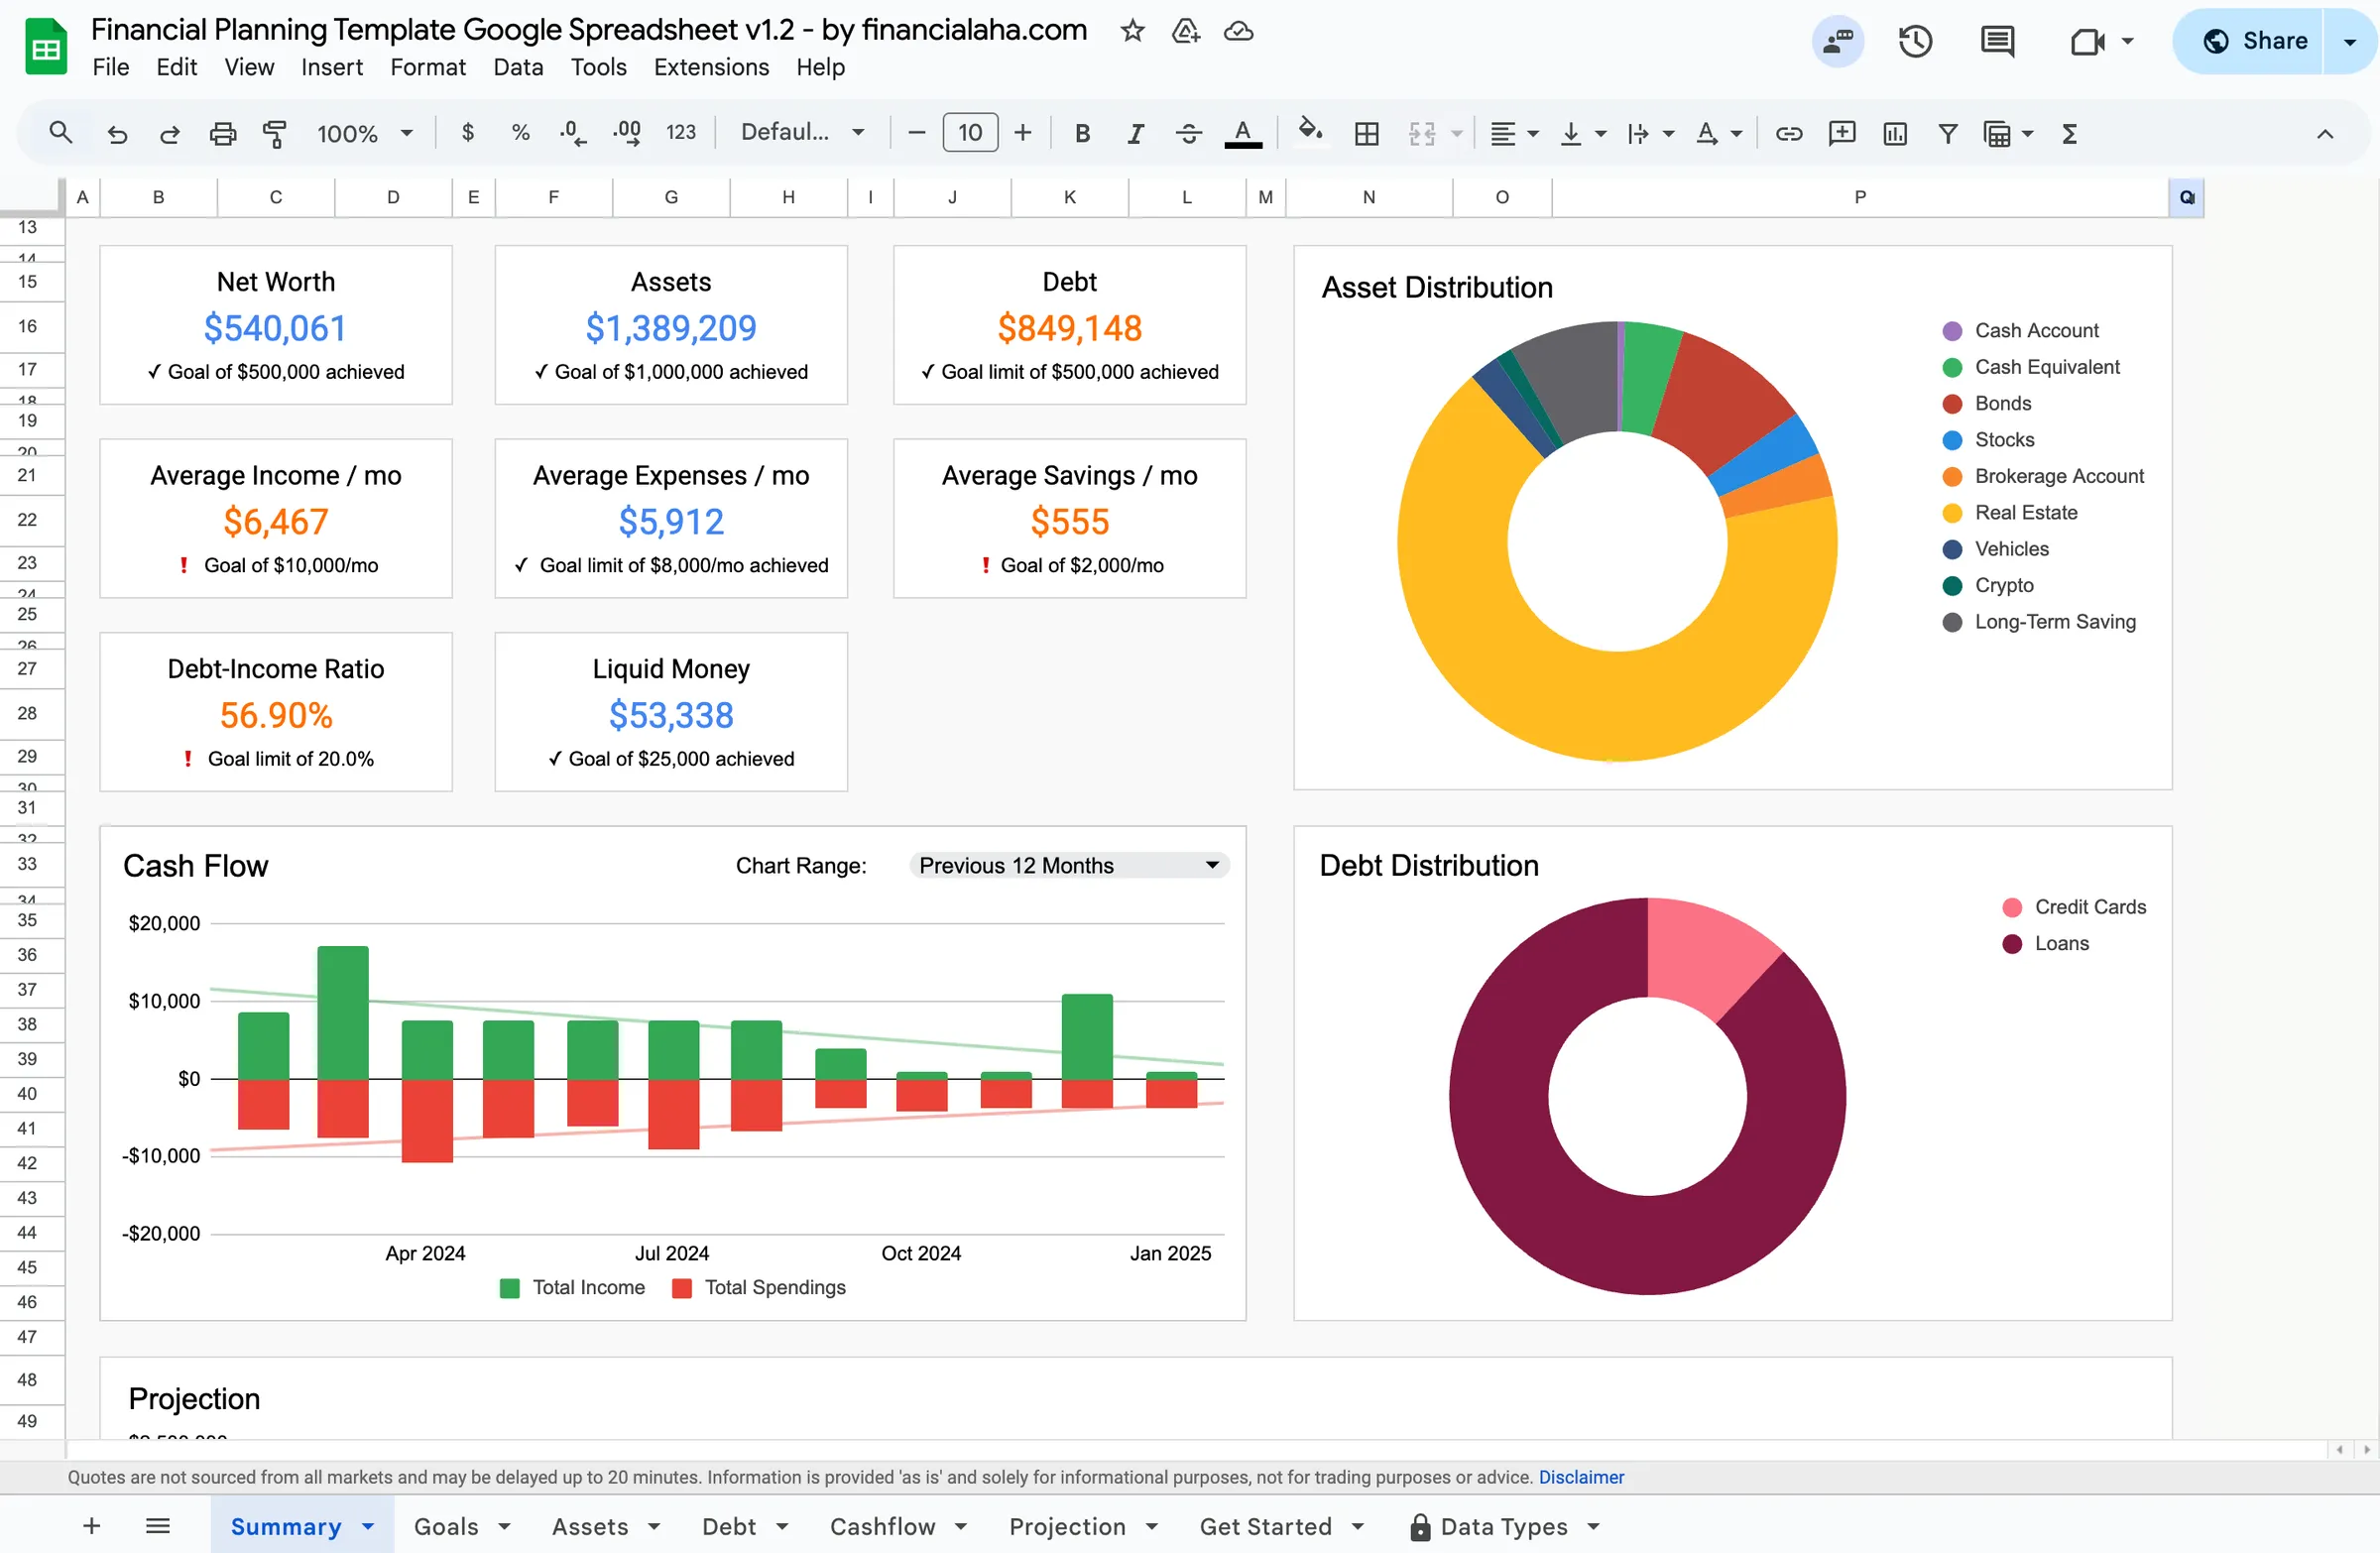
Portfolio and asset overview
Monitor retirement account balances, taxable investments, real estate equity, and other assets. See total holdings at a glance.
Spending beside income
Each month row puts spending and debt payments next to income and asset income, and the summary chart shows the two sides against each other over the range you pick.
Debt and obligation tracker
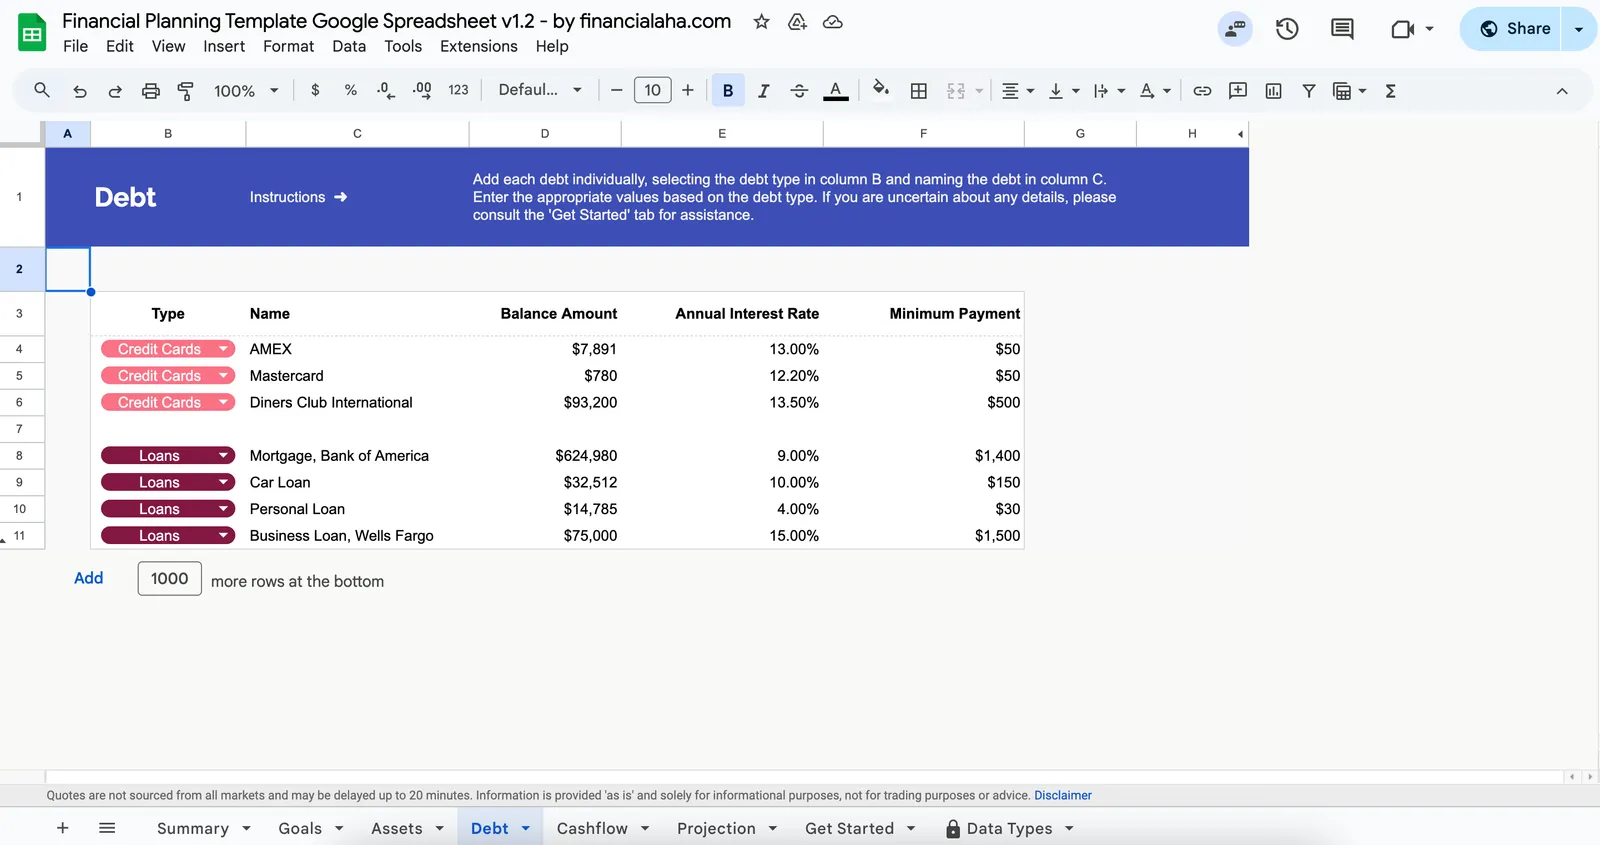
Any remaining debts - mortgage, loans, or other obligations. See how they fit against retirement income.
Multi-year projections
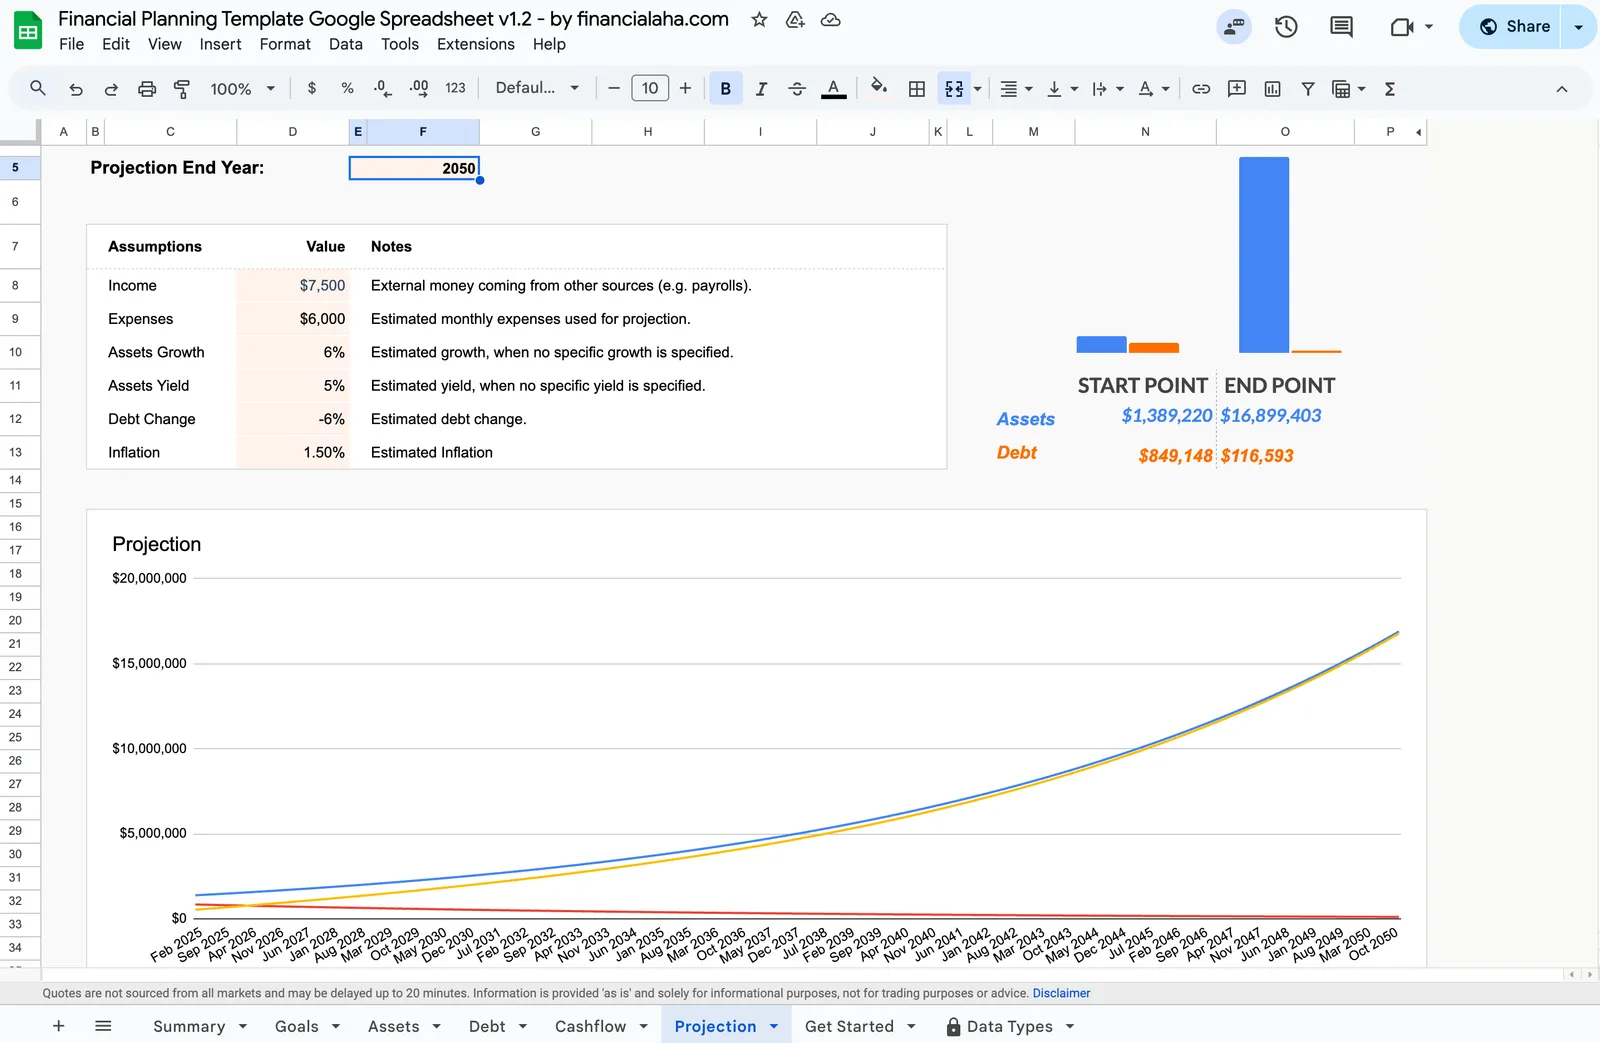
Set the end year and the assumptions for income, expenses, asset growth, asset yield, debt change and inflation. The chart runs assets and debt out month by month to that year.
Net worth tracking
The summary recalculates assets minus debts each time you refresh balances and shows the figure against the net worth target you set.
See It In Action
What the template looks like
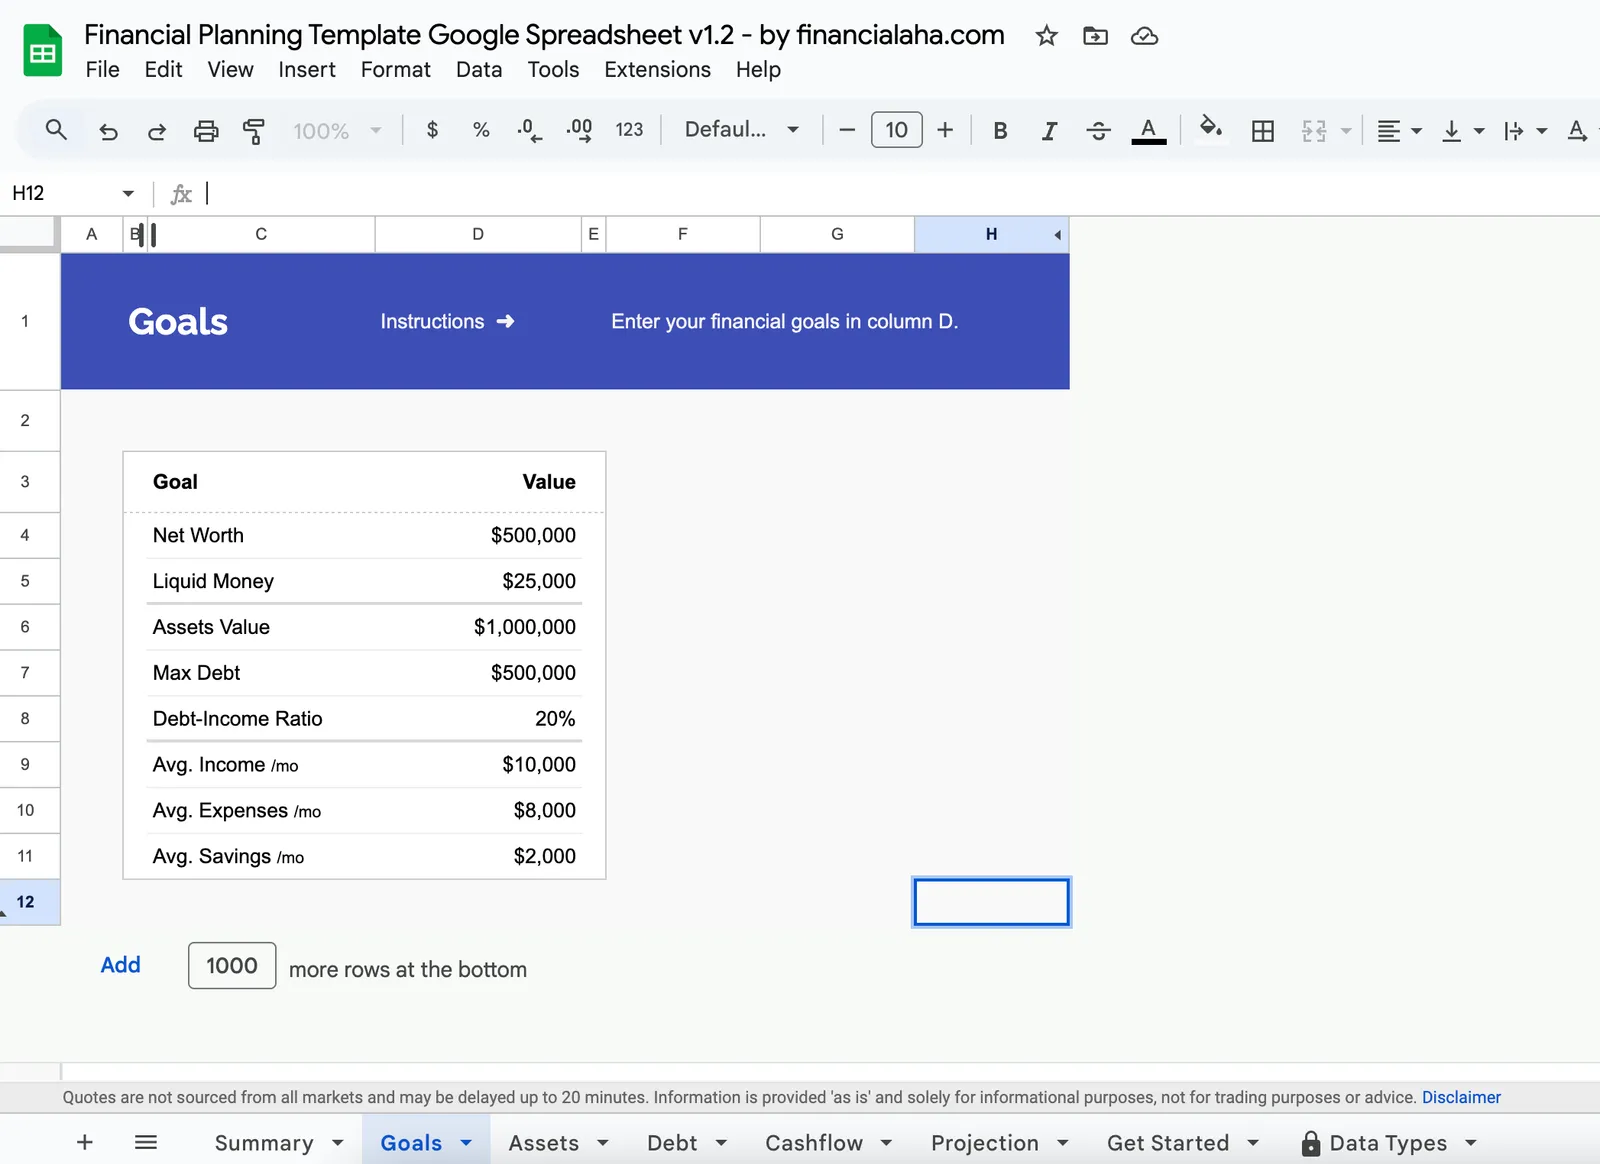
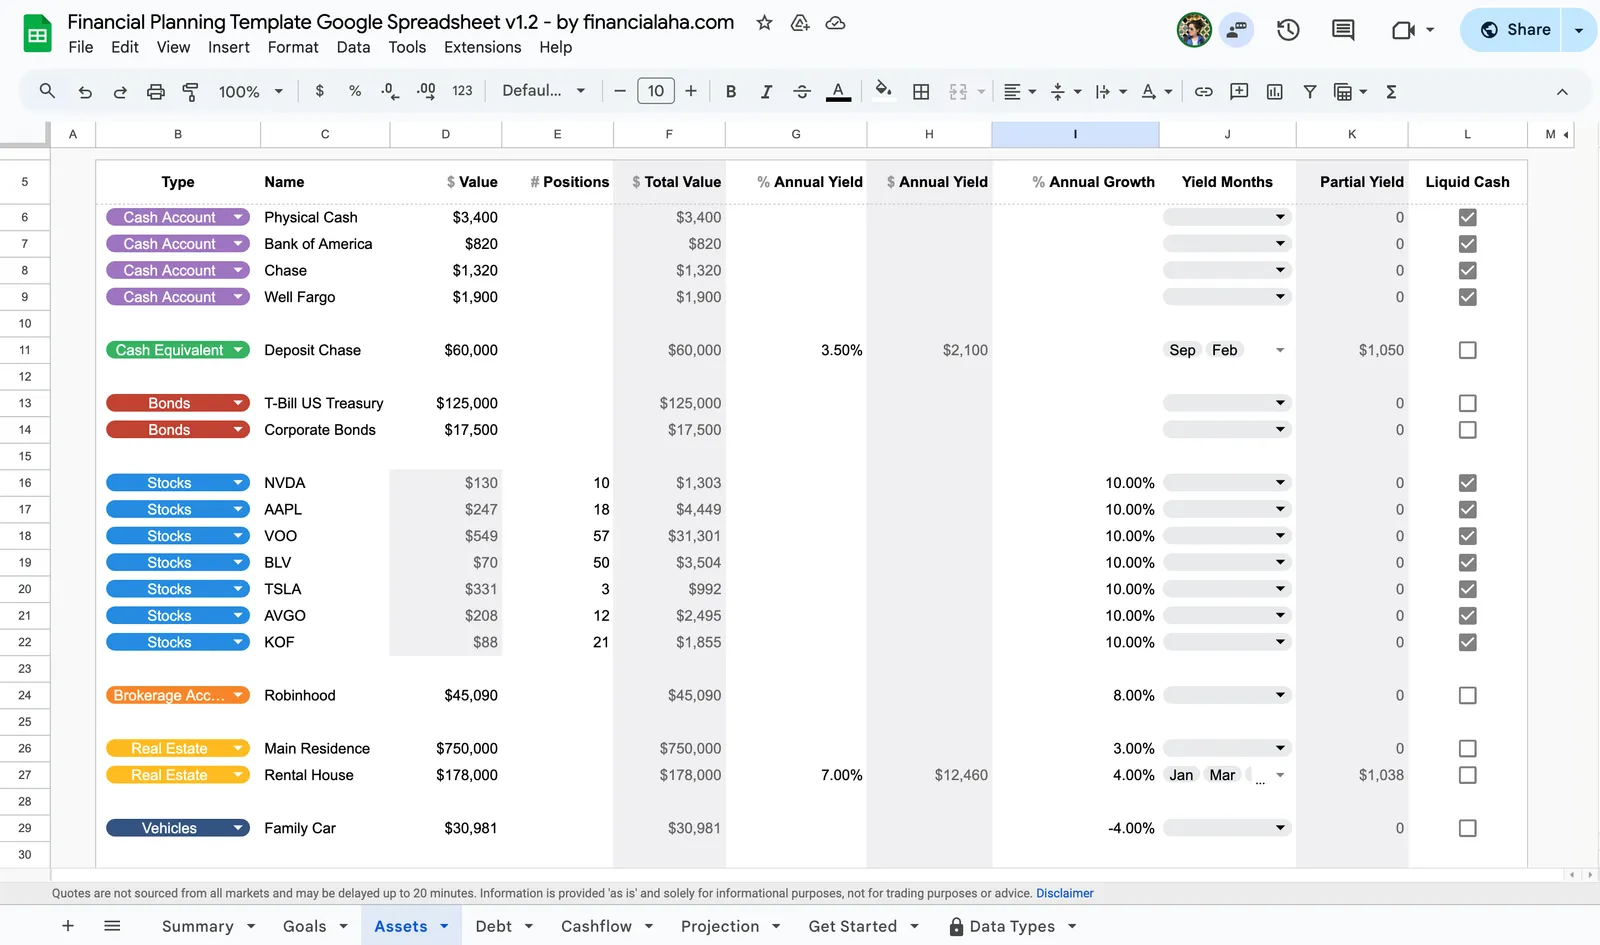
Browse through the template to see how it handles financial planning, goal tracking, asset management, and projections.
- Complete financial overview dashboard
- Goal setting and progress tracking
- Asset and debt management
- Cash flow analysis
- Financial projections
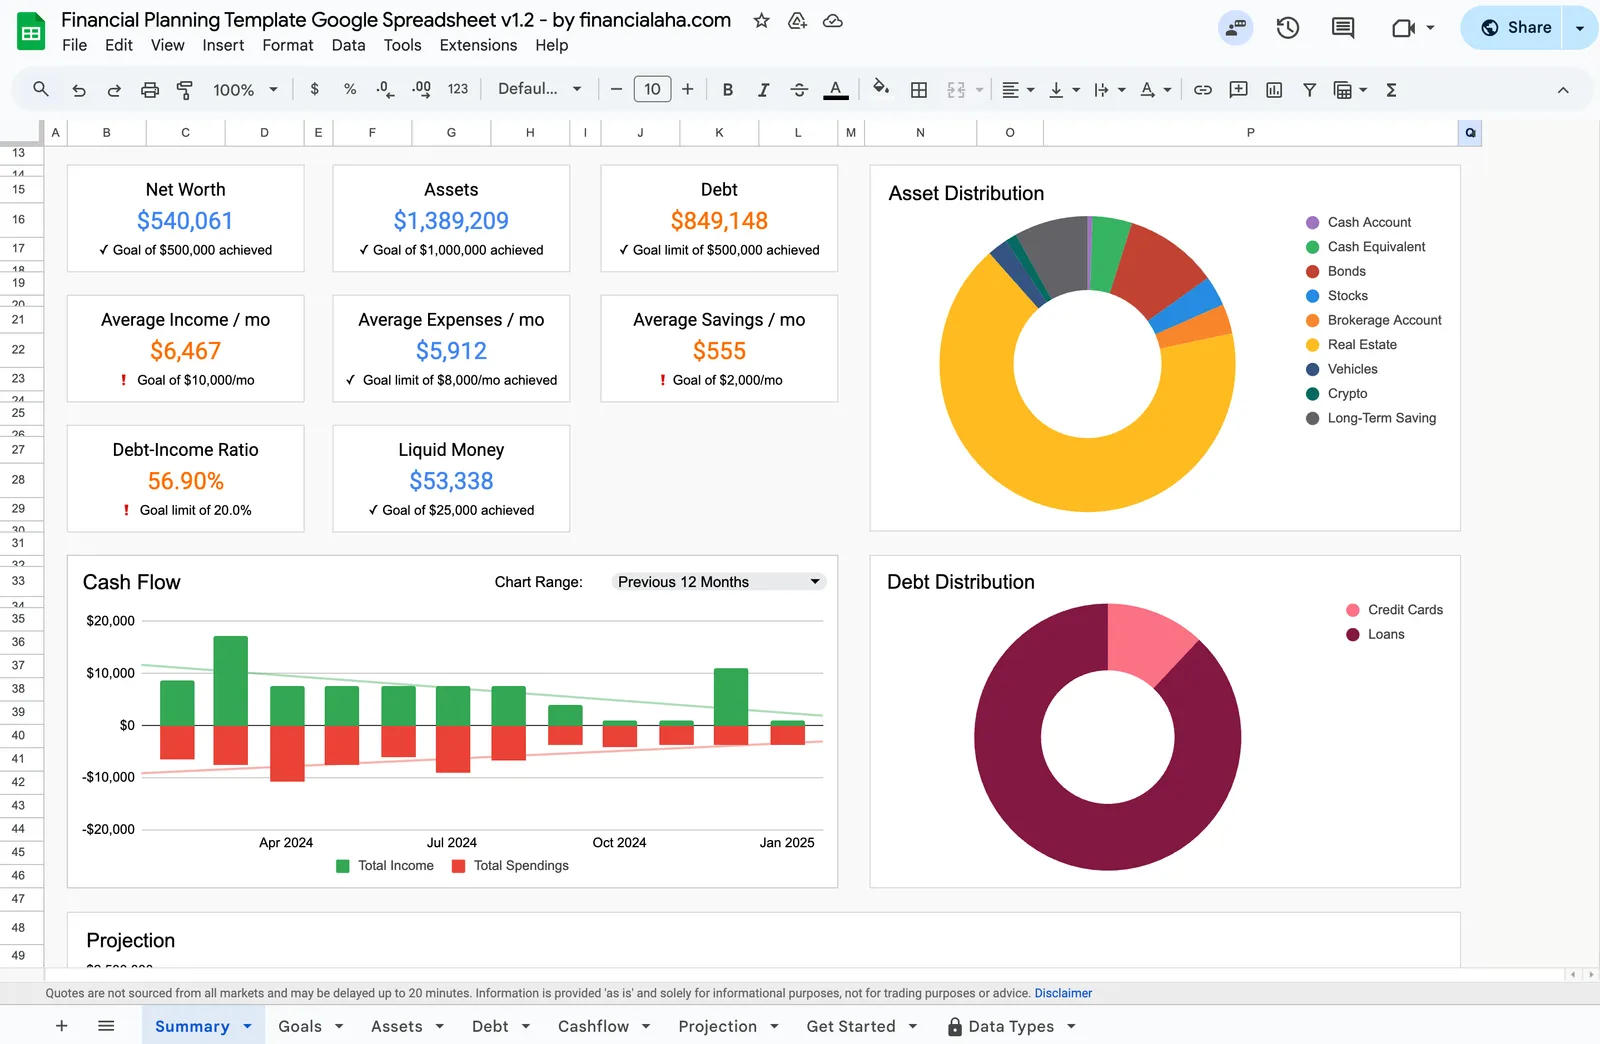
Complete financial overview with net worth and goals
Set and track progress toward financial milestones
Track all your assets in one place
Monitor and plan debt repayment
Visualize your income vs spending over time
Project your financial future
Getting Started
Begin Your Retirement Financial Plan
Enter each month of income
Add up Social Security, a pension, annuity payments and anything else that arrived, then put the total on the Cashflow row for that month. What your assets earned is computed for you.
Record all asset balances
Enter current values for retirement accounts, investments, real estate, and other assets.
Record what comes out
Enter spending and debt payments for the month on the Cashflow tab, then lower the account balances on the Assets tab. The summary reports average monthly spending next to average income.
Run longevity projections
Change the projection end year to run the same assumptions over a longer or shorter horizon, and adjust growth, yield and inflation for other scenarios.
Update monthly and review quarterly
Monthly balance updates keep the picture current. Quarterly reviews help spot trends that need attention.
Common Questions
Financial Planning for Retirees- FAQ
Does this replace a retirement calculator?
A calculator projects from assumptions alone. This template holds the figures you enter month by month and carries a projection tab of its own, so the record and the forecast sit in the same file.
How does this handle Required Minimum Distributions?
There is no RMD field. What you take out shows up as the balance you enter on the Assets tab and as spending on the Cashflow tab. The required amount comes from IRS tables or your account provider.
Can I track healthcare expenses separately?
The Cashflow tab takes one spending figure per month rather than categories, so healthcare sits inside that total. The Notes column on the same row is where some people mark the months medical costs drove the figure.
What if I am still working part-time?
Part-time pay is part of the income figure on the Cashflow row, so earned and retirement income sit in the same monthly total.
Is this useful early in retirement?
The first few years of retirement are when spending patterns get established. Tracking from day one leaves you with a record of what those years actually cost.
Can I model leaving money for heirs?
There is no dedicated bequest input, but the multi-year projections show the trajectory of net worth under your plan - a rough view of what would remain at each horizon.
Can't find the answer you're looking for? Contact our team
Start financial planning as a retiree
One-time purchase. No subscription. Your financial data stays in your Google Drive.