Free Stock Trading Journal Spreadsheet Template
Log stock trades with entry, exit, and profit/loss details. Track trading performance over time with running P&L calculations.

What's Included
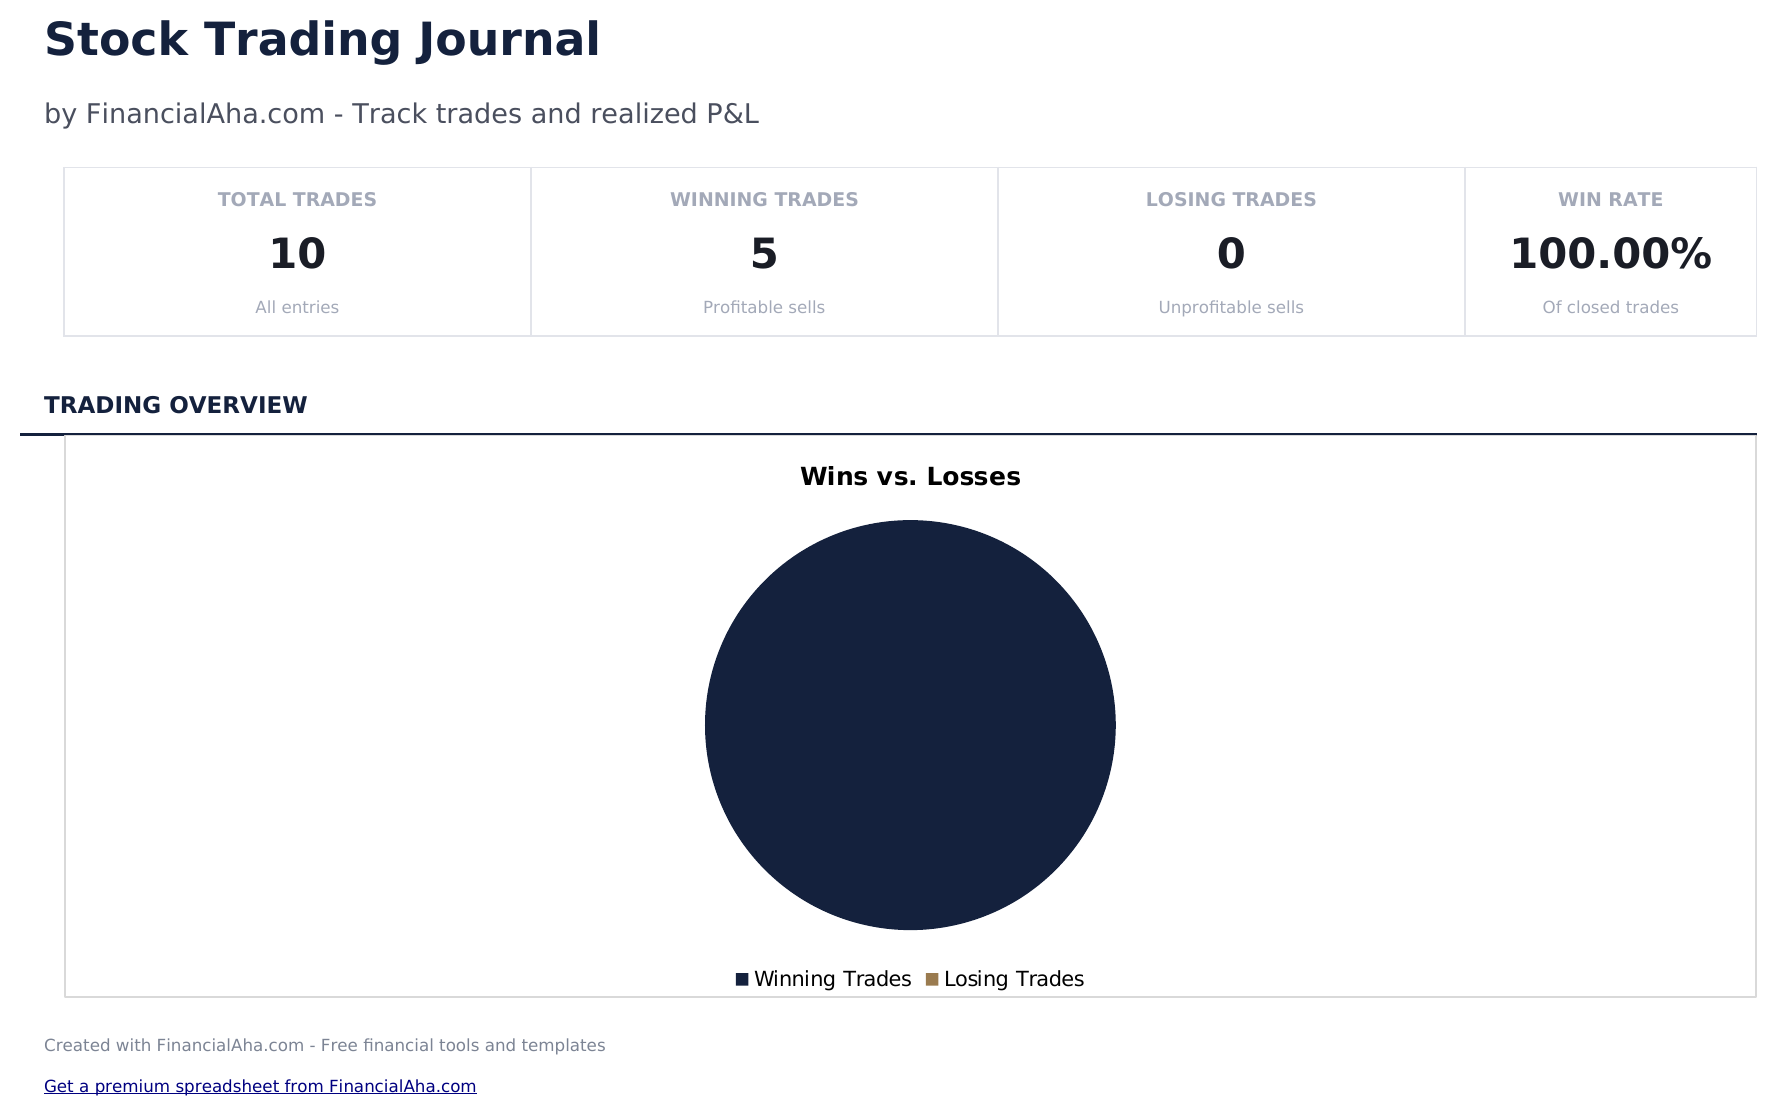
- Dashboard with trading performance metrics showing total trades, win rate, average return, and cumulative P&L
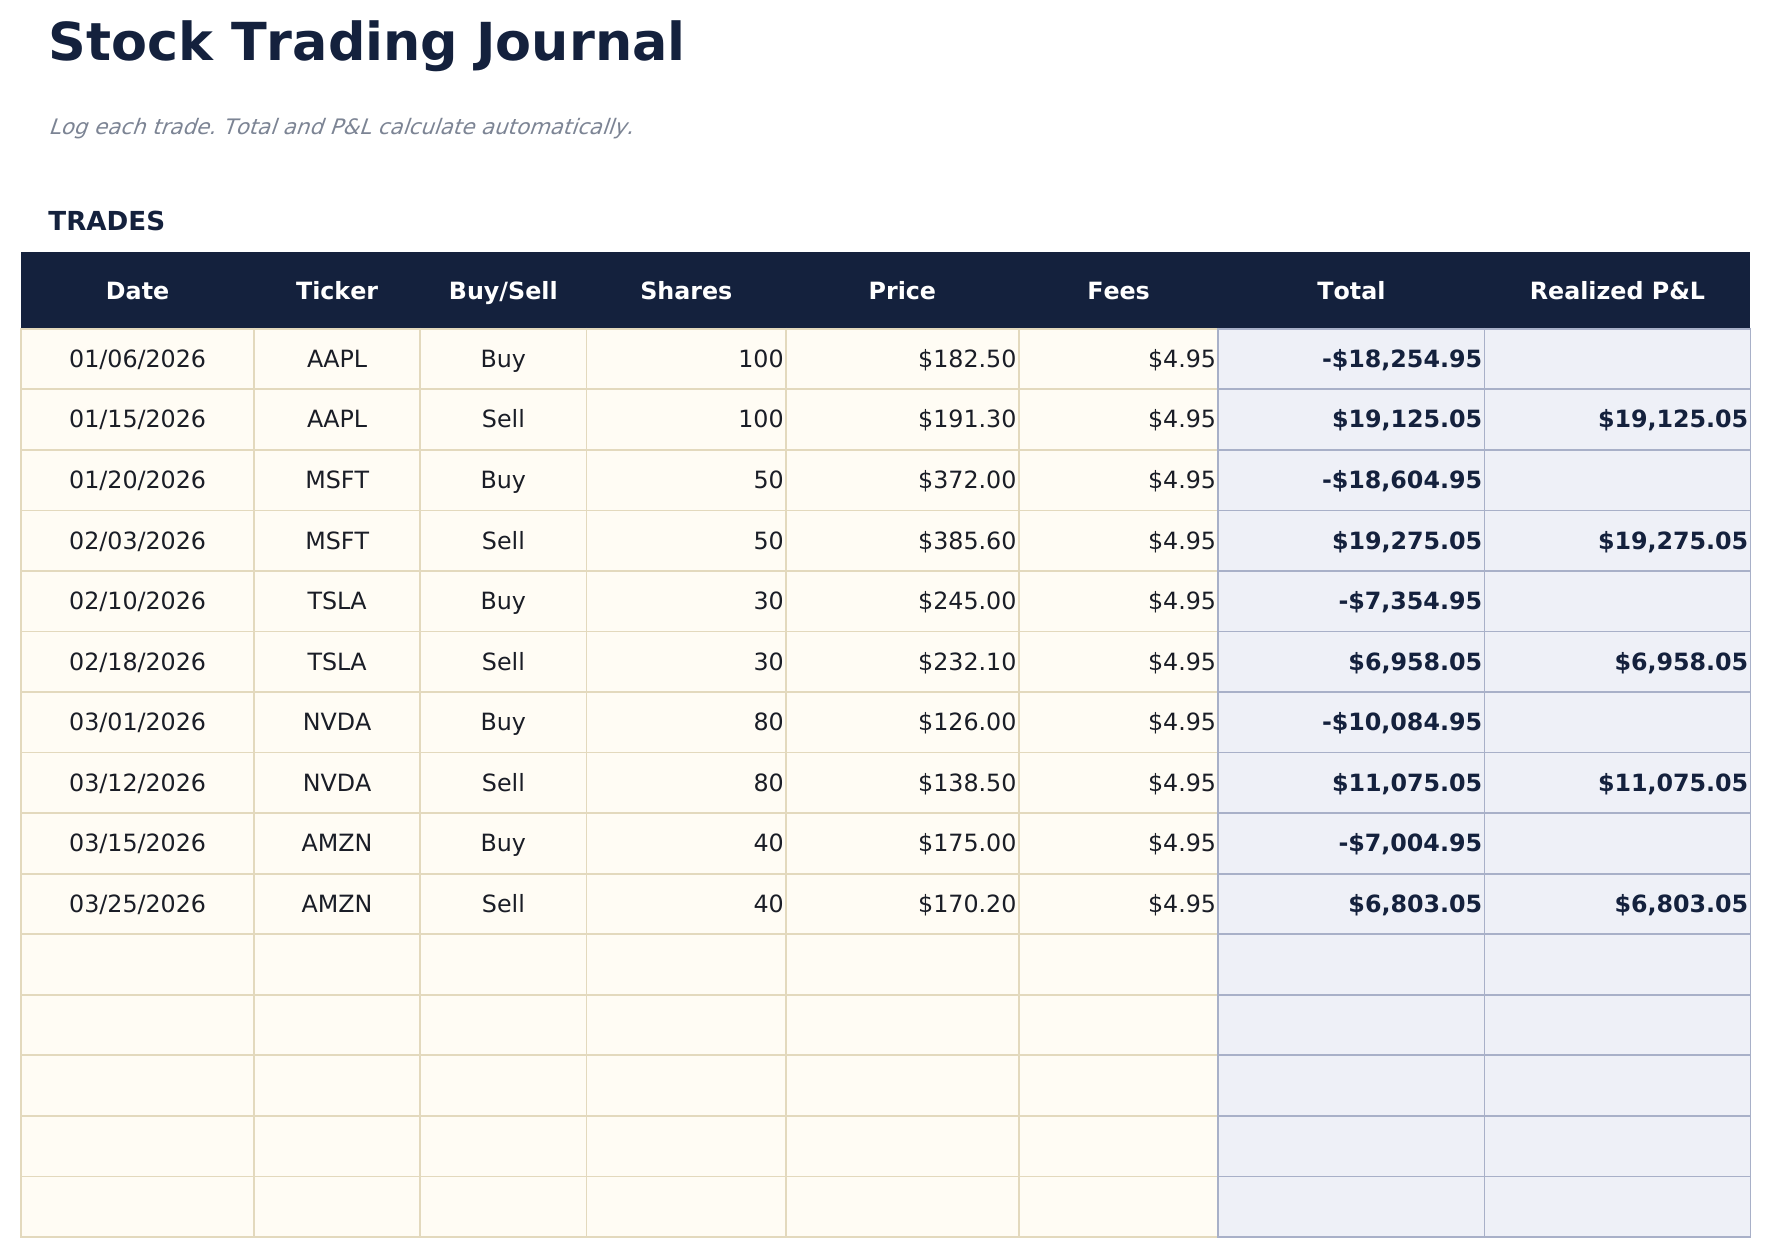
- Trade log with columns for ticker, date entered, entry price, date exited, exit price, shares, and profit or loss
- Profit and loss per trade calculated automatically from entry price, exit price, shares, and any commission costs
- Win rate and average return calculations updated after each trade entry with separate long and short stats
- Running cumulative P&L with color-coded input cells (yellow) and auto-calculated performance metrics (blue)
- Works in Microsoft Excel, Google Sheets, and LibreOffice Calc with no setup required
Preview
See what's inside this template
How to Use This Stock Trading Journal Template
Log each trade
Enter the ticker, entry date, entry price, exit date, exit price, and number of shares for every completed trade.
Record your rationale
Add notes about why you entered and exited each position. This helps review decision patterns over time.
Review trade results
Profit or loss per trade calculates automatically from entry price, exit price, shares, and commissions.
Check performance metrics
The dashboard shows total trades, win rate, average gain, average loss, and cumulative P&L.
Built by Claude AI. Perfected by us.
We use Claude AI to draft each free template, after a deep research. Then our team steps in. We refine the layout, stress-test every formula, fix edge cases, and polish the design until it feels like something we would actually use ourselves. The AI gets us 80% there. The last 20% is all human judgment.
Frequently Asked Questions
Does it calculate win rate?
Yes. Win rate is the number of profitable trades divided by total trades. The dashboard updates after each new trade entry.
Can I track commissions?
Yes. Add commission costs per trade. They are subtracted from the profit or added to the loss for each position.
Does it support short selling?
Yes. For short trades, enter the short sale price as the entry and the cover price as the exit. The P&L calculation works correctly for both directions.
Can I see performance by ticker?
Filter or sort by ticker to see all trades in a single stock. This helps identify which tickers are most profitable.
How do I open this in Google Sheets?
Upload the .xlsx file to Google Drive, then open it with Google Sheets. All formulas and formatting will be preserved.
What license is this template under?
All free templates are released under CC BY 4.0 (Creative Commons Attribution). You can use, modify, and share them freely - including for commercial purposes - as long as you credit FinancialAha.com. They are provided as-is and do not constitute financial advice.
More Free Investing & Trading Templates
Looking for premium spreadsheet templates?
Our paid templates include advanced multi-sheet dashboards, native Excel charts, and ongoing updates.