
Apps automate transaction tracking, so they are strong at showing what already happened. A financial planning spreadsheet adds the piece apps rarely do well, projecting your net worth, retirement, and cash flow forward under assumptions you set and can see. Every formula is visible, categories are unlimited, and the file stays yours even if a company shuts down. This guide shows the four layers of a plan you can build in Google Sheets or Excel.
Spreadsheets and finance apps solve different problems. Apps automate transaction tracking. Spreadsheets enable projection: modeling what happens to finances over years under different assumptions.
The distinction matters, and it comes down to looking backward versus looking forward.
For a head-to-head comparison, see Budget Spreadsheets vs Apps or the personal take in Why I Switched From Apps to Spreadsheets.
What Spreadsheets Do That Apps Cannot
| Capability | Apps | Spreadsheets |
|---|---|---|
| Auto-import transactions | Yes | No |
| Custom expense categories | Limited | Unlimited |
| Net worth projection | Rarely | Yes - with adjustable return assumptions |
| Retirement scenario modeling | Basic | Full control - change any variable |
| “What if” analysis | No | Yes - change one input, see all downstream effects |
| Formula transparency | Hidden | Every calculation visible |
| Survival after company shutdown | No | Yes - your file, forever |
Building a Financial Plan in 4 Layers
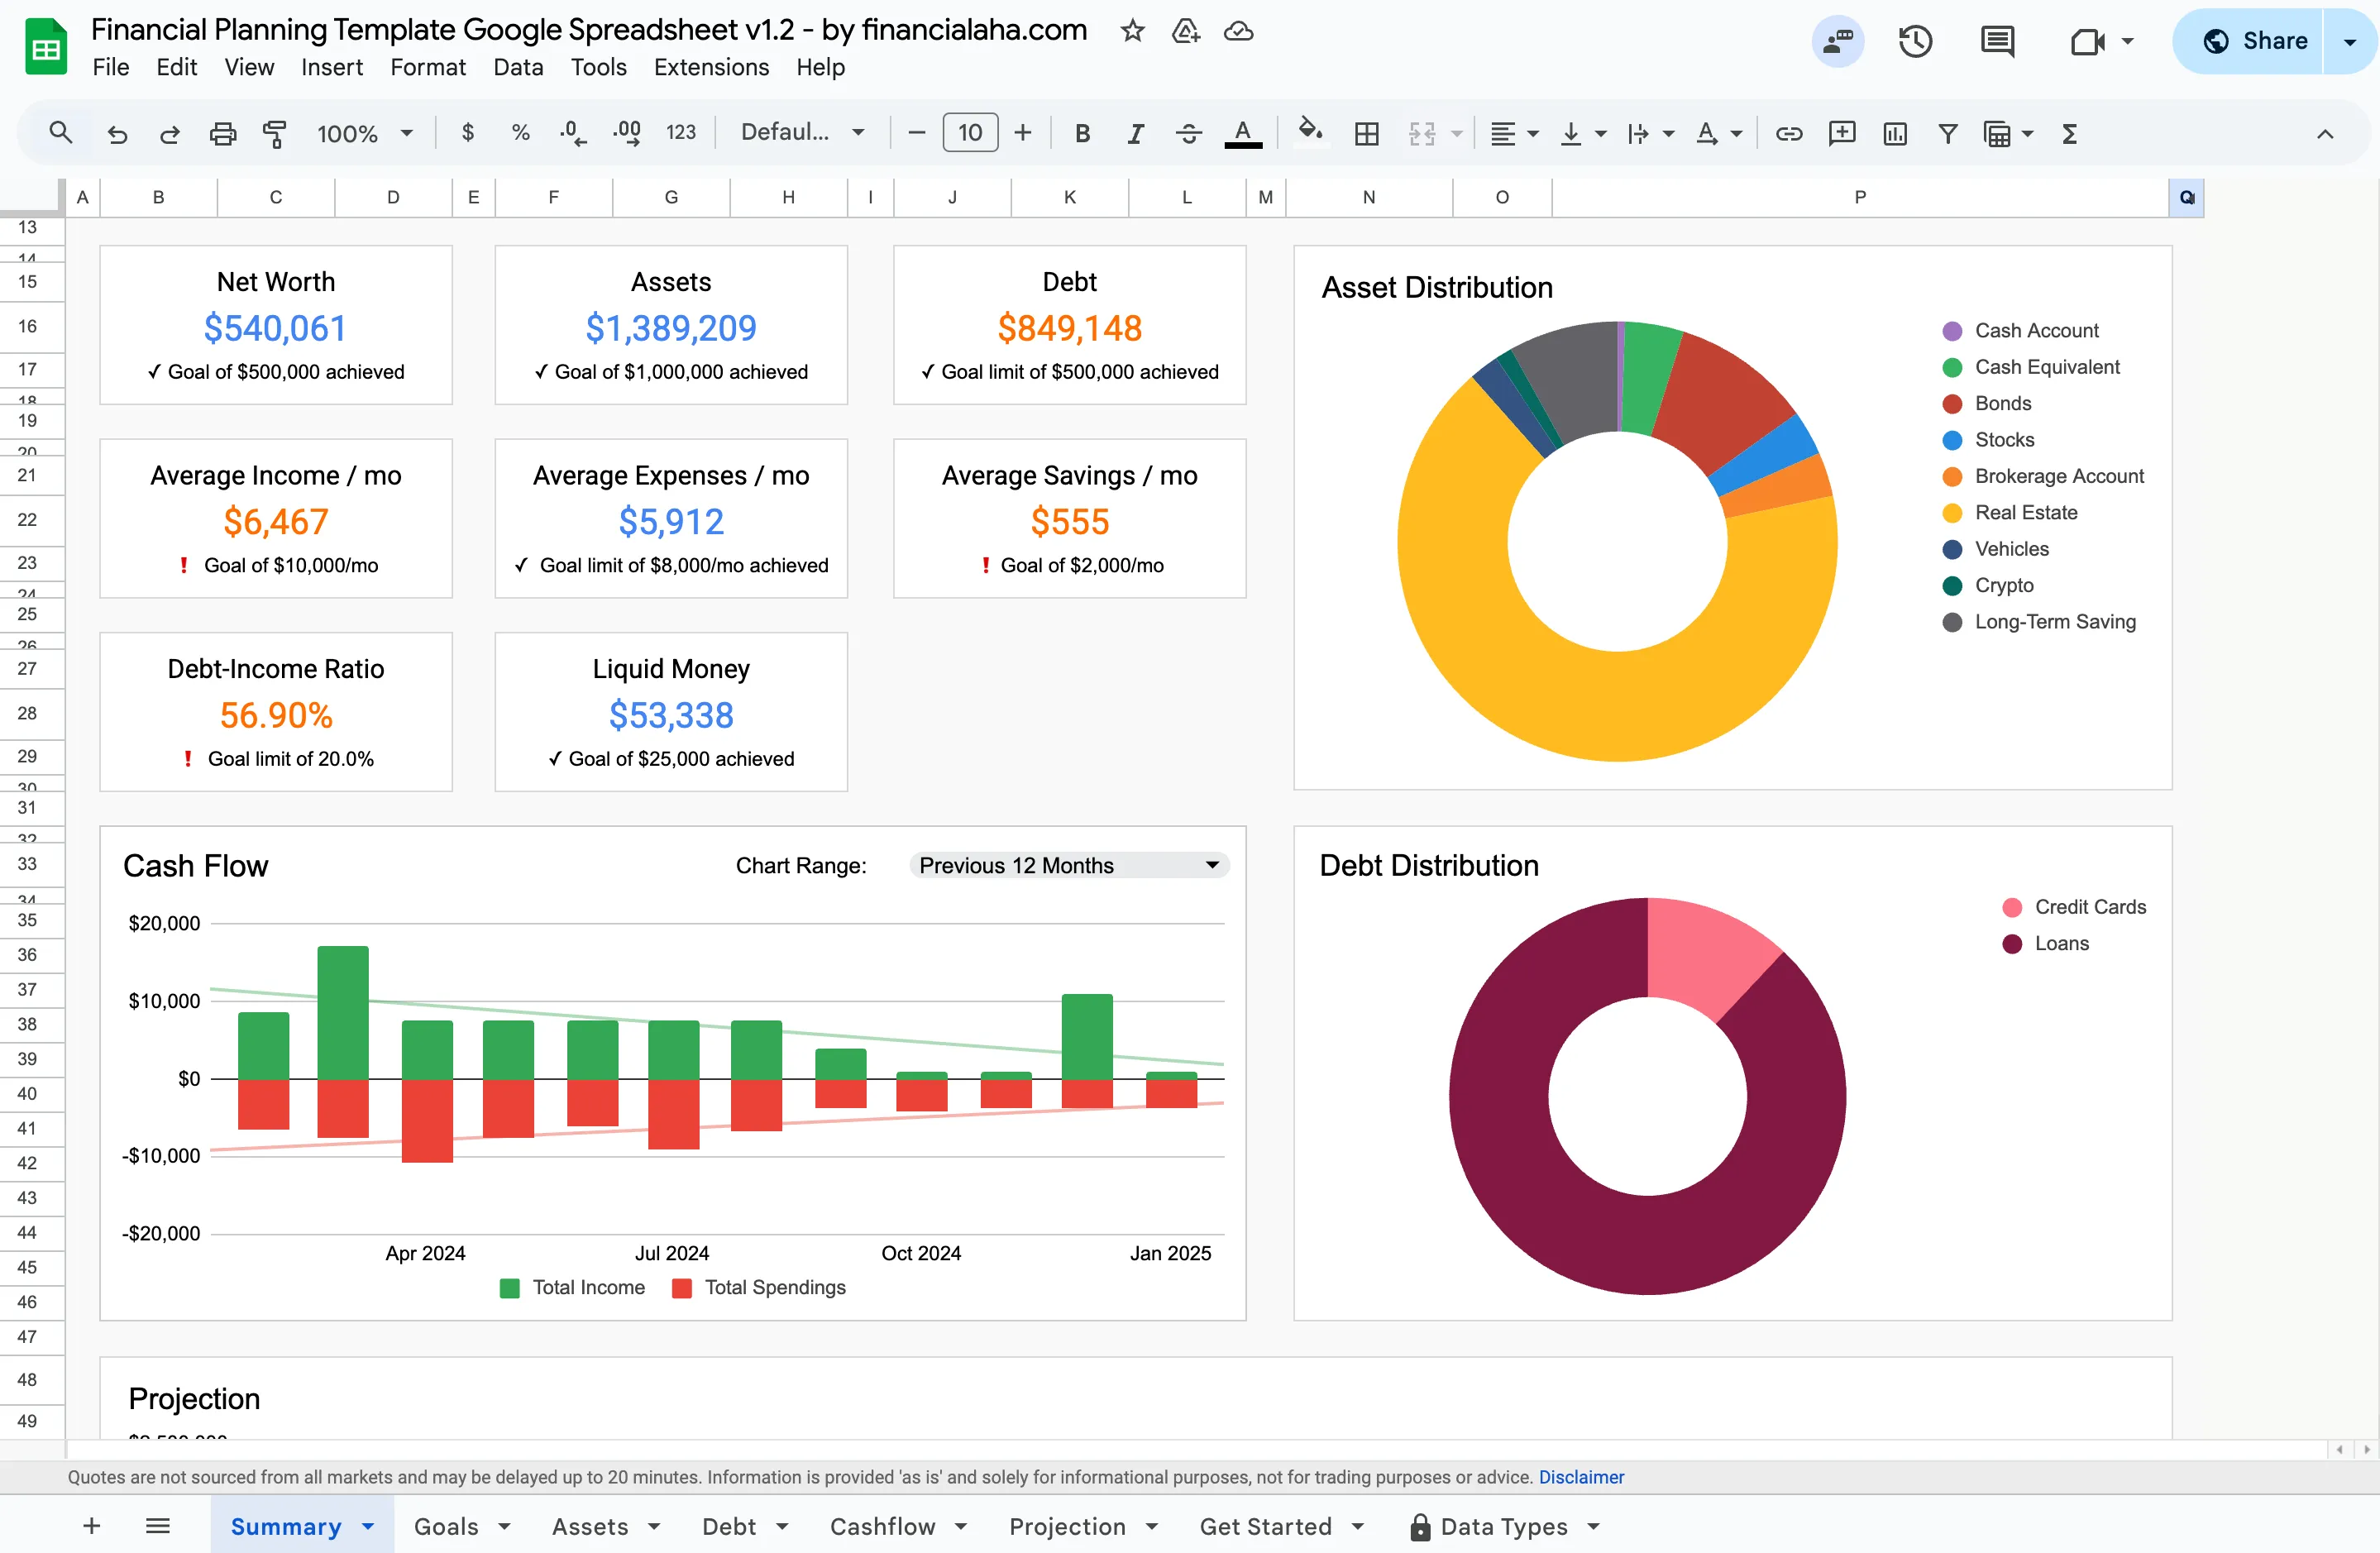 The Summary tab of the Financial Planning Template (Premium tier) rolls up the balance sheet and cash flow layers into one view.
Layer 1: Balance sheet. List every asset (cash, investments, retirement accounts, property) and every debt (mortgage, student loans, credit cards, car loans). Assets minus debts equals net worth, the foundation everything else builds on. If you want to work this figure out first, the Net Worth Calculator does it in your browser.
Layer 2: Cash flow. Track monthly income and expenses by category. The gap between the two is your savings rate, a figure many people watch closely because it drives how fast wealth accumulates over time.
Layer 3: Growth assumptions. Add expected return rates (5% to 7% after inflation for diversified portfolios is a common range), an inflation figure (the Federal Reserve aims for 2% over the longer run), and contribution amounts. The =FV() function projects how those contributions grow over time, and the Compound Interest Calculator shows the same math on a single balance if you want to sanity-check a cell.
Layer 4: Scenarios. Model different futures:
- Retire at 65 versus 55: how does the savings target change?
- Pay off the mortgage early versus invest the difference
- 6% returns versus 8% returns over 30 years
This forward-looking capability is the core difference. Apps tell you what happened. Spreadsheets help explore what might happen. To try one of these scenarios with your own numbers before wiring it into a sheet, the retirement calculator below runs the projection instantly.
Who Gets the Most Value from Spreadsheets
| Situation | Why a Spreadsheet Helps |
|---|---|
| Freelancer with variable income | Model best/average/worst case scenarios |
| FIRE community | Compare 3% vs 4% withdrawal rates across 40+ years |
| Family with overlapping goals | See how college savings, mortgage payoff, and retirement interact |
| Career changer | Model income gaps and runway calculations |
Templates vs Building from Scratch
Building from scratch provides full control but takes time. Templates offer a structured starting point with formulas already built, which is useful for getting past the blank-spreadsheet barrier.
The Financial Planning Template covers the balance sheet and cash flow layers in one Google Sheets file for a one-time $29. Assets, Debt and Cashflow tabs feed a Summary dashboard, a Goals tab holds the targets those figures are measured against, and every formula stays visible. The Projection tab turns six assumptions, income, expenses, assets growth, assets yield, debt change and inflation, into a month-by-month view of assets and debt running to an end year you set.
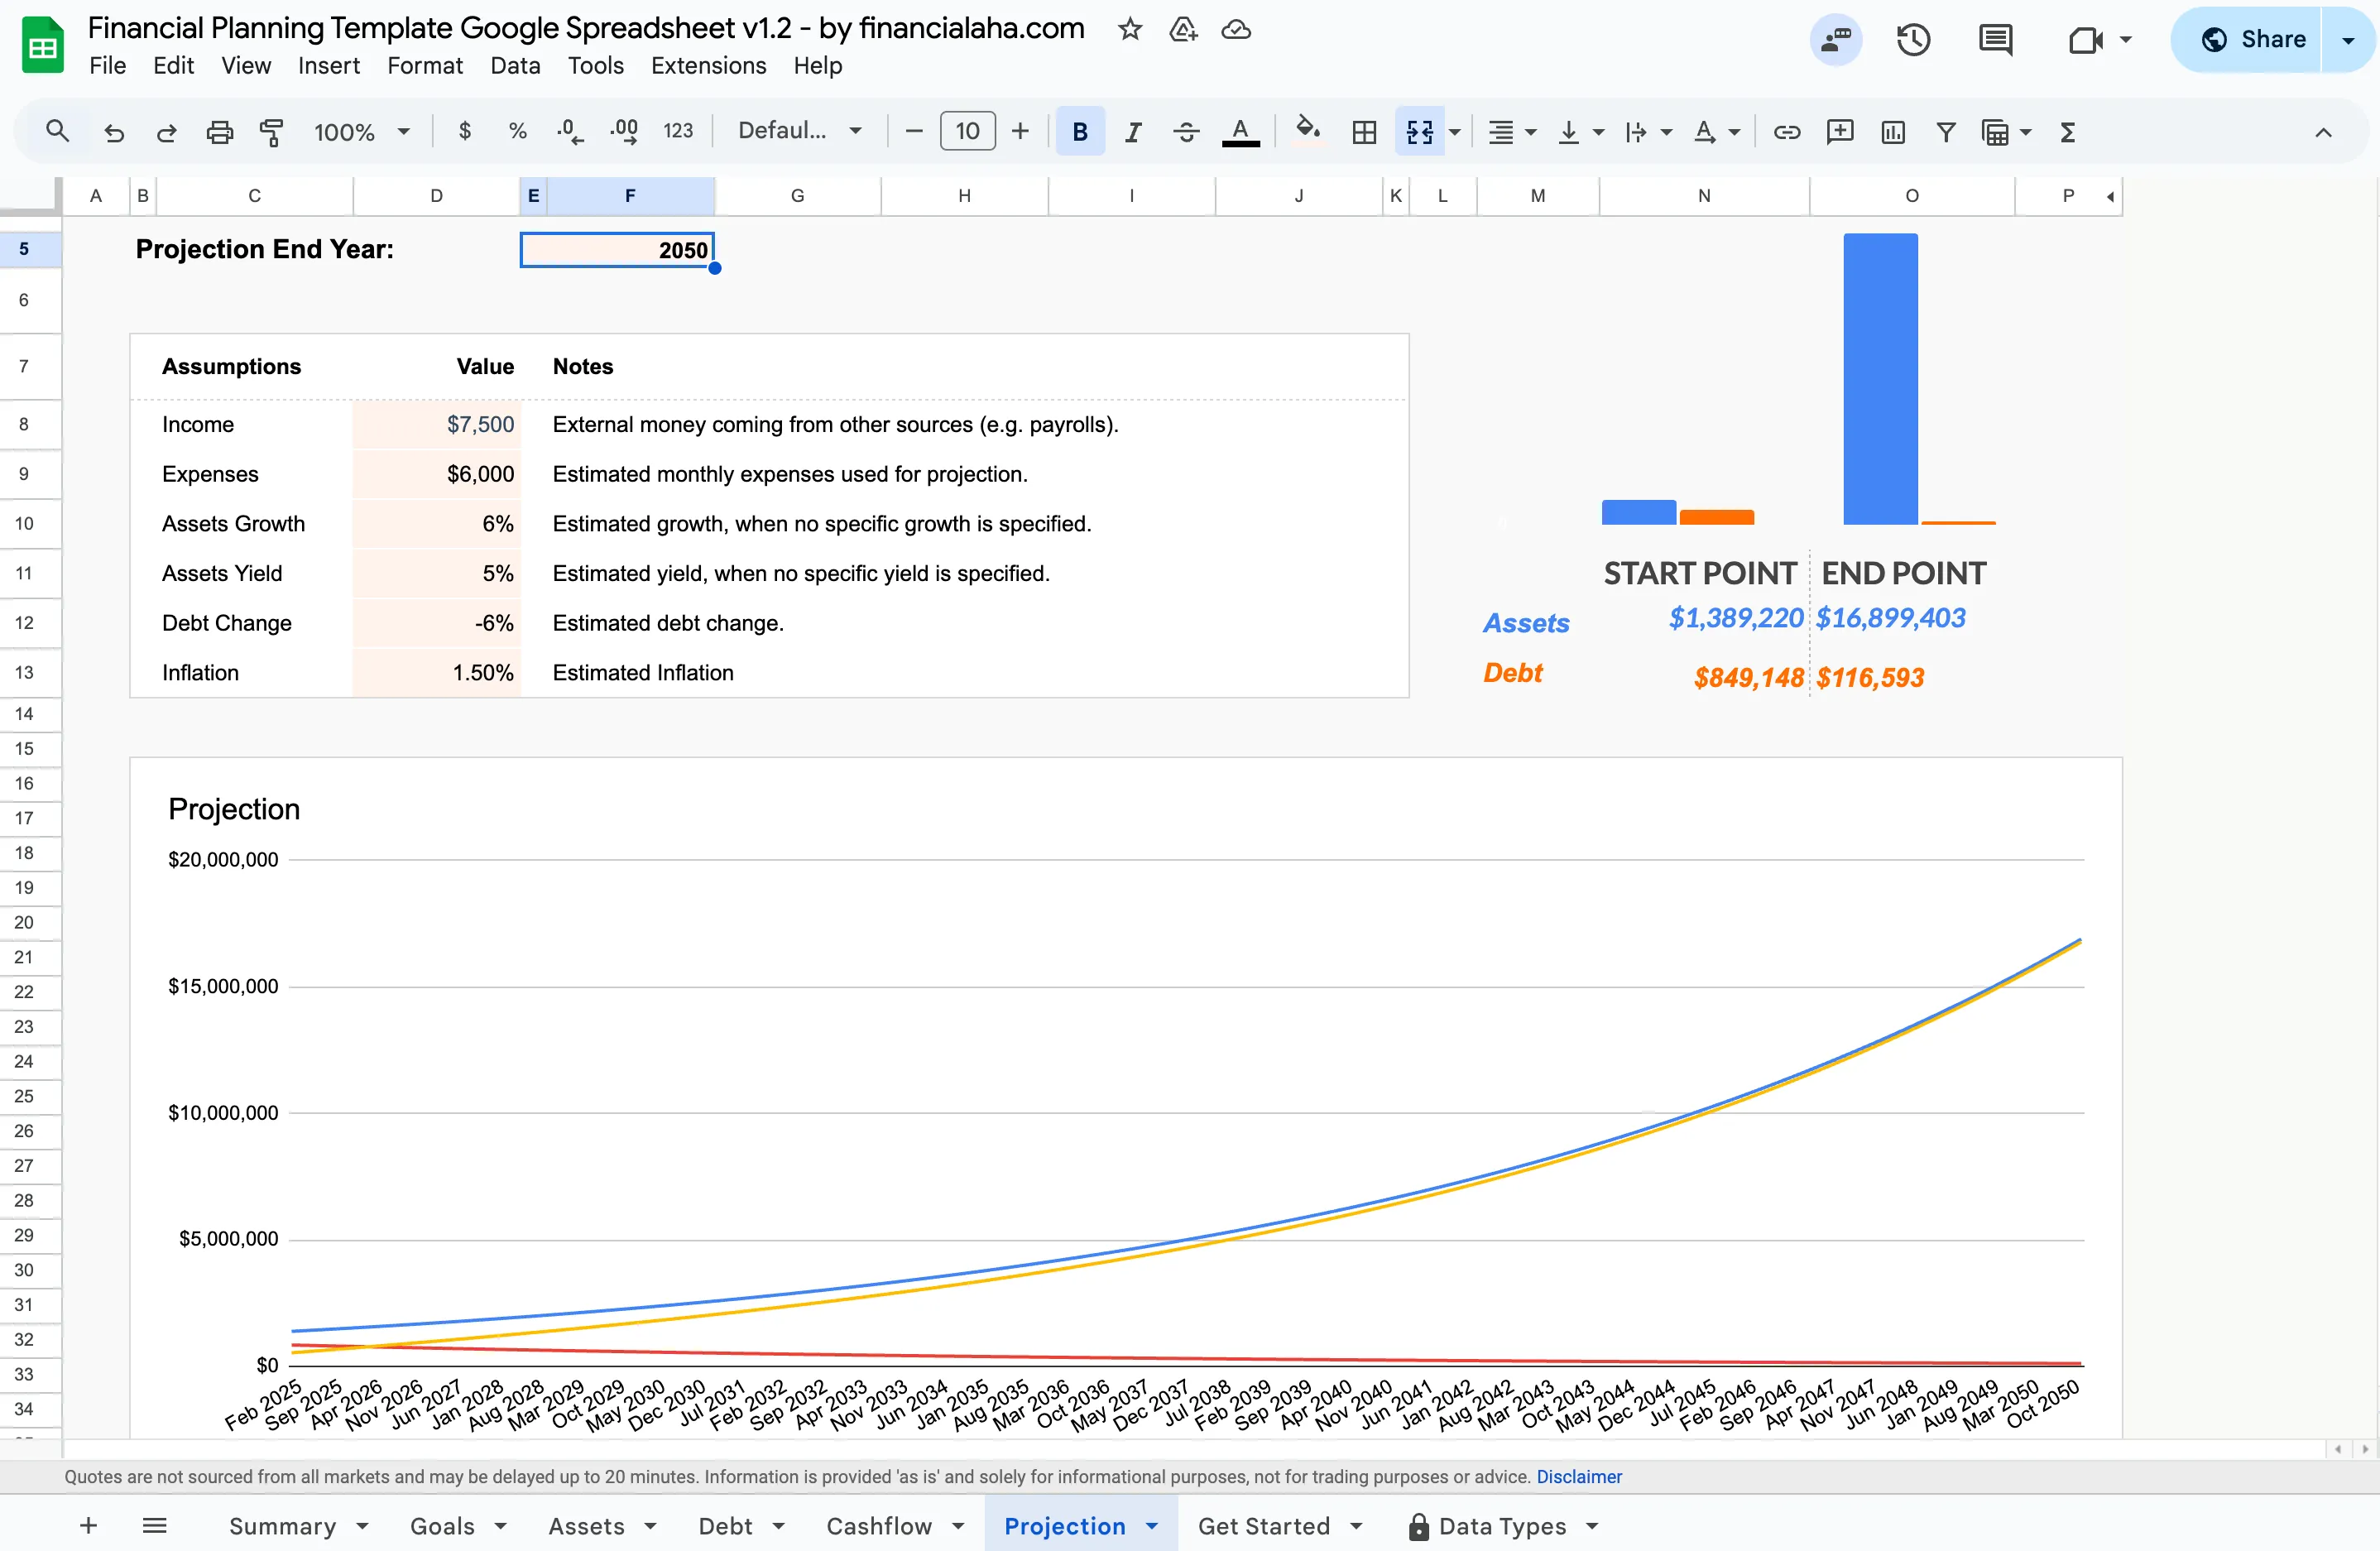 The Projection tab (Premium tier): change an assumption in the block on the left and the start-versus-end figures and the long-range chart update in place.
Related
- Financial Planning Template - Assets, debt, cash flow and long-range projections in one Google Sheets file
- Financial Planning Software or Spreadsheet? - How the two approaches compare
- How to Create an Advanced Personal Finance Tracker - DIY tutorial
- Budget Spreadsheets vs Apps - Feature-by-feature comparison
- Why Paying for a Financial Planning Tool Can Be Worth It - Where a paid app earns its cost, and where a template covers the same ground
- Google Sheets vs Notion for Personal Finance - How a spreadsheet compares to a workspace tool for tracking money
- Why I Switched From Apps to Spreadsheets - Personal experience
Frequently asked questions
What is a financial planning spreadsheet?
A structured file in Google Sheets or Excel that helps you track current finances and project your future, including sections for income, expenses, assets, debts, and investment assumptions.
Which is better for financial planning, Google Sheets or Excel?
Google Sheets is often chosen for easy sharing and cloud access. Excel is stronger for advanced formulas or very large datasets. Both handle financial planning well, and the FinancialAha Financial Planning Template is built for Google Sheets.
How can a spreadsheet help with retirement planning?
A spreadsheet holds the retirement variables together, savings, contributions, returns, and expenses, and shows how they interact. Change one number and the entire projection updates in place.
Do I need to know spreadsheet formulas to use a financial planning template?
No. A ready-made template ships with the formulas already written, so you type your numbers into labeled cells and the calculations update on their own. The formulas stay visible if you ever want to see or adjust how a figure is worked out.
Can a spreadsheet import my bank transactions automatically?
Not on its own. This is the one thing apps genuinely do better, since they connect to your accounts and pull transactions in. In a spreadsheet you enter or paste transactions yourself, which is the trade-off for keeping every number and formula under your control.
What happens to my data if a finance app shuts down?
When Mint closed in 2024, users had to export their history and move to another service. A spreadsheet lives in your own Google Drive or on your computer, so it keeps working regardless of what any company does.
Sources
- Why does the Federal Reserve aim for inflation of 2 percent over the longer run? - Board of Governors of the Federal Reserve System
- FV function - Google Docs Editors Help
About this article
Template tabs, inputs and outputs checked on 2026-09-10 against the shipped Financial Planning Google Sheet (Summary, Goals, Assets, Debt, Cashflow, Projection, Get Started, Data Types), along with its $29 price and Google Sheets compatibility. Inflation assumption anchored to the Federal Reserve's stated 2 percent longer-run objective. Last reviewed September 2026.