
Track each holding at the account level: retirement plans, taxable brokerage, real estate equity, and alternatives, each with a current value and a last-updated date. Pull live stock and ETF prices with GOOGLEFINANCE, refresh retirement and property values by hand each month, then roll every account into one assets-minus-liabilities net worth figure.
Net worth tracking without investments misses most of your wealth. A complete picture includes retirement accounts, brokerage holdings, and real estate, not just checking and savings. For many people, investments represent the majority of their net worth, which is exactly the gap between net worth and liquid net worth.
Understanding how to track these assets in a spreadsheet provides visibility into total wealth and progress over time. The tracking doesn’t need to be complicated, but it does need to be comprehensive and consistent.
Track it all: The Net Worth Tracker groups assets into eleven types, Bonds, Brokerage & Stocks, Cryptocurrency, Retirement Account and Real Estate among them, each with an allocation percentage and a column for every month you track.
Investment Categories to Track
Retirement accounts typically form the foundation: 401(k) and 403(b) plans, Traditional IRA, Roth IRA, SEP-IRA for self-employed individuals, and pension values if applicable. These tax-advantaged accounts often hold the largest portion of investment assets.
Taxable investment accounts include individual brokerage accounts, joint brokerage accounts, trust accounts, and robo-advisor accounts. These offer more flexibility than retirement accounts but different tax treatment.
Alternative investments round out the picture: real estate (primary home and rental properties), REITs, private equity or startup investments, cryptocurrency holdings, and collectibles with liquid markets. These may require different valuation approaches than publicly traded securities, and crypto and alternative investments in net worth tracking walks through the valuation and volatility questions each one raises.
Spreadsheet Structure for Investments
Basic Investment Tracking
A simple account-level view tracks the essentials without excessive detail:
| Account | Institution | Type | Current Value | Last Updated |
|---|---|---|---|---|
| 401(k) | Fidelity | Retirement | $125,000 | Feb 15 |
| Roth IRA | Vanguard | Retirement | $45,000 | Feb 15 |
| Brokerage | Schwab | Taxable | $30,000 | Feb 15 |
| HSA | HealthEquity | Tax-advantaged | $8,500 | Feb 15 |
For more granular tracking, additional columns can capture contributions (year-to-date), gains and losses, asset allocation percentage, and account type (tax-deferred, Roth, or taxable). This level of detail helps answer questions about where growth is coming from and how your allocation looks across account types.
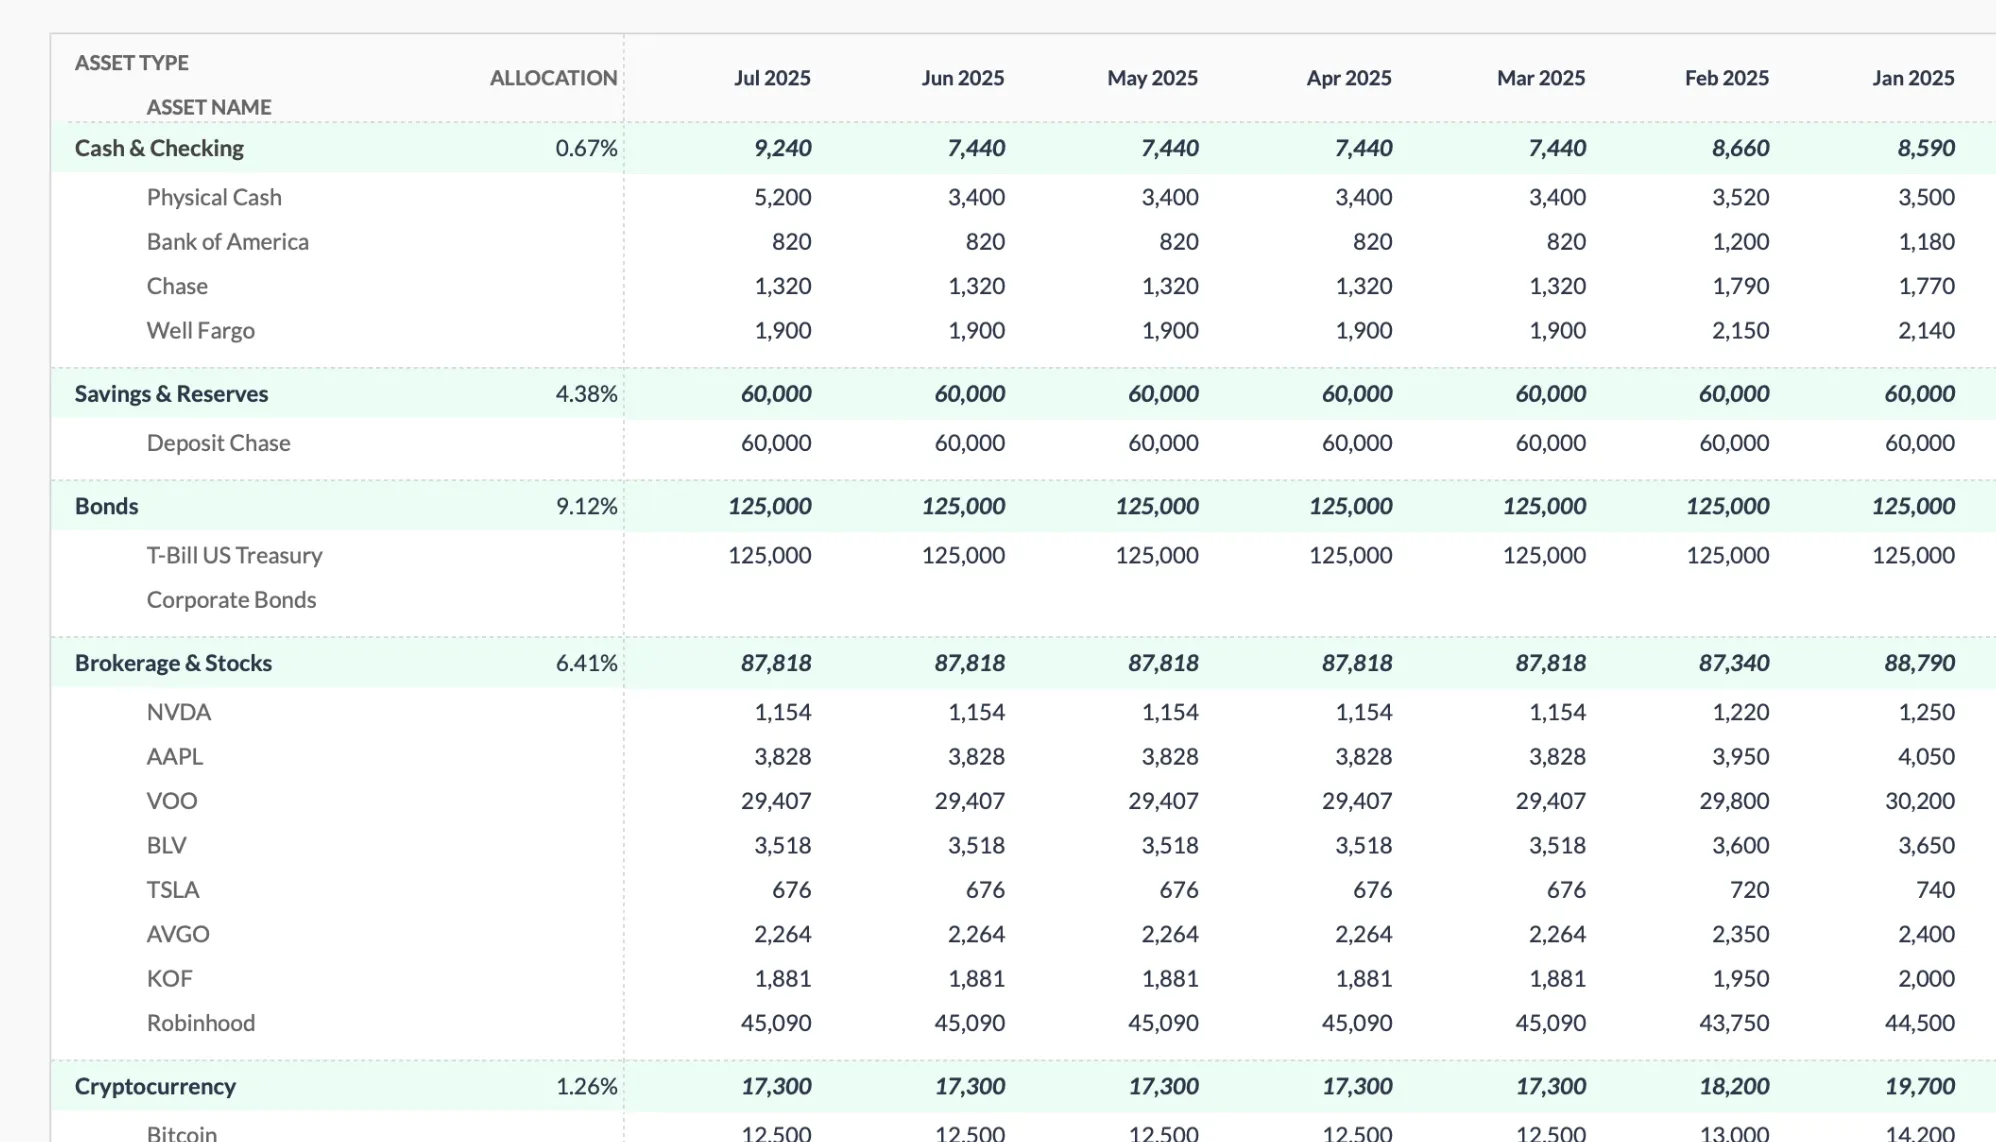
The Net Worth Tracker (Premium) works at the account level: each asset type expands into named holdings, an allocation percentage sits next to each type, and a column per month keeps a running history. Values go into those monthly columns by hand, so the sheet holds the figures you enter rather than a live price feed.
Automatic Price Updates with Google Finance
Google Sheets can pull current stock prices automatically, reducing manual data entry. The GOOGLEFINANCE function does the work: =GOOGLEFINANCE("AAPL","price") returns Apple’s latest quote. This works for most publicly traded securities, though the price can lag the market by up to 20 minutes.
Building a portfolio tracker with this function creates a self-updating system:
| Symbol | Shares | Price Formula | Current Value |
|---|---|---|---|
| VTI | 50 | =GOOGLEFINANCE(“VTI”,“price”) | =B2*C2 |
| VXUS | 30 | =GOOGLEFINANCE(“VXUS”,“price”) | =B3*C3 |
| BND | 25 | =GOOGLEFINANCE(“BND”,“price”) | =B4*C4 |
The value column automatically updates when prices change. However, limitations exist: Google Finance doesn’t cover all securities, mutual fund prices may have slight delays, and cryptocurrency requires different data sources.
Retirement Account Tracking
Retirement accounts don’t have real-time tracking available in spreadsheets the way individual stocks do. Two main approaches work for keeping values current.
Manual updates involve logging into each account monthly and recording balances. This takes 10-15 minutes per month but provides accurate snapshots. Account aggregation services like Tiller Money can automatically pull account balances into spreadsheets for those who want automation.
Tracking contributions separately from growth provides insight into investment performance:
| Account | Starting Value | Contributions | Current Value | Growth |
|---|---|---|---|---|
| 401(k) | $100,000 | $15,000 | $125,000 | $10,000 |
| Roth IRA | $40,000 | $7,000 | $45,000 | -$2,000 |
Growth equals Current Value minus Starting Value minus Contributions. This calculation separates what the market did from what you contributed.
Real Estate in Net Worth
For primary residences, include home equity rather than full home value: Home Equity equals Estimated Home Value minus Mortgage Balance. For home value estimates, recent comparable sales or online estimators serve as rough guides.
Rental properties deserve separate tracking. Record property address or identifier, estimated value, mortgage balance, and net equity for each. This level of detail matters for properties that represent significant portions of net worth.
Annual updates are typically sufficient for real estate valuations unless significant market changes occur. Monthly Zillow updates tend to add noise without meaningful information, and property values don’t fluctuate the way stock prices do.
Asset Allocation View
Total investment value is one number, but allocation shows the full picture. Understanding what you actually own and where any imbalances might be requires looking at the composition:
| Asset Class | Target % | Current Value | Actual % |
|---|---|---|---|
| US Stocks | 60% | $120,000 | 57% |
| International | 20% | $45,000 | 21% |
| Bonds | 15% | $35,000 | 17% |
| Cash | 5% | $10,000 | 5% |
| Total | 100% | $210,000 | 100% |
When actual percentages drift significantly from targets, rebalancing may be worth considering. This comparison between target and actual makes drift visible.
Tax-Location Tracking
Different account types have different tax treatments. Understanding what’s held where helps with tax planning and withdrawal strategies:
| Account Type | Value | Percentage |
|---|---|---|
| Tax-Deferred (401k, Traditional IRA) | $150,000 | 50% |
| Tax-Free (Roth IRA, Roth 401k) | $75,000 | 25% |
| Taxable (Brokerage) | $75,000 | 25% |
Planning implications differ by type: tax-deferred accounts are taxed at withdrawal as ordinary income, Roth accounts have no tax on qualified withdrawals, and taxable accounts incur capital gains taxes on sales. The distribution across these types affects retirement income planning significantly.
Historical Tracking
Recording total investment value at the same time each month creates a dataset that shows progress over time:
| Date | Retirement | Brokerage | Real Estate | Total |
|---|---|---|---|---|
| Jan 2026 | $165,000 | $28,000 | $150,000 | $343,000 |
| Feb 2026 | $170,000 | $30,000 | $150,000 | $350,000 |
Plotting monthly totals visualizes investment growth in ways numbers alone cannot. This perspective proves especially helpful during market downturns - seeing the long-term trend puts temporary declines in context. Long-term trends matter more than monthly noise.
Common Investment Tracking Mistakes
Checking too often leads to emotional reactions to normal volatility. Daily portfolio checking creates anxiety without improving outcomes. Monthly or quarterly updates are sufficient for most investors, a question covered in more depth in how often to calculate net worth.
Omitting private investments understates true wealth. If you have private company equity, K-1 partnerships, or other illiquid investments, include them with conservative valuations rather than leaving them out entirely.
Forgetting to update defeats the purpose of tracking. Set a recurring calendar reminder to update investment values - stale data provides false comfort or false alarm.
Double-counting happens when tracking individual stock holdings AND total account value and then adding both. The holdings are already included in the account value; adding them separately counts the same money twice.
Integration with Net Worth Tracker
Investments are one component of total net worth. The complete picture includes all assets and liabilities:
| Category | Amount |
|---|---|
| Assets | |
| Cash & Savings | $25,000 |
| Investments | $300,000 |
| Real Estate Equity | $150,000 |
| Other Assets | $15,000 |
| Total Assets | $490,000 |
| Liabilities | |
| Mortgage | $200,000 |
| Other Debt | $5,000 |
| Total Liabilities | $205,000 |
| Net Worth | $285,000 |
To put your own numbers through the same assets-minus-liabilities math, the calculator below returns a figure instantly:
The Net Worth Tracker runs the same assets-minus-liabilities math on its Summary tab, next to a Net Worth Over Time area chart, the split across liquid, semi-liquid and illiquid assets, and a debt-to-asset ratio.
Related
- Net Worth Tracking for Beginners
- How to Calculate Your Net Worth in Google Sheets
- Google Sheets vs. Excel for Net Worth Tracking
- Net Worth Calculator - add up assets and liabilities for an instant snapshot
- Net Worth Tracker - track every investment in one place
Frequently asked questions
Do I need to track individual stocks in my net worth spreadsheet?
For diversified funds like index funds and ETFs, tracking total account value is sufficient. Individual stock tracking adds complexity without much benefit for most investors.
How do I value private investments in my net worth?
Use the most recent valuation from funding rounds or annual statements. When uncertain, conservative estimates prevent overstating wealth.
Should I include employer stock options in my net worth?
Most people include vested, in-the-money options. Unvested or underwater options can create an inflated picture if included.
How often should I update investment values in my spreadsheet?
Monthly updates are standard for most investors. Quarterly works for set-and-forget portfolios. Daily updates are too frequent and can lead to emotional reactions.
Does GOOGLEFINANCE work for mutual funds and crypto?
It covers most exchange-listed stocks and ETFs, though quotes can lag the market by up to 20 minutes. Coverage of mutual funds is patchy, and cryptocurrency needs a separate data source, so those holdings are usually entered by hand.
Should I use my home's full value or just the equity in net worth?
Net worth counts what you own minus what you owe, so a primary home is usually entered as equity - estimated value minus the outstanding mortgage. Listing the full value as an asset while also carrying the mortgage as a liability reaches the same figure, as long as you do not do both inconsistently.
Sources
- Roth IRAs - Internal Revenue Service
- Topic no. 451, Individual retirement arrangements (IRAs) - Internal Revenue Service
- Topic no. 409, Capital gains and losses - Internal Revenue Service
- GOOGLEFINANCE function - Google Docs Editors Help
About this article
Account-type tax treatment checked against IRS guidance on Roth IRAs, traditional IRAs, and capital gains. Template asset types, allocation columns and Summary outputs checked on 2026-09-10 against the shipped FinancialAha Net Worth Tracker Google Sheet (Summary, Assets, Setup, Instructions tabs). Last reviewed September 2026.