
Tiller syncs bank transactions into Google Sheets for $99 a year, using aggregators that hold your bank login and covering mainly US and Canada banks. The one-time alternative is the Monthly Budgeting Template ($29): you log or paste transactions yourself into a workbook you own, with a dashboard, categories, and savings goals already built. It works in any currency with no aggregator, and over 10 years costs $29 against Tiller's $990.
Tiller does one thing well: it pulls your bank transactions into a Google Sheet automatically, which removes the manual-entry step that stalls a lot of spreadsheet budgeting before it ever changes any behavior. If that automatic sync is the feature you cannot do without, it is worth paying for.
This post is for everyone else, the people who’ve tried bank-sync tools and found that the automation created a new problem (too many miscategorizations to review, or too many accounts to keep straight) without solving the underlying one (actually engaging with the numbers). The one-time path is the Monthly Budgeting Template ($29 once): transactions, categories, a planned-vs-actual dashboard, and savings goals already wired, in a file you own outright.
What Tiller actually does
Tiller is two things bundled together:
- Aggregator-based bank sync. Through Plaid and Yodlee, it connects to your bank and pulls daily transactions into a Google Sheet (or Excel workbook) you own. Coverage is concentrated in the US and Canada.
- Foundation Template (and a library of others). A pre-built Google Sheets workbook with a dashboard, categorization rules, and reports.
You can buy each separately in spirit. The aggregator is the thing you’re really paying for; the templates are the marketing wrapper.
The price is $99 a year after a 30-day free trial. Tiller lists a single plan, so once the trial ends there is no free tier to fall back to.
What you give up to get the sync
Three things, in order of how much they tend to bother people.
Recurring cost. $99 a year for as long as you use it. Over 10 years that’s $990. Over 30 years (a typical adult planning horizon) it’s $2,970 in 2026 dollars, before any inflation adjustments.
Bank credentials in a third party’s hands. The aggregator (Plaid or Yodlee) holds the connection to your bank login. Both are established fintech providers with reasonable security, but each is another holder of high-value access. Some people are fine with this; some aren’t.
US/Canada bank coverage. If you bank outside the US or Canada, Tiller is mostly off the table. Coverage in other countries is limited or nonexistent.
If none of those bother you, Tiller is a good product. The rest of this post covers what you do if any of them do.
The 10-year cost comparison
Headline math.
| Option | Year 1 | Year 5 | Year 10 | Year 30 |
|---|---|---|---|---|
| Tiller ($99/yr) | $99 | $495 | $990 | $2,970 |
| FinancialAha Monthly Budgeting Template ($29 once) | $29 | $29 | $29 | $29 |
The spreadsheet is one-time. If we ship a major update or a new template version, customers get it via email at no additional charge. The file works in your Google Drive forever; we don’t run anything on your behalf that could be turned off.
You’re paying for two different things: Tiller is buying you automation; we’re selling you a tool. Both are legitimate products, with different costs and different ownership models.
What our spreadsheet actually does
The Monthly Budgeting Template does what Tiller’s Foundation Template does for day-to-day money, with manual entry instead of bank sync.
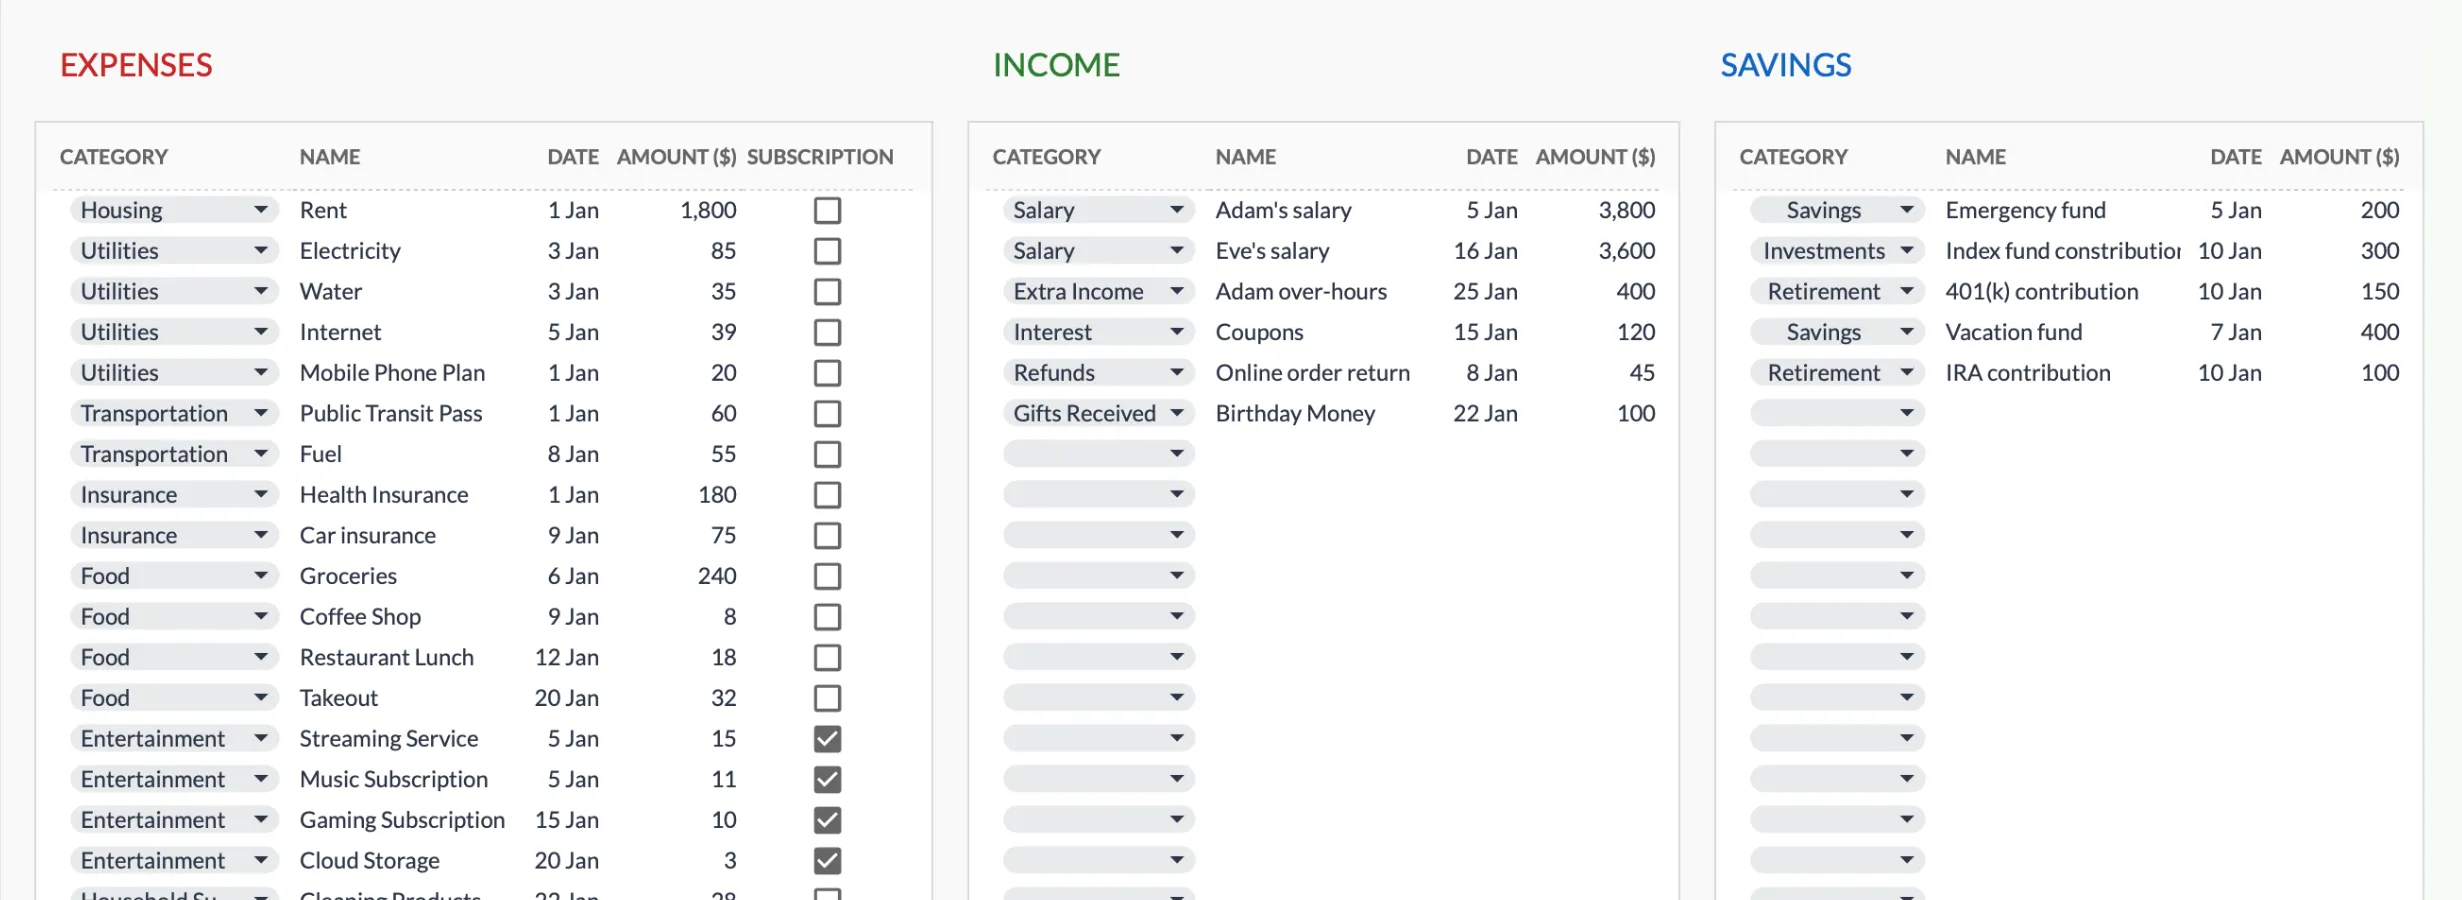
Transaction entry in the Monthly Budgeting Template (Premium tier): category, name, date, and amount, split across Expenses, Income, and Savings.
Transactions. Category, name, date, and amount, entered across separate Expenses, Income, and Savings tables. The Expenses table adds a subscription checkbox, which feeds a recurring-spend total on the dashboard. You type rows in or paste from a bank CSV export.
Dashboard. Budget status, alerts, balance, income, expenses, and savings up top, then actual vs planned for the top categories in each section, with separate alert panels listing the categories outside the thresholds you set. Distribution charts show where the money goes.
Categories. 17 built-in expense categories, 11 income and 3 savings, each picked from a dropdown in the Transactions sheet. Rename them or add your own in the Categories sheet.
Savings goals. Set a target amount per goal and track progress; the dashboard shows overall and per-goal status.
Budget rules. The dashboard carries a 50/30/20 panel, fed by a Need or Want tag on each expense category, and a zero-based panel that reports what is left over after expenses and savings.
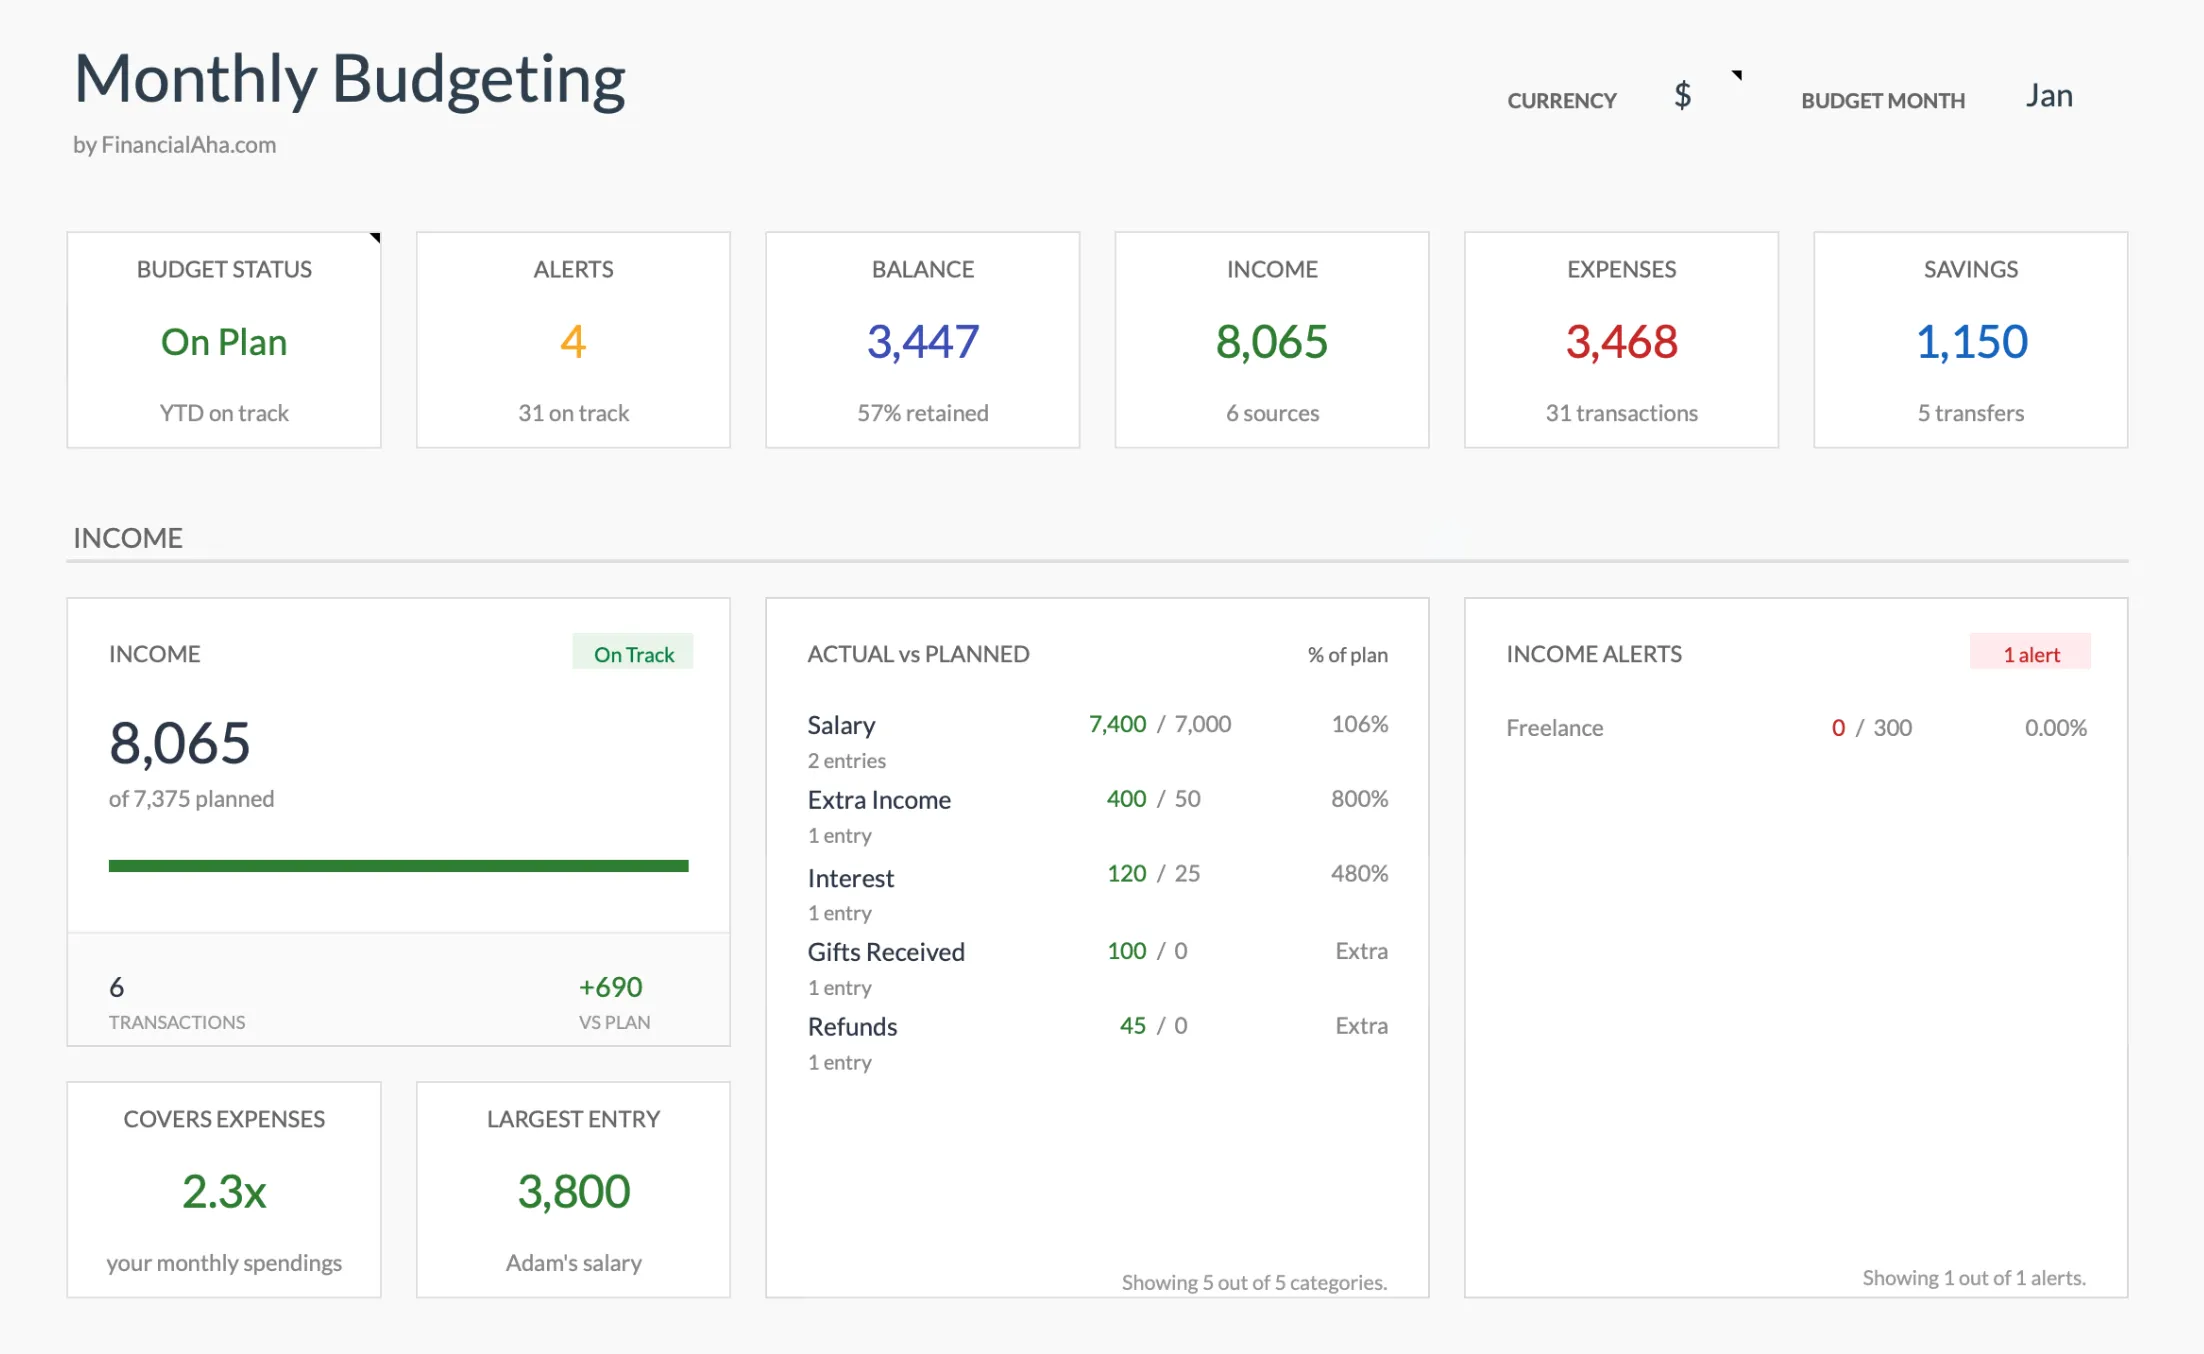
The dashboard totals income, expenses, and savings, then compares actual to planned by category with alerts (Premium tier).
For the bigger-picture view Tiller’s dashboard also shows (net worth across assets and debts, cash flow, and multi-year projections), the Financial Planning Spreadsheet ($29 once) covers that side. Many people run the budget template for the month-to-month and the planning template for the long view.
The biggest difference from Tiller: no daily auto-sync. You log transactions once a week (15 minutes for most people) or paste a CSV monthly.
What manual entry actually feels like
Honest assessment based on running both side by side.
Time per week: 12 to 18 minutes for someone with 30 to 50 transactions, mostly cards. Less if you have a single account; more if you split across many.
Mistakes: A handful per month, mostly category misassignments. Same as Tiller, where the auto-categorizer is good but not perfect.
What’s harder than Tiller: Catching a missed week. If you skip two weeks, the backlog feels like work. Tiller handles this for you.
What’s easier than Tiller: Reconciling. When the dashboard number is off, you can trace it to a specific manually entered row. With auto-sync, you sometimes spend 10 minutes figuring out why the categorizer assigned an Amazon charge to “shopping” instead of “groceries.”
The honest summary: manual entry takes more time per week but takes less time per month overall, because the recovery cost of categorization errors is lower.
When to pay for Tiller anyway
Three situations where the sync is worth $99 a year.
You have a high transaction volume across many accounts. A household with 5 cards, 3 bank accounts, and a brokerage with regular automated investments might process 200 transactions a month. Manual entry at that volume is real work; Tiller’s automation is genuine value.
You’ve tried manual entry and stopped. Some people just won’t log transactions consistently. If past attempts have stalled, paying for the automation is the right call. Half the value of any budget tool is using it; if Tiller gets you to use one, $99 is cheap.
You’re a US/Canada single-bank user with high category-discipline. If your bank is one of the aggregators’ well-supported ones and you’re patient about training the categorizer, Tiller’s first-party experience is the smoothest in the category.
When the spreadsheet wins
Five situations where a one-time template is the better fit.
You bank outside the US or Canada. Tiller’s coverage is geographic; the spreadsheet has no geographic constraint.
You’re uncomfortable handing your bank credentials to an aggregator. This is a personal-risk-tolerance decision. Some people are fine with Plaid or Yodlee; some won’t do it. Both positions are defensible.
You’ve stalled on past Tiller subscriptions because you weren’t checking it weekly anyway. If you weren’t logging in regularly, you weren’t getting value from the sync. Manual is fine.
You want connected templates beyond just budgeting. Our Financial Planning template pairs with the Net Worth Tracker, Annual Tax Planner, and Retirement Projections, each a one-time purchase. Tiller has its own template library, all under the single subscription.
You want the lowest possible recurring cost. $29 once is less than four months of Tiller at $99 a year, and the spreadsheet never renews. Every year after the first only widens the gap.
A migration path from Tiller
If you’ve been on Tiller and want to try a one-time template without losing your data, here’s the path.
- In Tiller, go to your Transactions sheet. Use Tiller’s “Export” or simply Copy All / Paste Special as Values into a new sheet.
- Save the data as a CSV.
- Open the Monthly Budgeting Template and go to the Expenses and Income tables.
- Paste your CSV data into rows. The Expenses and Income tables both run category, name, date, then amount, so reorder your export columns to match.
- Reconcile this month’s total against your bank balances. If they match, the migration is complete.
- Cancel Tiller before the next billing date.
- The next month, log transactions manually using a weekly habit (Sunday evening tends to work for most people).
Most people who do this exercise find the transition painless. The friction comes from the new habit, not from the tool change.
What I’d add for someone who values automation
Three workflows that get most of the way to Tiller’s automation without Tiller.
Weekly bank CSV download. Most banks let you export a date-range CSV in 30 seconds. A weekly Friday-evening export, paste into the template, takes 5 minutes. That covers the same ground as a sync, with a paste instead of an aggregator.
Your own payee-to-category lookup. Build a small table on a spare sheet that maps common payees to categories, so “Whole Foods” resolves to “Groceries”. An INDEX/MATCH or VLOOKUP against it resolves most rows before you paste them into the Transactions tables. This is something you add; the template does not ship with it.
Read-only exports for those who want them. Many banks and brokerages offer downloadable QFX/OFX files or read-only data access. A short Apps Script can pull and append those. This is for spreadsheet-comfortable users; not necessary for most.
These aren’t required. The base template works fine without them. They’re optional ways to reduce the manual-entry burden if it’s the only thing keeping you on Tiller.
Get the template
The concrete next step is the migration path above: export your Tiller transactions, paste them into a template you own, and cancel before the next renewal. The three files that fit that path:
- Monthly Budgeting Template ($29 once): transactions, categories, a planned-vs-actual dashboard, and savings goals. The closest one-file replacement for Tiller’s day-to-day tracking.
- Financial Planning Spreadsheet ($29 once): net worth across 15 asset types and two debt types (credit cards and loans), month-by-month cash flow, and a projection out to an end year you set. The long-view companion.
- Personal Finance Bundle ($59): Financial Planning, Net Worth Tracker, and Annual Tax Planner together.
Related
Frequently asked questions
Does the spreadsheet sync with my bank?
No. You enter transactions manually or paste a weekly CSV from your bank. This is the trade-off for a one-time cost and no aggregator.
How long does manual entry take per week?
Most people report 12 to 18 minutes for a typical weekly transaction load. Higher volumes scale roughly linearly.
Can I use the spreadsheet outside the US?
Yes. The template is currency-agnostic. A currency cell sits at the top of the dashboard, and the symbol you type there flows through every money label in the workbook. Categories and dashboard work the same way regardless of country.
What if Tiller raises prices or shuts down?
For Tiller customers, the file would still exist in your Google Drive but the sync would stop. The template approach has no equivalent risk because there's nothing to shut down.
Can I run both Tiller and the spreadsheet at once?
Yes. People sometimes use Tiller for the transactions and a template for the higher-level planning (net worth, projections, goals). Eventually they consolidate to one. The Monthly Budgeting Template handles transaction logging fine on its own.
Which template replaces Tiller, the budget one or the planning one?
For Tiller's core job (logging and categorizing transactions with a spending dashboard), the Monthly Budgeting Template is the closest match. The Financial Planning Spreadsheet covers the higher-level side Tiller's dashboard also shows: net worth across assets and debts, cash flow, and multi-year projections. Some people use one, some use both.
Sources
- Tiller Pricing - Tiller
About this article
Tiller's price and free-trial length were checked against the company's published pricing page. Template sheets, inputs and outputs checked on 2026-09-10 against the shipped Monthly Budgeting workbook (Summary, Budget Plan, Transactions, Goals, Categories, Setup) and the Financial Planning workbook (Summary, Assets, Debt, Cashflow, Projection, Data Types). Last reviewed September 2026.