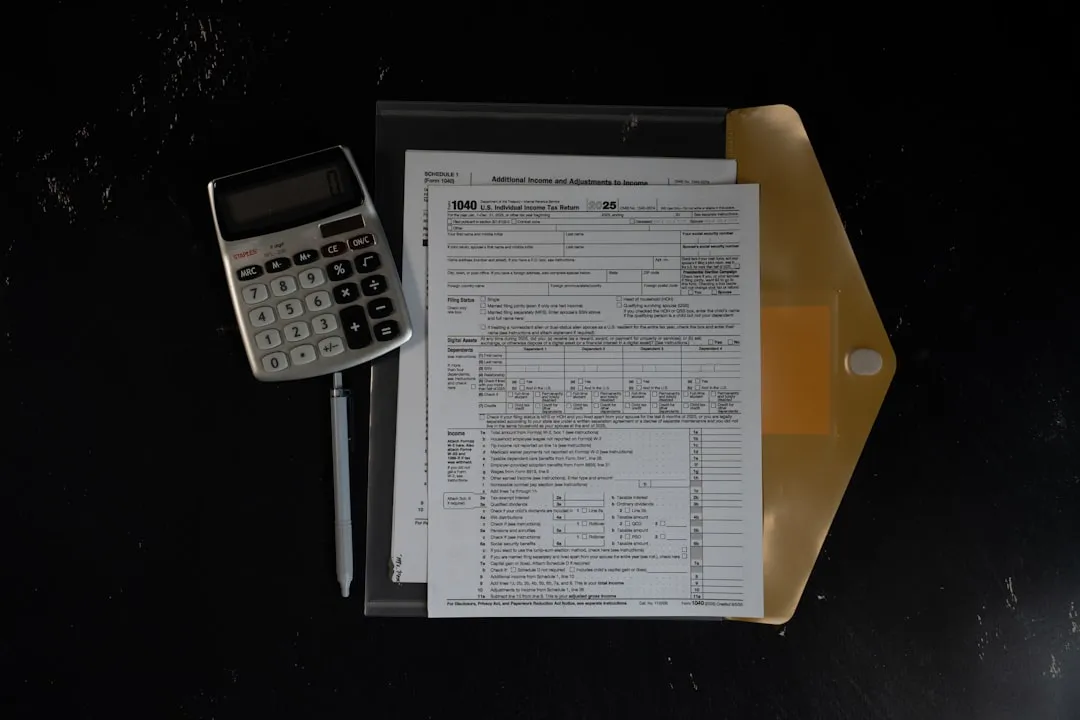
Earning $80,000 in the "22% bracket" does not mean a $17,600 tax bill. Only the top slice of income is taxed at 22%, so the effective rate on $80,000 of taxable income lands near 15.4%. This guide walks the 2026 federal brackets, the gap between marginal and effective rates, and how deductions shrink the income the brackets act on.
Here is something worth clearing up: if you earn $80,000 and you’re “in the 22% bracket,” your tax bill is not $17,600. It’s not even close. The bracket system doesn’t work that way, and misunderstanding it leads people to turn down raises, avoid side income, and make decisions based on a number that isn’t real.
The Income Tax Calculator takes your gross income, your total deductions and the federal, state and local rates you enter, then shows the tax, your effective rate and what is left over. It works from those flat rates rather than the bracket table below, so the federal rate you type is the one it applies. No signup required.
How Brackets Actually Work
The US tax system is progressive, meaning income gets taxed in layers. Each layer has its own rate. For a single filer in 2026, the IRS sets seven brackets:
| Taxable Income | Rate |
|---|---|
| $0 - $12,400 | 10% |
| $12,401 - $50,400 | 12% |
| $50,401 - $105,700 | 22% |
| $105,701 - $201,775 | 24% |
| $201,776 - $256,225 | 32% |
| $256,226 - $640,600 | 35% |
| Over $640,600 | 37% |
On $80,000 in taxable income, the tax works out like this:
- 10% on the first $12,400 = $1,240
- 12% on $12,401 to $50,400 = $4,560
- 22% on $50,401 to $80,000 = $6,512
- Total: $12,312
The marginal rate, meaning the rate on that last dollar, is 22%. The effective rate, total tax divided by total income, is 15.4%. That’s the real number, and it’s always lower than the bracket you “fall in.”
This is why a raise never makes you worse off after taxes. A $5,000 raise taxed at 22% still puts $3,900 in your pocket. The other $80,000 you were already earning doesn’t get taxed any higher.
From Salary to Taxable Income: The Steps
The path from what you earn to what you’re taxed on has several stops, and each one reduces the number:
Gross Income - everything from all sources.
Minus above-the-line deductions: 401(k) contributions, HSA contributions, student loan interest, traditional IRA contributions. These reduce income regardless of whether you itemize.
Equals Adjusted Gross Income (AGI) - the number that shows up everywhere in tax planning.
Minus standard deduction or itemized deductions.
Equals Taxable Income - the number that actually enters the bracket calculation.
Minus tax credits (child tax credit, education credits, energy credits) applied directly against the tax owed.
Equals what you owe (or what’s refunded, depending on withholding).
Every dollar of deduction saves you money at your marginal rate. Every dollar of credit saves you a full dollar. Credits are more valuable, which is why the tax code uses them sparingly.
A Full Worked Example
Single filer, $85,000 salary, $5,000 in traditional 401(k) contributions, standard deduction.
- Gross income: $85,000
- Minus 401(k): $80,000 AGI
- Minus $16,100 standard deduction: $63,900 taxable income
- Tax:
- 10% on $12,400 = $1,240
- 12% on $38,000 = $4,560
- 22% on $13,500 = $2,970
- Federal tax: $8,770
- Effective rate: 10.3% (on gross income)
Now, what if this person bumps the 401(k) to $10,000? Taxable income drops by $5,000. At the 22% marginal rate, that saves $1,100 in federal taxes. The $5,000 extra contribution only costs $3,900 in reduced take-home pay.
Standard Deduction vs. Itemizing
For 2026, the One Big Beautiful Bill Act set the standard deduction above the earlier inflation-adjusted amounts:
| Filing Status | Standard Deduction |
|---|---|
| Single | $16,100 |
| Married Filing Jointly | $32,200 |
| Head of Household | $24,150 |
The rule is simple: use whichever is larger. With the standard deduction this high, the large majority of filers take it rather than itemize. Itemizing only wins if you have some combination of significant mortgage interest, state and local taxes (capped at $40,400 for 2026, phasing down for modified AGI above $505,000), charitable contributions, and medical expenses above 7.5% of AGI that together exceed the standard deduction.
For a single filer without a mortgage or major charitable giving, itemizing rarely makes sense. For a married couple with a large mortgage in a high-tax state, the calculation is worth running.
Deductions vs. Credits: Why It Matters
This distinction trips people up more than brackets do.
A $1,000 deduction at the 22% bracket saves $220 in taxes. It reduces taxable income, not the tax itself.
A $1,000 credit saves $1,000 in taxes. It comes straight off the bill.
The Child Tax Credit ($2,200 per qualifying child under 17 for 2026) is worth $2,200 in actual tax reduction. A $2,000 charitable donation, by contrast, saves $440-$740 depending on bracket. Both are valuable, but for different reasons.
Tax Planning Without Getting Complicated
The Income Tax Calculator is useful for testing specific questions: what happens to the total if the deductions figure rises by another $5,000 of 401(k) contributions? What does side income cost once it is added to gross income? How much of the bill is FICA rather than income tax? The federal rate is a field rather than a bracket lookup, so running it at 22% and again at 24% shows what a change of bracket would do.
These aren’t questions that need an accountant for a quick estimate. Running the numbers takes a few minutes and often surfaces surprises - particularly around how much pre-tax deductions actually save.
The Annual Tax Planner Template works the other way round, as a place to log the year as it happens: an Income sheet that records each payment with its currency and exchange rate, a Deductions sheet by category, a Quarterly sheet for estimated payments, and a documents checklist. Its Dashboard applies a rate you set per income type, so it totals what you have already recorded rather than reading the federal brackets.
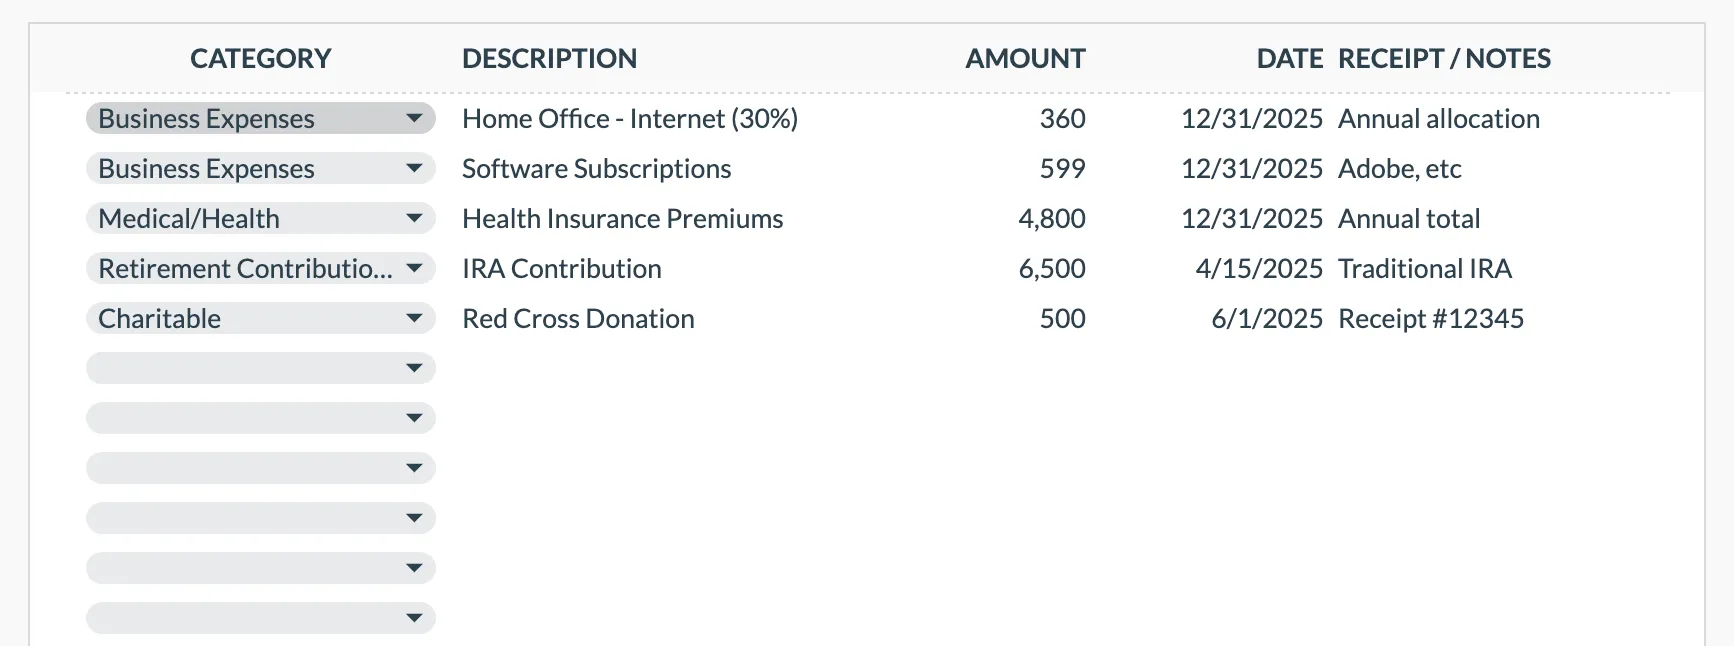 The Annual Tax Planner (Premium) logs each deductible expense against a category picked from the Dashboard list, and the Dashboard turns that running total into a “Less: Deduction Tax Benefit” line set against the year’s gross tax.
More Tax Calculators & Guides
- Paycheck Calculator: Understanding Your Take-Home Pay - Where the deductions go
- Self-Employment Tax Calculator - The extra 15.3% self-employed people pay
- Capital Gains Tax Calculator - Tax on investment sales
- After-Tax Return Calculator - What investments really earn after taxes
- HSA Calculator: Triple Tax Advantage - The most tax-efficient account
Related
Frequently asked questions
Does moving into a higher tax bracket mean all my income is taxed at the higher rate?
No. Only the income above the bracket threshold is taxed at the higher rate. Your effective (average) rate is always lower than your marginal (highest) bracket.
Should I take the standard deduction or itemize?
Whichever is larger. For 2026 the standard deduction is $16,100 (single) or $32,200 (married filing jointly), following the One Big Beautiful Bill Act. Itemizing only helps if your eligible deductions add up to more than that.
What's the difference between a tax deduction and a tax credit?
A deduction reduces your taxable income. A credit reduces your tax bill directly. A $1,000 credit saves $1,000 in taxes. A $1,000 deduction saves $220-$370 depending on your bracket.
Why is my refund different from what I expected?
Refunds reflect over-withholding, not your total tax situation. Changes in income, deductions, credits, or withholding allowances all affect the refund amount.
Does the calculator account for state income tax?
Yes. The Income Tax Calculator has a State Tax Rate field and a Local Tax Rate field alongside the federal one, and it lists state tax and local tax as separate lines in the breakdown. Rates vary by state and some states have no income tax at all, so the rate you enter is the one it applies.
Are Social Security and Medicare taxes included in this estimate?
Yes. The calculator has Social Security Rate, Medicare Rate and SS Wage Cap fields, set by default to 6.2%, 1.45% and $184,500, and it reports the combined figure on a FICA line in the breakdown. The Paycheck Calculator goes further into how withholding reaches your payslip.
Sources
- IRS releases tax inflation adjustments for tax year 2026 - Internal Revenue Service
- Federal income tax rates and brackets - Internal Revenue Service
- One Big Beautiful Bill provisions: Individuals and workers - Internal Revenue Service
- Child Tax Credit - Internal Revenue Service
About this article
Federal bracket, standard deduction, SALT cap and Child Tax Credit figures were checked against the IRS on 2026-09-10 for tax year 2026, using the Rev. Proc. 2025-32 inflation-adjustment release and the One Big Beautiful Bill Act guidance. The worked examples were recalculated by hand from those 2026 brackets. Calculator inputs and outputs were checked on 2026-09-10 against the shipped Income Tax Calculator (gross income, total deductions, federal, state and local rate fields, pay frequency, Social Security and Medicare rates, SS wage cap; total tax, effective rate, after-tax income and the taxable income, federal, state, local and FICA breakdown). Annual Tax Planner claims were checked on 2026-09-10 against the shipped workbook (Dashboard, Income, Deductions, Quarterly, Documents Checklist, Exchange Rates and Instructions sheets). Last reviewed September 2026.